
During the 1960s, Americans across the country boycotted, sat, and marched to protest discrimination, segregation, and disenfranchisement of African Americans. The consequential Civil Rights Act of 1964 and Voting Rights Act of 1965 ended the Jim Crow laws that upheld segregation, but centuries of rooted racism and practices do not change overnight. Even today, structural racism remains very much alive and well in the United States.
In the past few years, many Americans have once again taken to the streets to call attention to the racial achievement gaps that persist in cities and states across the country, and to protest racial inequality at all levels. To identify the worst states for Black Americans, 24/7 Wall St. used census and other agencies data to create an index that measures racial gaps in income, poverty, education, homeownership, and opportunity in all 50 states. It is important to note that this list does not rank the states based on the absolute socioeconomic conditions of Black Americans, but rather is on the socioeconomic gaps between the white and Black population in each state.
Nationwide, the typical black household earns just 63.1% of what the typical white household earns a year. Black Americans are more than twice as likely to live below the poverty line or be unemployed as white Americans and are nearly five times as likely to be incarcerated.
In some states, the racial gaps are far more pronounced. In Wisconsin, for example, the Black median household income is 49.9% of the white median household income — the largest income disparity of any state. Similarly, the disparities in poverty, mortality, educational attainment, homeownership, unemployment, and incarceration levels are some of the largest.
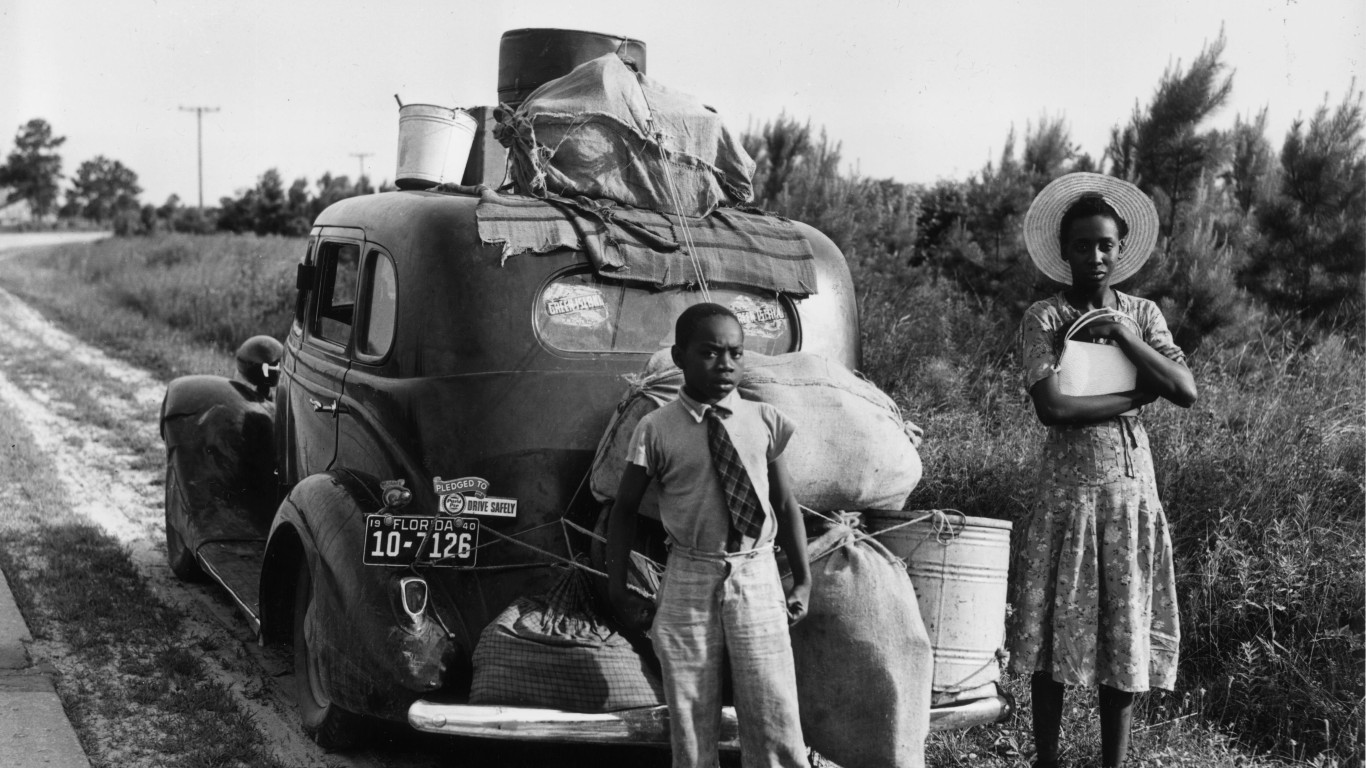
A bulk of the worst states for Black Americans are in the Midwest, where millions of Black Americans moved during the Great Migration of the early 20th century. Today, many areas in the Midwest are in economic decline that disproportionately affects minority workers. (Here are cities with the most Black-owned businesses.)
One of the biggest factors reinforcing racial inequality in the U.S. today is de facto residential segregation. While the Fair Housing Act of 1968 outlawed housing discrimination on the basis of race, sex, national origin, and religion, the legacy of redlining and other discriminatory housing policies, which effectively segregated Black Americans to certain neighborhoods, continue to shape the demographic composition of neighborhoods into the 21st century, limiting opportunities for Black Americans and widening achievement gaps by race. (Also see, the worst cities for Black Americans.)
Click here to see the worst states for Black Americans.
Click here to read our detailed methodology.

50. Hawaii
> Black population: 26,521 (1.8% of total)
> Median household income: $73,924 (Black); $87,367 (white)
> Homeownership rate: 27.0% (Black); 56.4% (white)
> Unemployment rate: 12.2% (Black); 5.6% (white)
> Poverty rate: 9.3% (Black); 10.0% (white)
[in-text-ad]
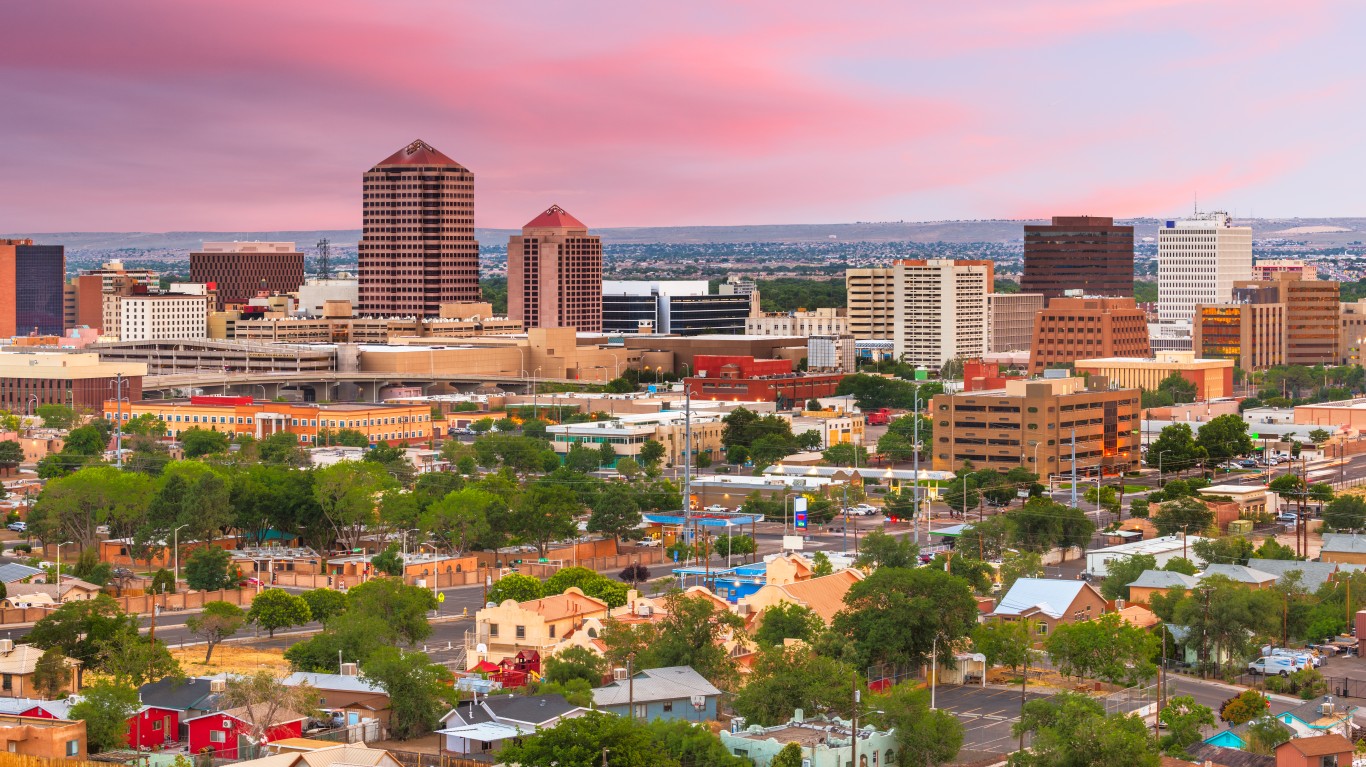
49. New Mexico
> Black population: 37,848 (1.8% of total)
> Median household income: $44,669 (Black); $57,815 (white)
> Homeownership rate: 37.2% (Black); 69.9% (white)
> Unemployment rate: 9.0% (Black); 6.0% (white)
> Poverty rate: 22.5% (Black); 15.6% (white)

48. Texas
> Black population: 3,401,742 (11.8% of total)
> Median household income: $50,916 (Black); $72,829 (white)
> Homeownership rate: 41.3% (Black); 67.4% (white)
> Unemployment rate: 8.4% (Black); 4.6% (white)
> Poverty rate: 18.6% (Black); 12.4% (white)
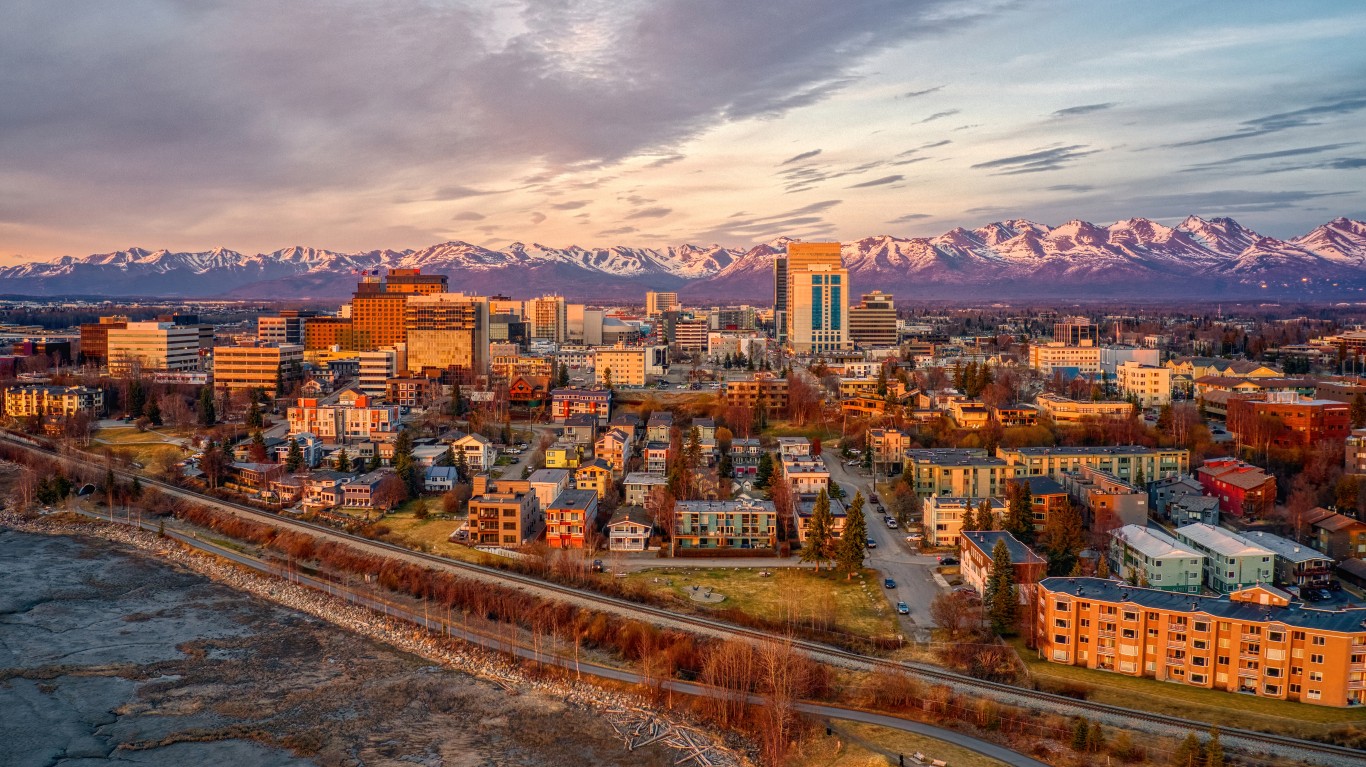
47. Alaska
> Black population: 22,787 (3.1% of total)
> Median household income: $66,769 (Black); $87,920 (white)
> Homeownership rate: 37.2% (Black); 69.6% (white)
> Unemployment rate: 4.6% (Black); 5.1% (white)
> Poverty rate: 11.3% (Black); 7.2% (white)
[in-text-ad-2]

46. Arizona
> Black population: 299,877 (4.2% of total)
> Median household income: $53,303 (Black); $68,643 (white)
> Homeownership rate: 36.8% (Black); 69.5% (white)
> Unemployment rate: 8.3% (Black); 5.0% (white)
> Poverty rate: 18.7% (Black); 11.5% (white)

45. Kentucky
> Black population: 356,610 (7.9% of total)
> Median household income: $40,335 (Black); $57,430 (white)
> Homeownership rate: 37.8% (Black); 71.8% (white)
> Unemployment rate: 8.6% (Black); 4.9% (white)
> Poverty rate: 25.2% (Black); 15.1% (white)
[in-text-ad]

44. Oregon
> Black population: 74,010 (1.8% of total)
> Median household income: $50,950 (Black); $70,922 (white)
> Homeownership rate: 36.2% (Black); 65.5% (white)
> Unemployment rate: 6.7% (Black); 5.5% (white)
> Poverty rate: 24.2% (Black); 11.3% (white)
 24/7 Wall St.
43. West Virginia
> Black population: 60,339 (3.4% of total)
> Median household income: $34,163 (Black); $51,585 (white)
> Homeownership rate: 42.3% (Black); 75.5% (white)
> Unemployment rate: 9.8% (Black); 6.2% (white)
> Poverty rate: 27.6% (Black); 16.2% (white)

42. Georgia
> Black population: 3,309,398 (31.1% of total)
> Median household income: $50,169 (Black); $74,381 (white)
> Homeownership rate: 48.4% (Black); 74.0% (white)
> Unemployment rate: 8.2% (Black); 4.1% (white)
> Poverty rate: 19.5% (Black); 10.3% (white)
[in-text-ad-2]
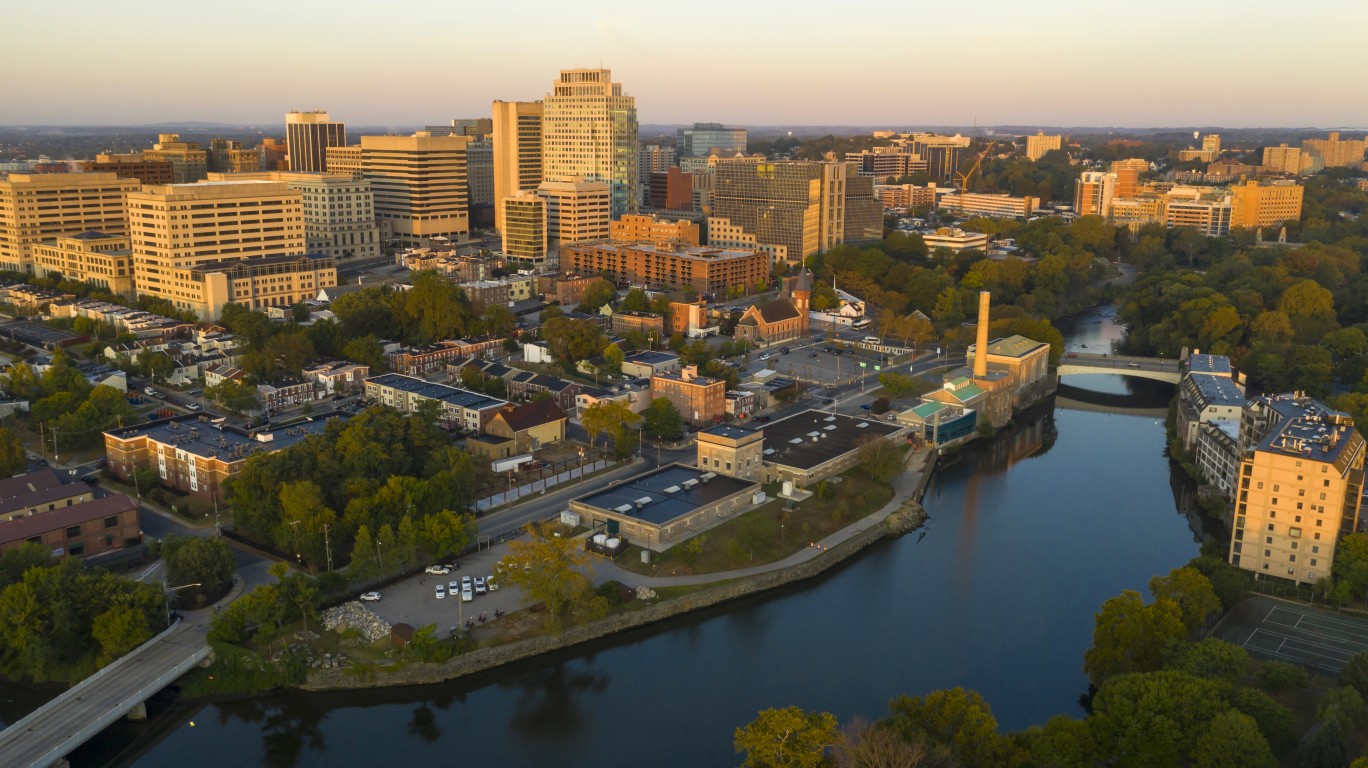
41. Delaware
> Black population: 211,387 (21.5% of total)
> Median household income: $53,636 (Black); $78,491 (white)
> Homeownership rate: 51.1% (Black); 79.2% (white)
> Unemployment rate: 8.0% (Black); 4.9% (white)
> Poverty rate: 17.8% (Black); 8.4% (white)
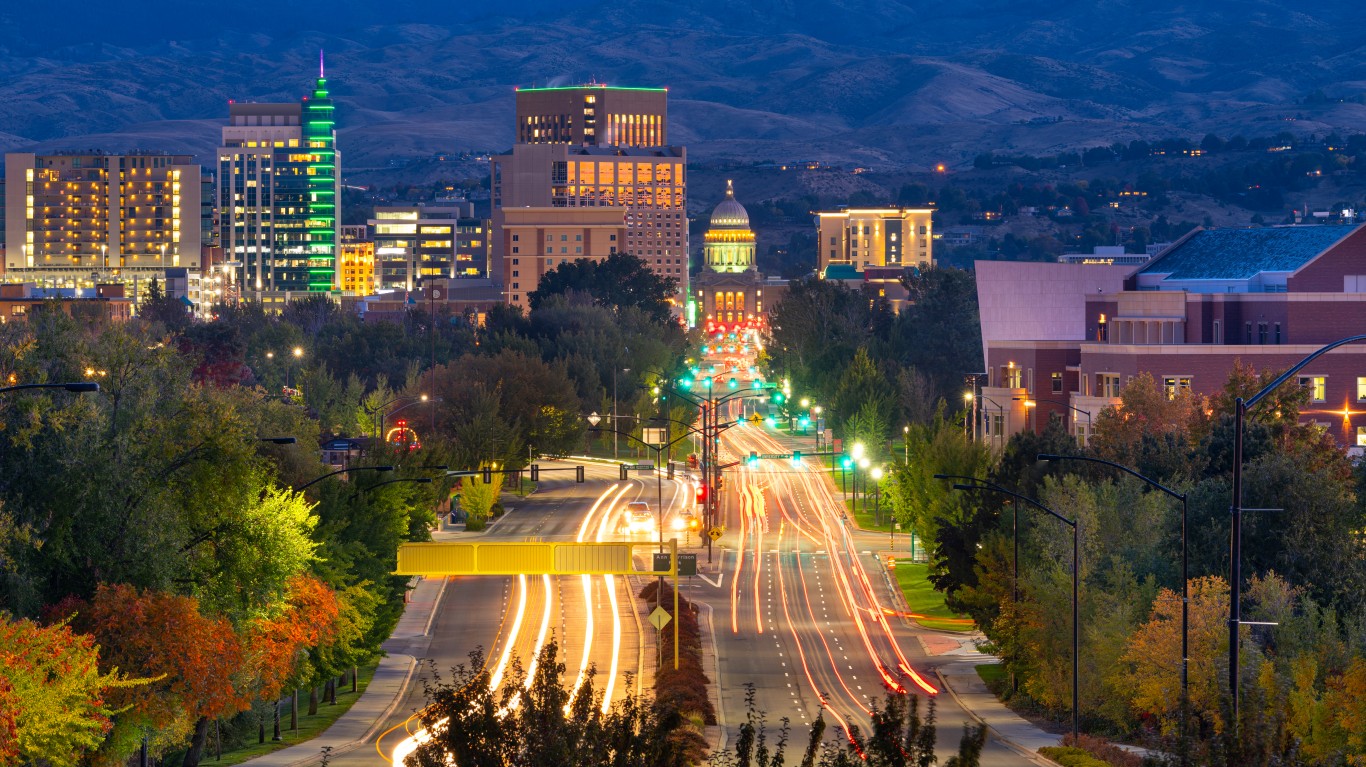
40. Idaho
> Black population: 11,392 (0.6% of total)
> Median household income: $46,696 (Black); $64,579 (white)
> Homeownership rate: 38.9% (Black); 73.3% (white)
> Unemployment rate: 6.7% (Black); 3.9% (white)
> Poverty rate: 24.6% (Black); 10.6% (white)
[in-text-ad]

39. Maryland
> Black population: 1,806,220 (29.4% of total)
> Median household income: $72,931 (Black); $101,579 (white)
> Homeownership rate: 52.1% (Black); 76.5% (white)
> Unemployment rate: 7.8% (Black); 4.0% (white)
> Poverty rate: 13.0% (Black); 6.4% (white)
 24/7 Wall St.
38. Tennessee
> Black population: 1,120,548 (16.3% of total)
> Median household income: $42,396 (Black); $62,556 (white)
> Homeownership rate: 43.7% (Black); 72.7% (white)
> Unemployment rate: 9.4% (Black); 4.4% (white)
> Poverty rate: 23.6% (Black); 11.9% (white)

37. New Hampshire
> Black population: 18,705 (1.4% of total)
> Median household income: $66,692 (Black); $84,009 (white)
> Homeownership rate: 36.9% (Black); 73.2% (white)
> Unemployment rate: 7.6% (Black); 3.7% (white)
> Poverty rate: 16.7% (Black); 7.1% (white)
[in-text-ad-2]
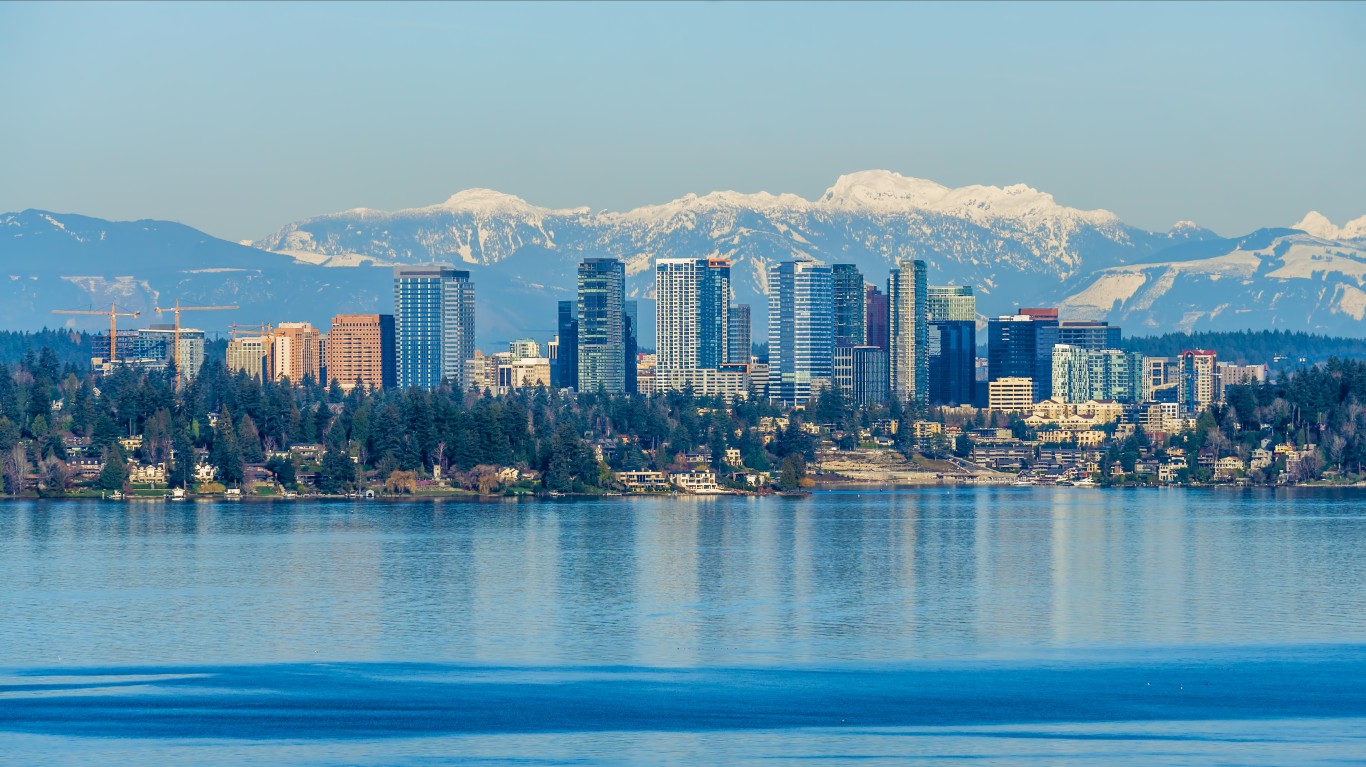
36. Washington
> Black population: 283,174 (3.7% of total)
> Median household income: $59,874 (Black); $83,742 (white)
> Homeownership rate: 33.6% (Black); 67.3% (white)
> Unemployment rate: 8.1% (Black); 4.8% (white)
> Poverty rate: 17.5% (Black); 8.7% (white)

35. Florida
> Black population: 3,223,893 (15.1% of total)
> Median household income: $46,176 (Black); $65,519 (white)
> Homeownership rate: 46.9% (Black); 71.8% (white)
> Unemployment rate: 8.1% (Black); 4.6% (white)
> Poverty rate: 20.5% (Black); 11.1% (white)
[in-text-ad]

34. Oklahoma
> Black population: 278,454 (7.1% of total)
> Median household income: $39,021 (Black); $60,807 (white)
> Homeownership rate: 40.0% (Black); 70.1% (white)
> Unemployment rate: 8.9% (Black); 4.4% (white)
> Poverty rate: 26.4% (Black); 12.8% (white)
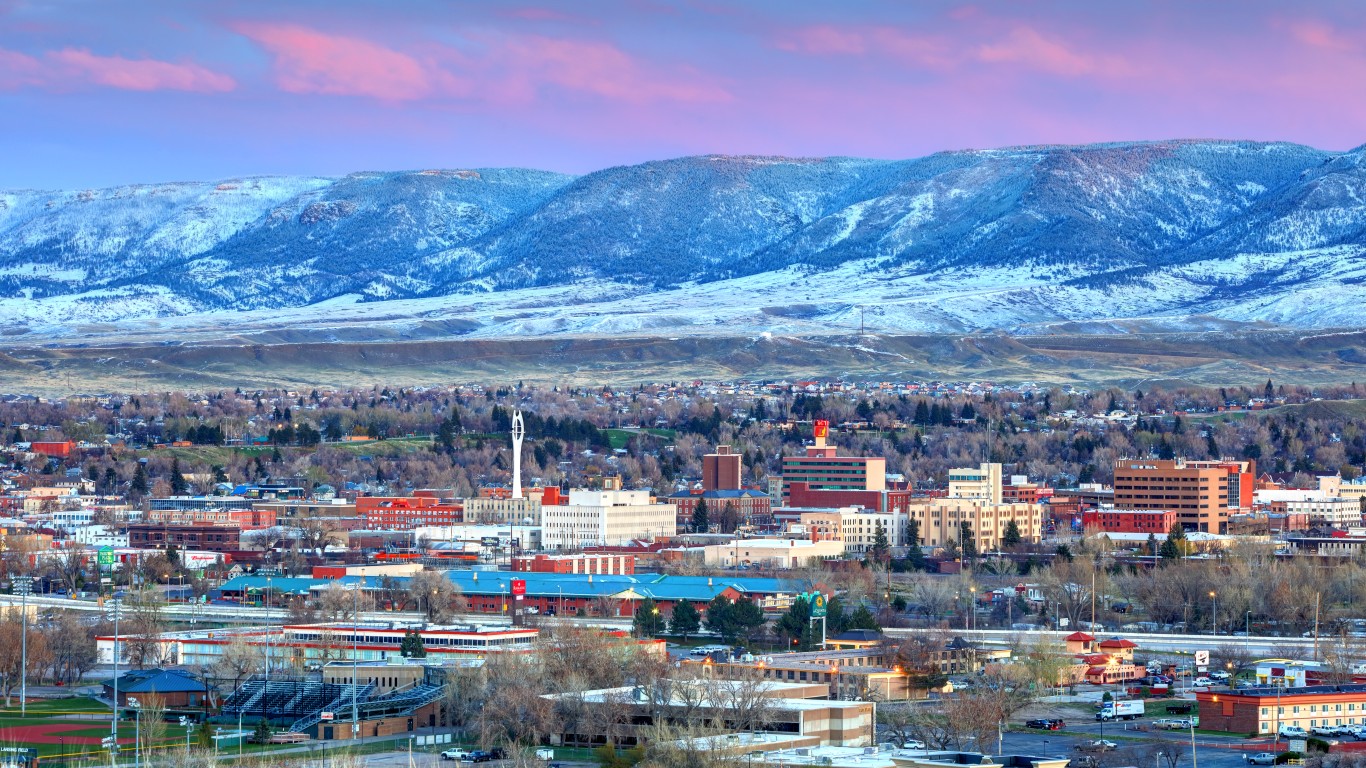
33. Wyoming
> Black population: 4,811 (0.8% of total)
> Median household income: $43,621 (Black); $68,965 (white)
> Homeownership rate: 38.3% (Black); 72.9% (white)
> Unemployment rate: 11.0% (Black); 3.8% (white)
> Poverty rate: 36.5% (Black); 10.0% (white)
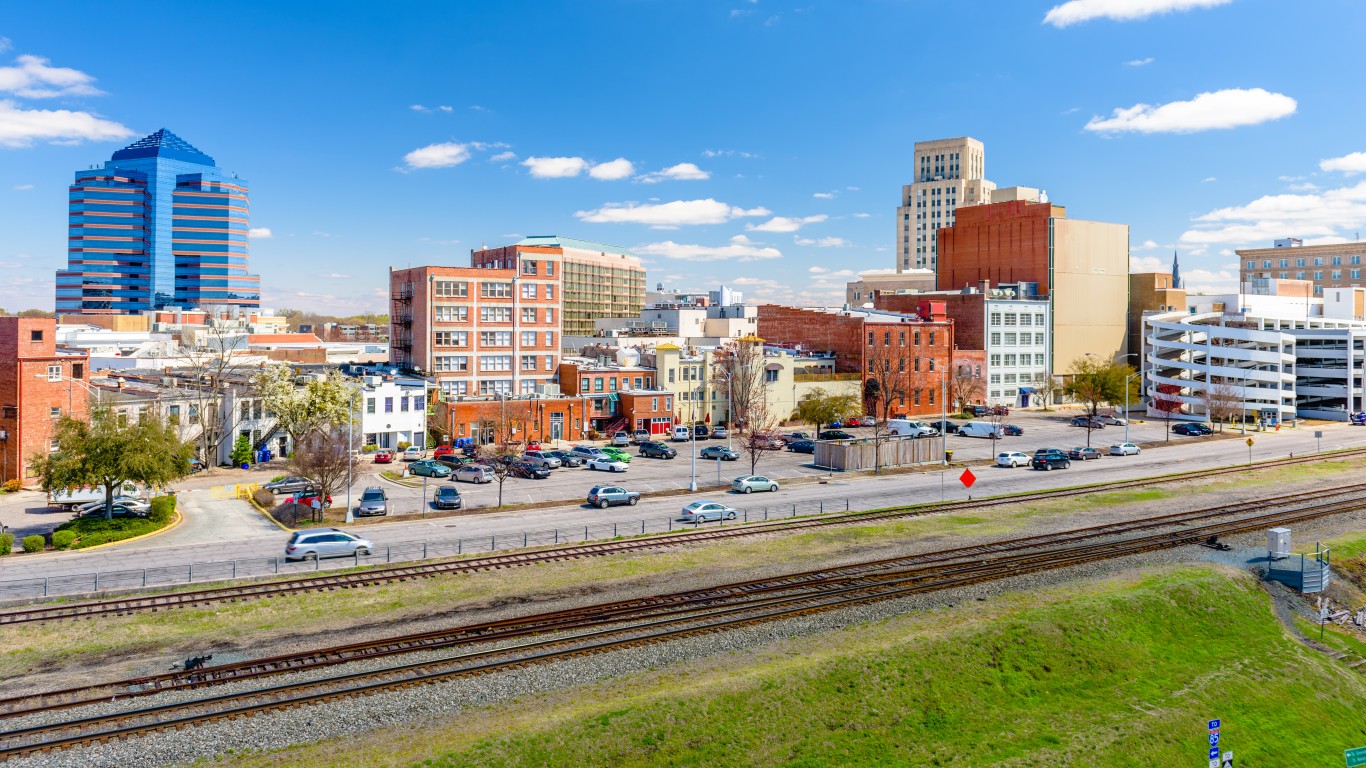
32. North Carolina
> Black population: 2,160,554 (20.8% of total)
> Median household income: $42,996 (Black); $67,336 (white)
> Homeownership rate: 46.2% (Black); 73.2% (white)
> Unemployment rate: 8.3% (Black); 4.3% (white)
> Poverty rate: 21.1% (Black); 10.4% (white)
[in-text-ad-2]

31. Rhode Island
> Black population: 59,203 (5.4% of total)
> Median household income: $52,703 (Black); $79,332 (white)
> Homeownership rate: 34.5% (Black); 67.4% (white)
> Unemployment rate: 8.2% (Black); 5.3% (white)
> Poverty rate: 19.3% (Black); 8.9% (white)

30. Virginia
> Black population: 1,601,041 (18.7% of total)
> Median household income: $55,413 (Black); $86,797 (white)
> Homeownership rate: 48.3% (Black); 72.7% (white)
> Unemployment rate: 7.2% (Black); 3.8% (white)
> Poverty rate: 16.7% (Black); 7.9% (white)
[in-text-ad]

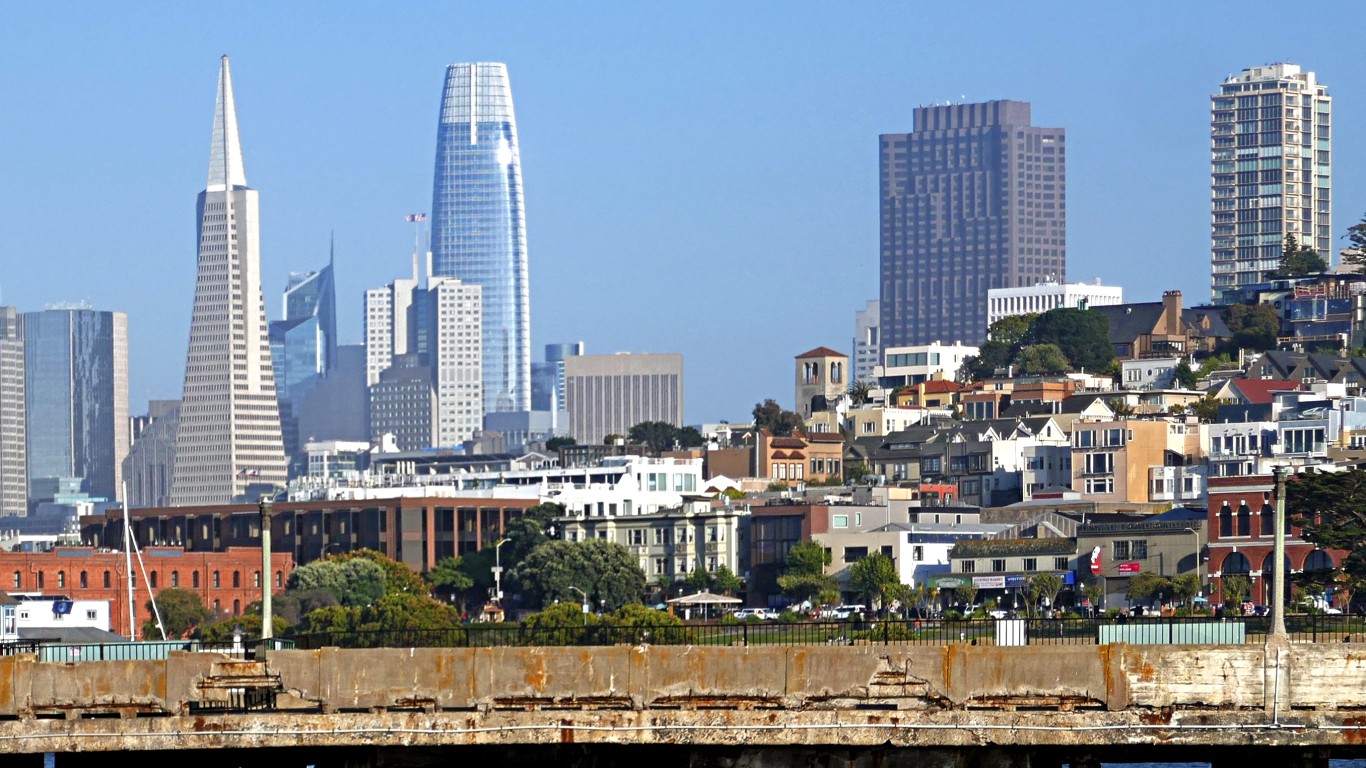
29. California
> Black population: 2,128,184 (5.4% of total)
> Median household income: $58,958 (Black); $88,616 (white)
> Homeownership rate: 35.6% (Black); 60.0% (white)
> Unemployment rate: 10.5% (Black); 6.0% (white)
> Poverty rate: 19.2% (Black); 10.9% (white)
 24/7 Wall St.
28. Arkansas
> Black population: 455,748 (15.2% of total)
> Median household income: $35,200 (Black); $55,985 (white)
> Homeownership rate: 44.0% (Black); 71.6% (white)
> Unemployment rate: 9.4% (Black); 4.5% (white)
> Poverty rate: 28.2% (Black); 13.1% (white)

27. Alabama
> Black population: 1,316,314 (26.3% of total)
> Median household income: $37,215 (Black); $63,592 (white)
> Homeownership rate: 51.1% (Black); 77.0% (white)
> Unemployment rate: 8.9% (Black); 4.1% (white)
> Poverty rate: 25.2% (Black); 11.5% (white)
[in-text-ad-2]

26. Nevada
> Black population: 273,070 (8.9% of total)
> Median household income: $43,327 (Black); $71,123 (white)
> Homeownership rate: 30.2% (Black); 63.7% (white)
> Unemployment rate: 12.5% (Black); 6.2% (white)
> Poverty rate: 22.7% (Black); 10.7% (white)
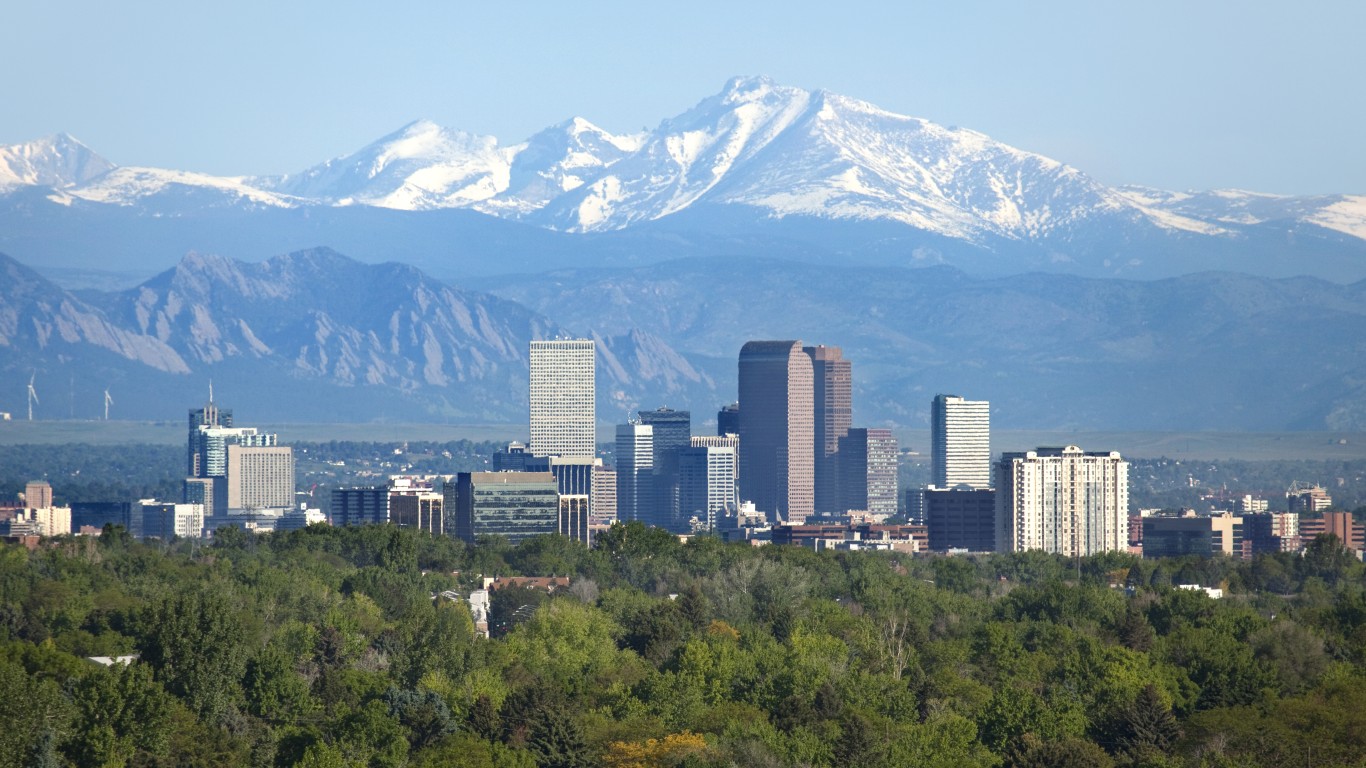
25. Colorado
> Black population: 222,572 (3.9% of total)
> Median household income: $57,118 (Black); $83,303 (white)
> Homeownership rate: 41.7% (Black); 68.8% (white)
> Unemployment rate: 7.8% (Black); 4.2% (white)
> Poverty rate: 16.8% (Black); 8.5% (white)
[in-text-ad]
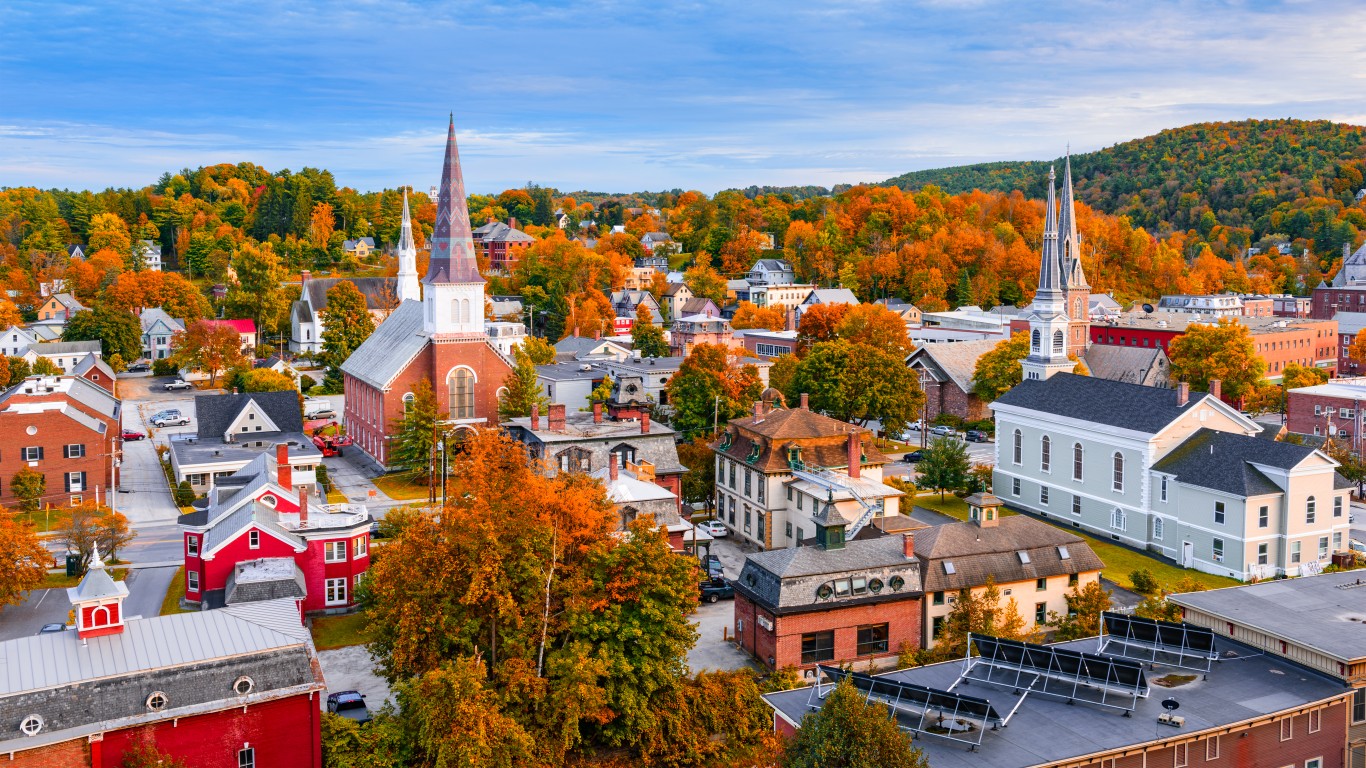
24. Vermont
> Black population: 7,643 (1.2% of total)
> Median household income: $43,603 (Black); $68,389 (white)
> Homeownership rate: 26.1% (Black); 73.4% (white)
> Unemployment rate: 6.4% (Black); 3.8% (white)
> Poverty rate: 20.3% (Black); 10.1% (white)
 24/7 Wall St.
23. South Dakota
> Black population: 18,736 (2.1% of total)
> Median household income: $45,768 (Black); $67,013 (white)
> Homeownership rate: 20.6% (Black); 72.1% (white)
> Unemployment rate: 3.4% (Black); 2.3% (white)
> Poverty rate: 17.7% (Black); 8.3% (white)
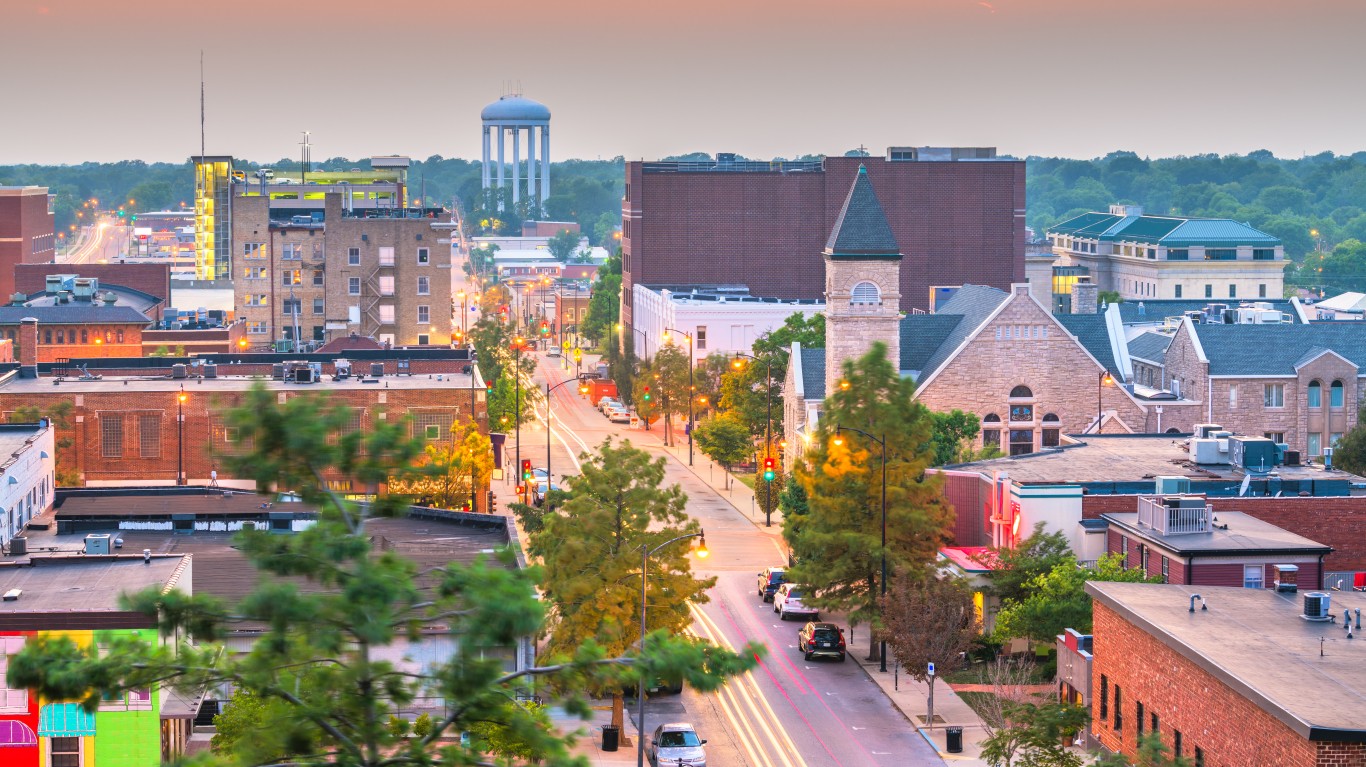
22. Missouri
> Black population: 689,839 (11.2% of total)
> Median household income: $40,346 (Black); $64,383 (white)
> Homeownership rate: 38.8% (Black); 72.4% (white)
> Unemployment rate: 8.2% (Black); 3.9% (white)
> Poverty rate: 23.5% (Black); 10.9% (white)
[in-text-ad-2]

21. Maine
> Black population: 18,834 (1.4% of total)
> Median household income: $44,178 (Black); $63,777 (white)
> Homeownership rate: 26.4% (Black); 74.4% (white)
> Unemployment rate: 5.6% (Black); 4.2% (white)
> Poverty rate: 26.4% (Black); 10.5% (white)
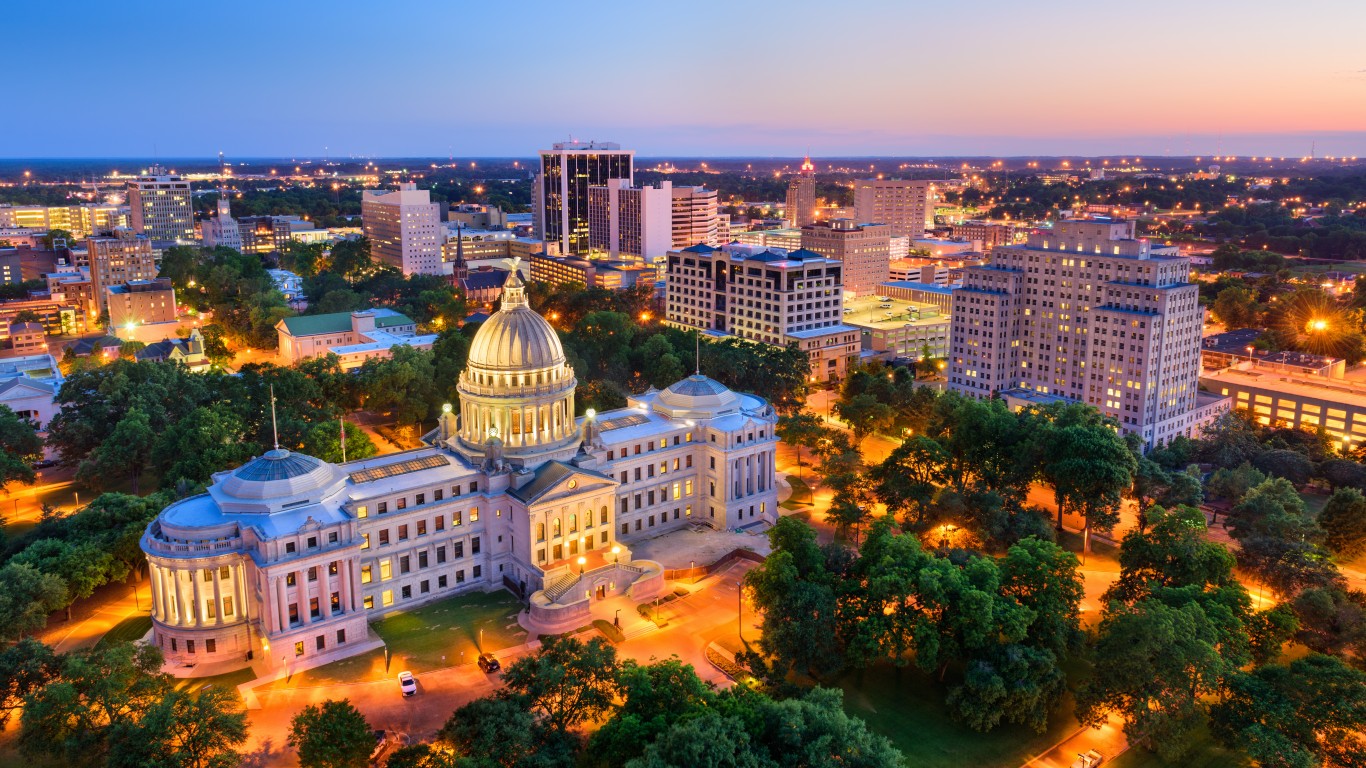
20. Mississippi
> Black population: 1,109,577 (37.4% of total)
> Median household income: $33,348 (Black); $60,976 (white)
> Homeownership rate: 53.9% (Black); 78.6% (white)
> Unemployment rate: 10.0% (Black); 4.9% (white)
> Poverty rate: 30.4% (Black); 12.0% (white)
[in-text-ad]
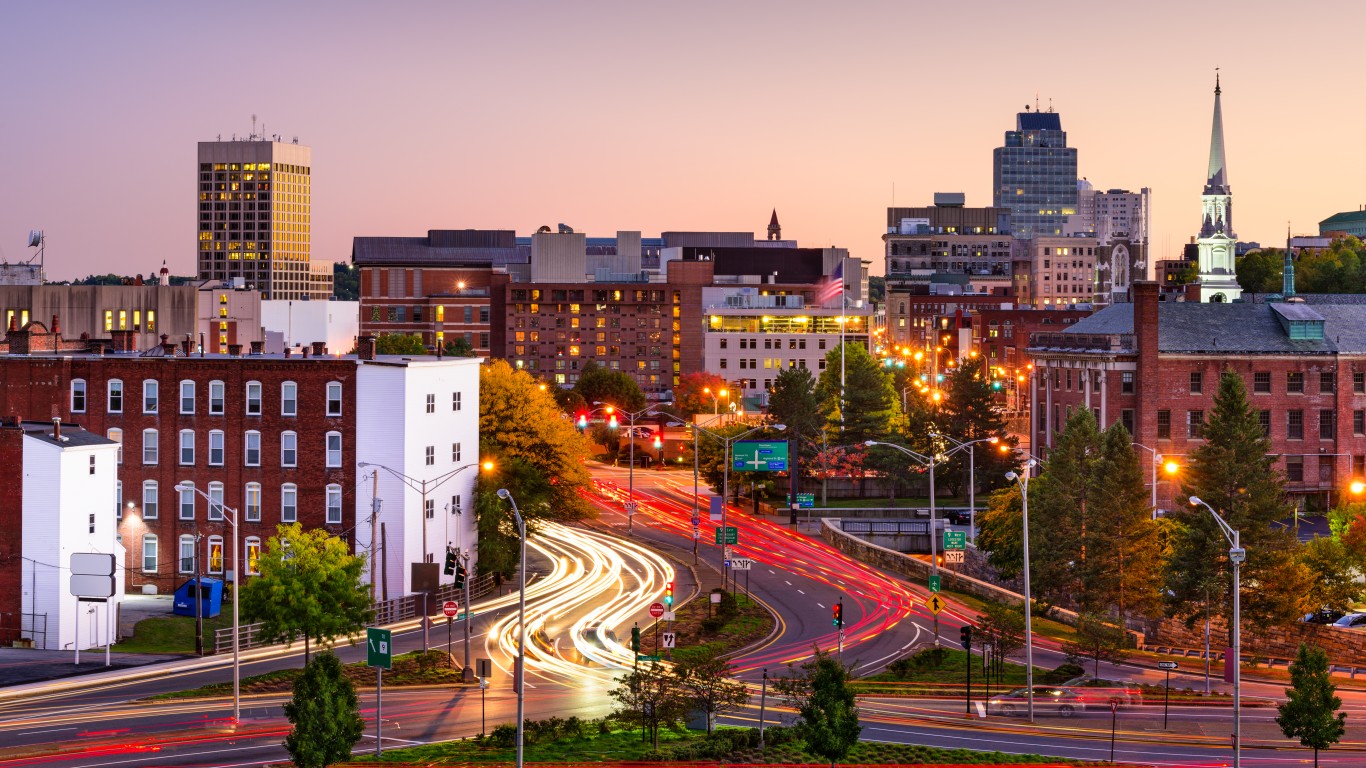
19. Massachusetts
> Black population: 467,943 (6.7% of total)
> Median household income: $60,232 (Black); $94,510 (white)
> Homeownership rate: 35.3% (Black); 68.2% (white)
> Unemployment rate: 8.4% (Black); 4.7% (white)
> Poverty rate: 16.7% (Black); 7.8% (white)
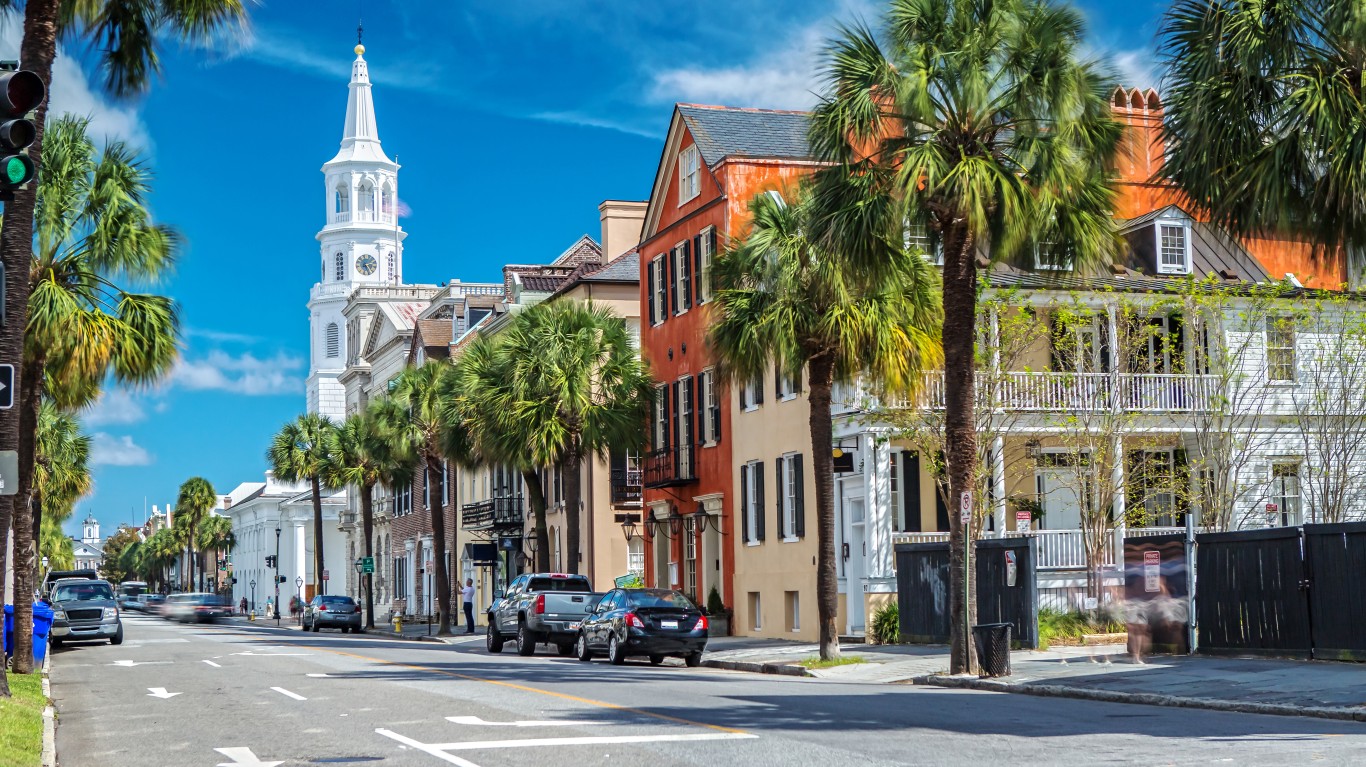
18. South Carolina
> Black population: 1,319,130 (26.0% of total)
> Median household income: $38,777 (Black); $67,239 (white)
> Homeownership rate: 53.2% (Black); 77.6% (white)
> Unemployment rate: 7.9% (Black); 4.3% (white)
> Poverty rate: 23.7% (Black); 10.3% (white)
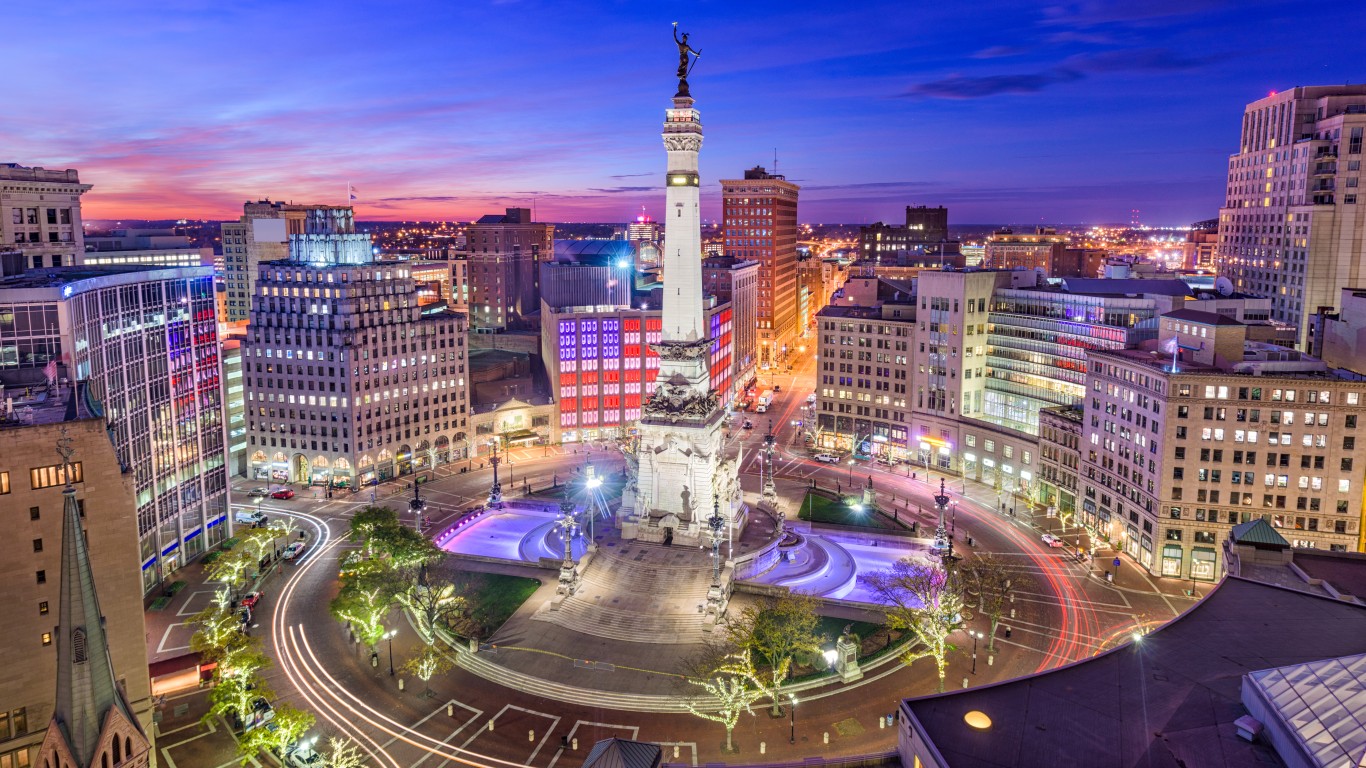
17. Indiana
> Black population: 625,756 (9.3% of total)
> Median household income: $38,445 (Black); $65,238 (white)
> Homeownership rate: 37.6% (Black); 74.5% (white)
> Unemployment rate: 9.9% (Black); 4.1% (white)
> Poverty rate: 25.8% (Black); 10.3% (white)
[in-text-ad-2]
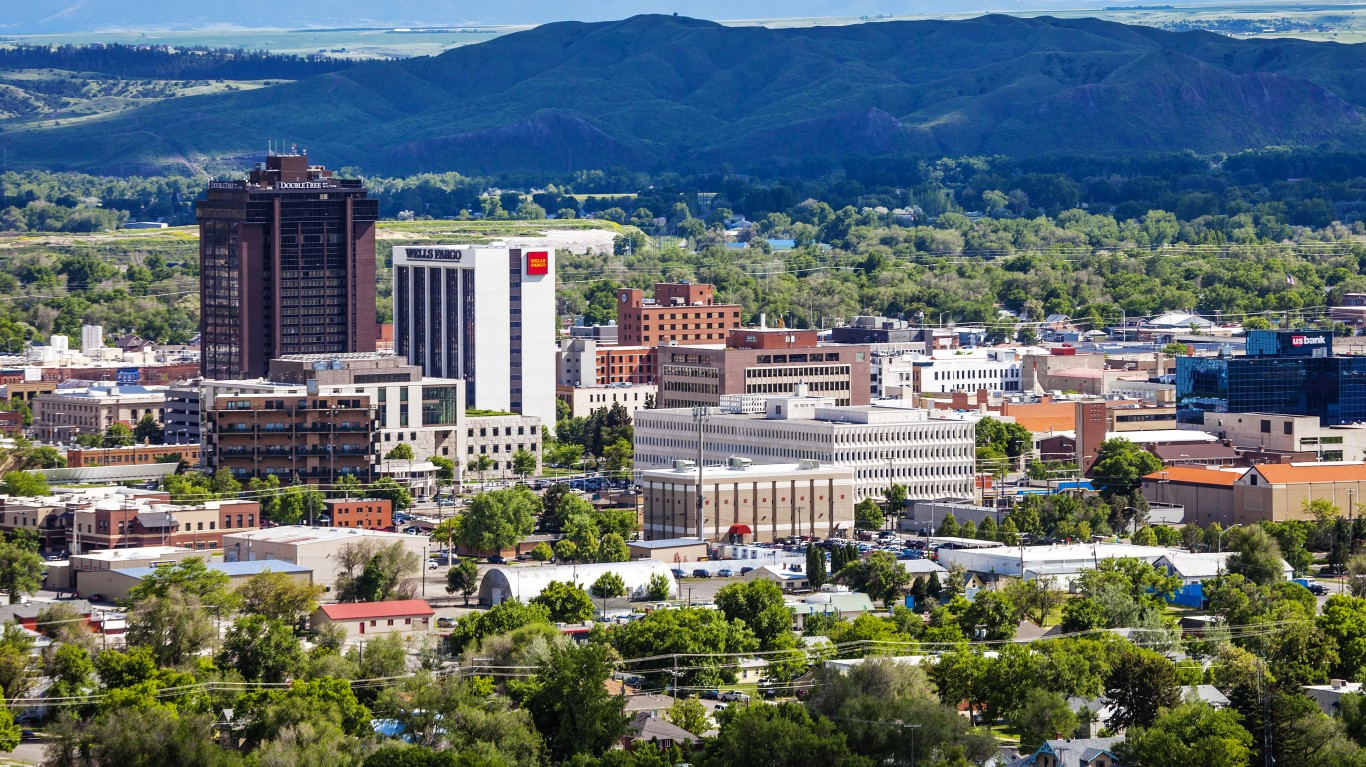
16. Montana
> Black population: 5,339 (0.5% of total)
> Median household income: $45,433 (Black); $62,091 (white)
> Homeownership rate: 24.0% (Black); 70.7% (white)
> Unemployment rate: 11.7% (Black); 3.3% (white)
> Poverty rate: 15.5% (Black); 10.7% (white)

15. New York
> Black population: 2,797,225 (13.9% of total)
> Median household income: $53,697 (Black); $83,877 (white)
> Homeownership rate: 32.2% (Black); 64.5% (white)
> Unemployment rate: 9.2% (Black); 5.0% (white)
> Poverty rate: 20.2% (Black); 10.0% (white)
[in-text-ad]

14. Louisiana
> Black population: 1,475,549 (31.7% of total)
> Median household income: $33,829 (Black); $64,965 (white)
> Homeownership rate: 48.6% (Black); 76.2% (white)
> Unemployment rate: 10.4% (Black); 4.9% (white)
> Poverty rate: 30.3% (Black); 12.4% (white)
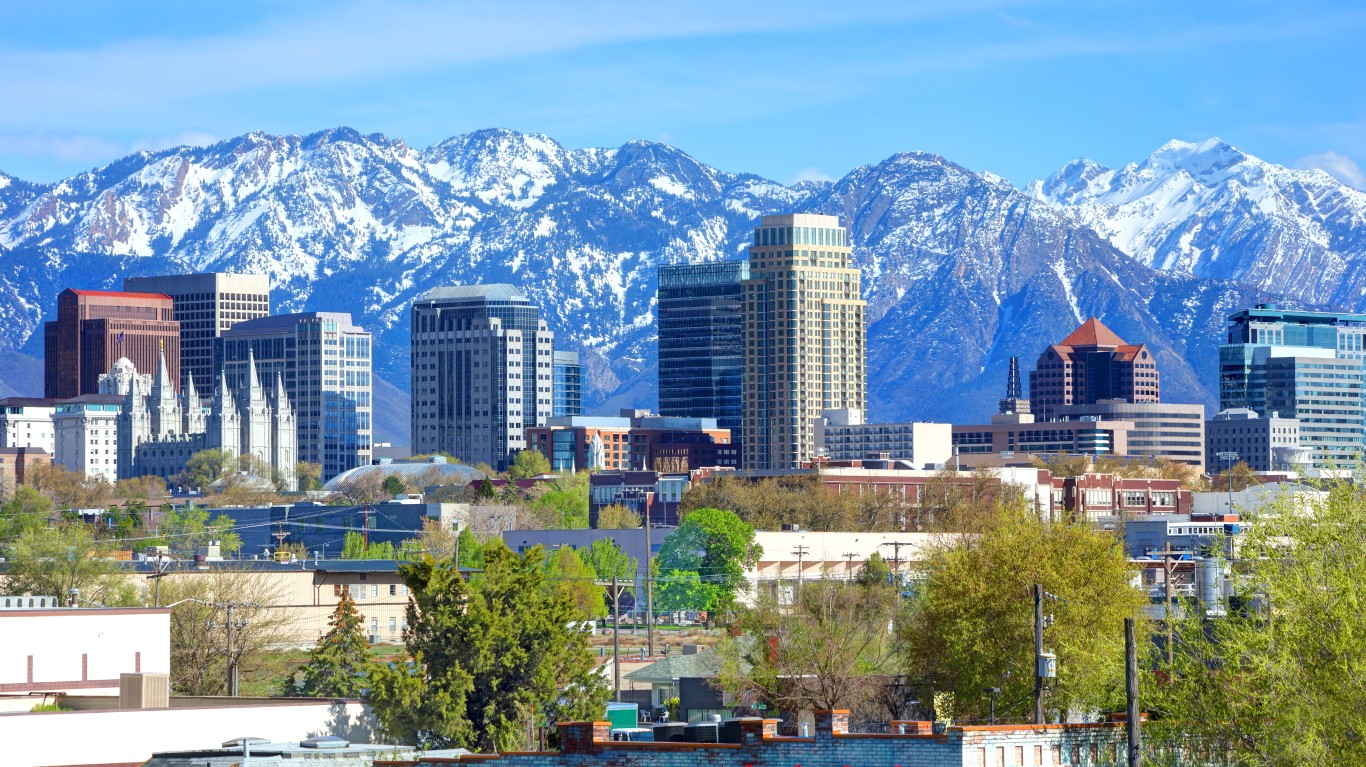
13. Utah
> Black population: 35,281 (1.1% of total)
> Median household income: $48,343 (Black); $81,350 (white)
> Homeownership rate: 28.1% (Black); 72.9% (white)
> Unemployment rate: 5.8% (Black); 3.2% (white)
> Poverty rate: 21.2% (Black); 7.9% (white)

12. Kansas
> Black population: 159,382 (5.4% of total)
> Median household income: $42,057 (Black); $66,892 (white)
> Homeownership rate: 36.0% (Black); 69.9% (white)
> Unemployment rate: 9.1% (Black); 3.6% (white)
> Poverty rate: 23.8% (Black); 9.7% (white)
[in-text-ad-2]

11. Connecticut
> Black population: 359,156 (10.0% of total)
> Median household income: $54,325 (Black); $91,524 (white)
> Homeownership rate: 40.6% (Black); 73.3% (white)
> Unemployment rate: 8.8% (Black); 5.2% (white)
> Poverty rate: 17.3% (Black); 7.5% (white)

10. Pennsylvania
> Black population: 1,360,025 (10.5% of total)
> Median household income: $42,431 (Black); $71,844 (white)
> Homeownership rate: 43.5% (Black); 74.0% (white)
> Unemployment rate: 11.1% (Black); 4.6% (white)
> Poverty rate: 24.6% (Black); 9.1% (white)
[in-text-ad]

9. Ohio
> Black population: 1,432,646 (12.2% of total)
> Median household income: $36,929 (Black); $66,456 (white)
> Homeownership rate: 35.8% (Black); 72.4% (white)
> Unemployment rate: 10.6% (Black); 4.3% (white)
> Poverty rate: 27.7% (Black); 10.6% (white)
 24/7 Wall St.
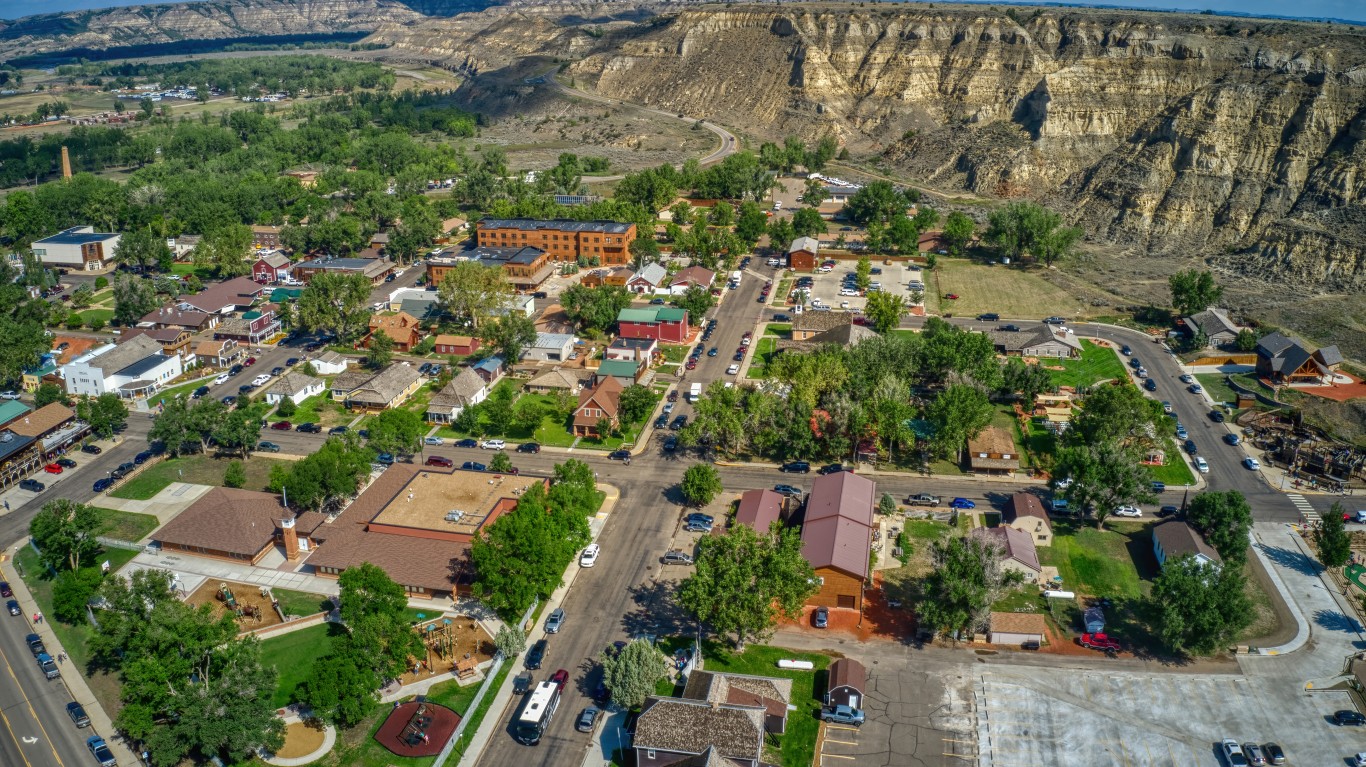
8. North Dakota
> Black population: 23,887 (3.1% of total)
> Median household income: $41,653 (Black); $71,755 (white)
> Homeownership rate: 9.3% (Black); 67.2% (white)
> Unemployment rate: 7.9% (Black); 2.6% (white)
> Poverty rate: 25.9% (Black); 8.4% (white)

7. New Jersey
> Black population: 1,158,820 (12.5% of total)
> Median household income: $59,207 (Black); $97,180 (white)
> Homeownership rate: 39.2% (Black); 72.5% (white)
> Unemployment rate: 9.2% (Black); 5.3% (white)
> Poverty rate: 16.6% (Black); 7.4% (white)
[in-text-ad-2]

6. Nebraska
> Black population: 91,326 (4.7% of total)
> Median household income: $40,850 (Black); $68,849 (white)
> Homeownership rate: 29.6% (Black); 70.1% (white)
> Unemployment rate: 8.3% (Black); 2.8% (white)
> Poverty rate: 22.4% (Black); 8.8% (white)
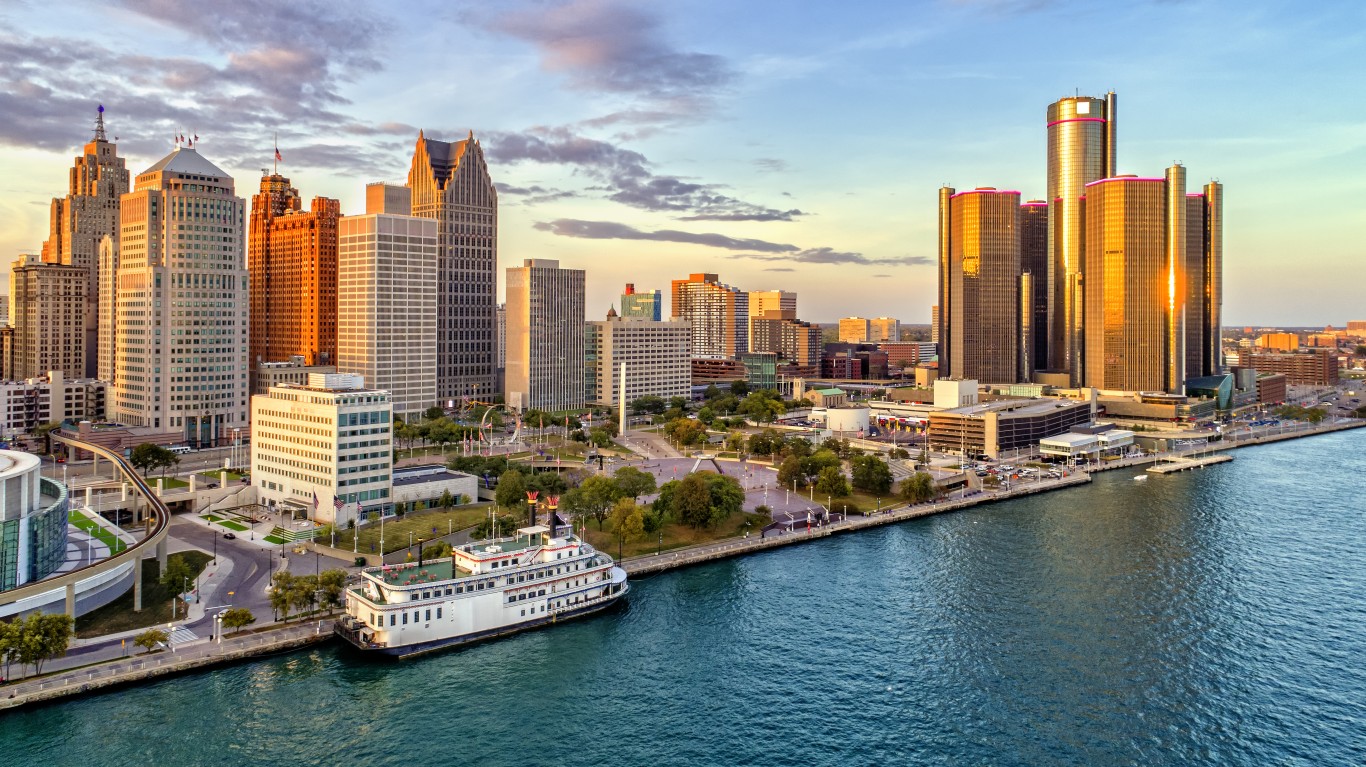
5. Michigan
> Black population: 1,351,051 (13.4% of total)
> Median household income: $38,950 (Black); $67,336 (white)
> Homeownership rate: 42.7% (Black); 78.1% (white)
> Unemployment rate: 13.1% (Black); 5.0% (white)
> Poverty rate: 26.6% (Black); 10.6% (white)
[in-text-ad]
4. Illinois
> Black population: 1,773,138 (13.8% of total)
> Median household income: $43,183 (Black); $78,666 (white)
> Homeownership rate: 39.6% (Black); 73.5% (white)
> Unemployment rate: 13.7% (Black); 4.8% (white)
> Poverty rate: 24.7% (Black); 8.9% (white)

3. Minnesota
> Black population: 371,249 (6.5% of total)
> Median household income: $44,484 (Black); $80,991 (white)
> Homeownership rate: 27.2% (Black); 76.7% (white)
> Unemployment rate: 8.6% (Black); 3.4% (white)
> Poverty rate: 25.0% (Black); 7.1% (white)

2. Iowa
> Black population: 116,206 (3.7% of total)
> Median household income: $37,530 (Black); $66,994 (white)
> Homeownership rate: 26.2% (Black); 74.3% (white)
> Unemployment rate: 11.0% (Black); 3.4% (white)
> Poverty rate: 29.7% (Black); 9.6% (white)
[in-text-ad-2]

1. Wisconsin
> Black population: 364,446 (6.2% of total)
> Median household income: $34,998 (Black); $70,167 (white)
> Homeownership rate: 25.7% (Black); 71.7% (white)
> Unemployment rate: 8.3% (Black); 3.0% (white)
> Poverty rate: 29.2% (Black); 8.5% (white)
Methodology
To determine the worst states for Black Americans, 24/7 Wall St. created an index consisting of eight measures to assess race-based gaps in socioeconomic outcomes. Six of the measures — median household income, poverty, adult high school and bachelor’s degree attainment, homeownership, and unemployment rates — are based on five-year estimates from the U.S. Census Bureau’s 2021 American Community. The seventh measure, prisoners under the jurisdiction of state or federal correctional authorities by race per 100,000 residents, is based on Bureau of Justice Statistics data that is current as of Dec. 31, 2020. The eighth measure, age-adjusted mortality rate by race, is based on data from 2019 to 2021 from the Centers for Disease Control and Prevention.
For each measure, we constructed an index from the gaps between Black and white Americans. The index was standardized using min-max normalization. We also included the population of Black, non-Hispanic-or-Latino Americans as a percentage of the total population in the index at full weight. Data on population by race also came from the ACS.
It’s Your Money, Your Future—Own It (sponsor)
Retirement can be daunting, but it doesn’t need to be.
Imagine having an expert in your corner to help you with your financial goals. Someone to help you determine if you’re ahead, behind, or right on track. With SmartAsset, that’s not just a dream—it’s reality. This free tool connects you with pre-screened financial advisors who work in your best interests. It’s quick, it’s easy, so take the leap today and start planning smarter!
Don’t waste another minute; get started right here and help your retirement dreams become a retirement reality.
Thank you for reading! Have some feedback for us?
Contact the 24/7 Wall St. editorial team.

Our expert who first called NVIDIA in 2009 is predicting 2025 will see a historic AI breakthrough.
You can follow him investing $500,000 of his own money on our top AI stocks for free.