Running is one of the most popular forms of exercise among Americans. It can help reduce stress and improve both physical and mental health. While many people opt to run on a treadmill, about 50 million Americans run or jog outdoors. (Here’s a list of 40 celebrities who have run marathons.)
While running on sidewalks or roads is an option, traffic is a potential hazard. Over 100,000 runners are hit by cars every year. Running trails are undoubtedly safer and more pleasant places to exercise than roads – and some cities have far more (and better) running trails than others.
To determine the best cities for runners in 2023, 24/7 Tempo consulted a study conducted by Lawn Love, an online lawn services provider, which compared the 200 largest U.S. cities based on 28 differently weighted metrics across seven pertinent categories, drawing on data from 15 government and private sources.
The study considered running access (number of running trails, fitness centers, etc.), running quality (ratings and reviews of running trails and other factors), safety (number of pedestrian fatalities and crime index), climate (number of extremely hot and extremely cold days, air quality index, and monthly rain averages), foot care (number of shoe stores, podiatrists, etc.), affordability (share of household income spent on gym membership, footwear, and sports apparel), and community (number of adult running clubs, events and races, etc.).
Many of the top ten cities for runners are out West. In fact, nearly half of the top 20 cities for runners are in California. San Francisco, the best city for runners overall, had the highest share of residents living within a ten-minute walk of a park. It also took the lead in the running quality metric, with highly rated running trails including scenic routes through the Presidio and bayside routes through Lands End in the Golden Gate National Recreation Area. It also had some of the best running community and climate scores. The downside? It fell to 100th place for safety.
Click here to see the best cities to live in, if you are a runner
The city that scored highest in running access is Portland, Oregon, with the 156 running trails – the most out of any city – totaling 730 miles. Other cities with the best access include Colorado Springs and Phoenix.
New York City took second place overall, with the largest running community as well as the highest number of parks. Third up was San Diego, which hosts the most running event out of all the cities in the ranking. (These are the cities where the fewest people exercise.)
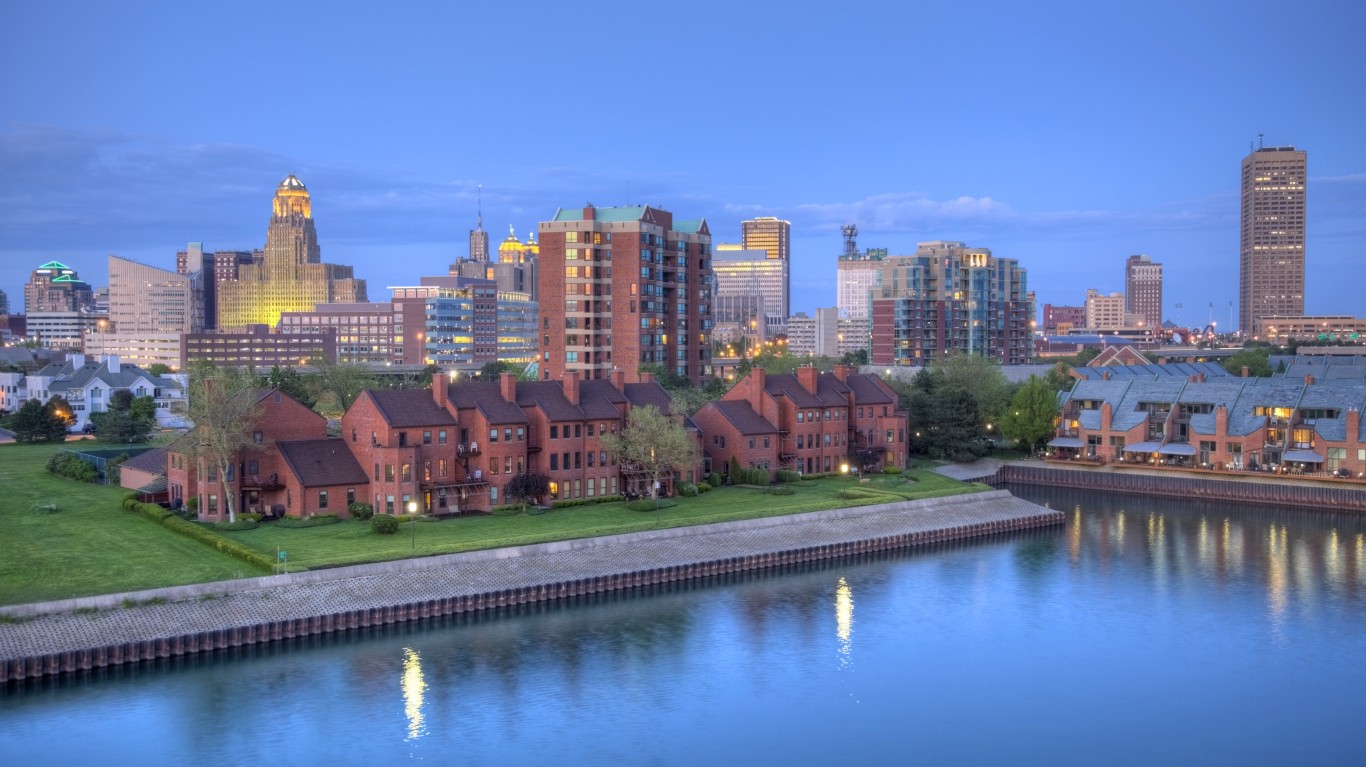
40. Buffalo, New York
> Running access rank: 24/200
> Running quality rank: 52/200
> Safety rank: 92/200
> Climate rank: 75/200
> Overall score: 40.52
[in-text-ad]
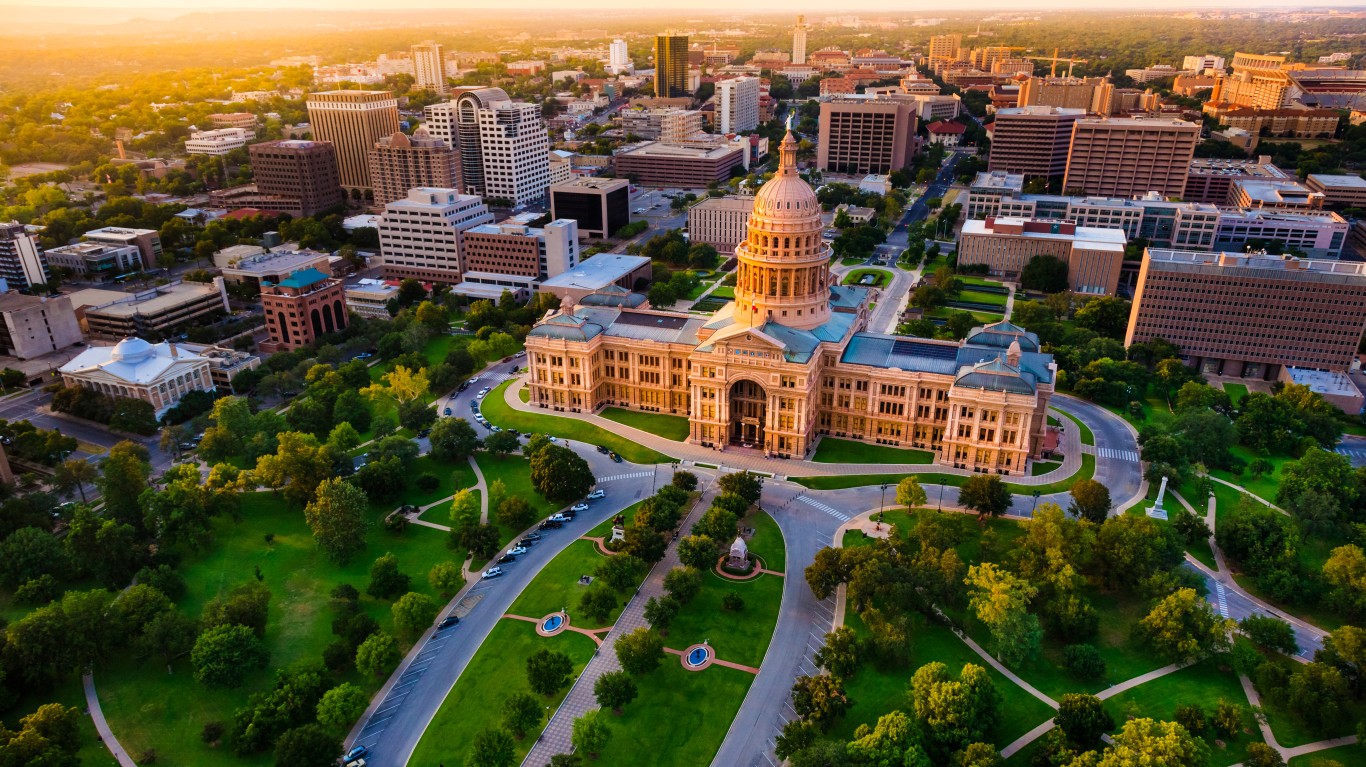
39. Austin, Texas
> Running access rank: 16/200
> Running quality rank: 64/200
> Safety rank: 160/200
> Climate rank: 111/200
> Overall score: 40.8
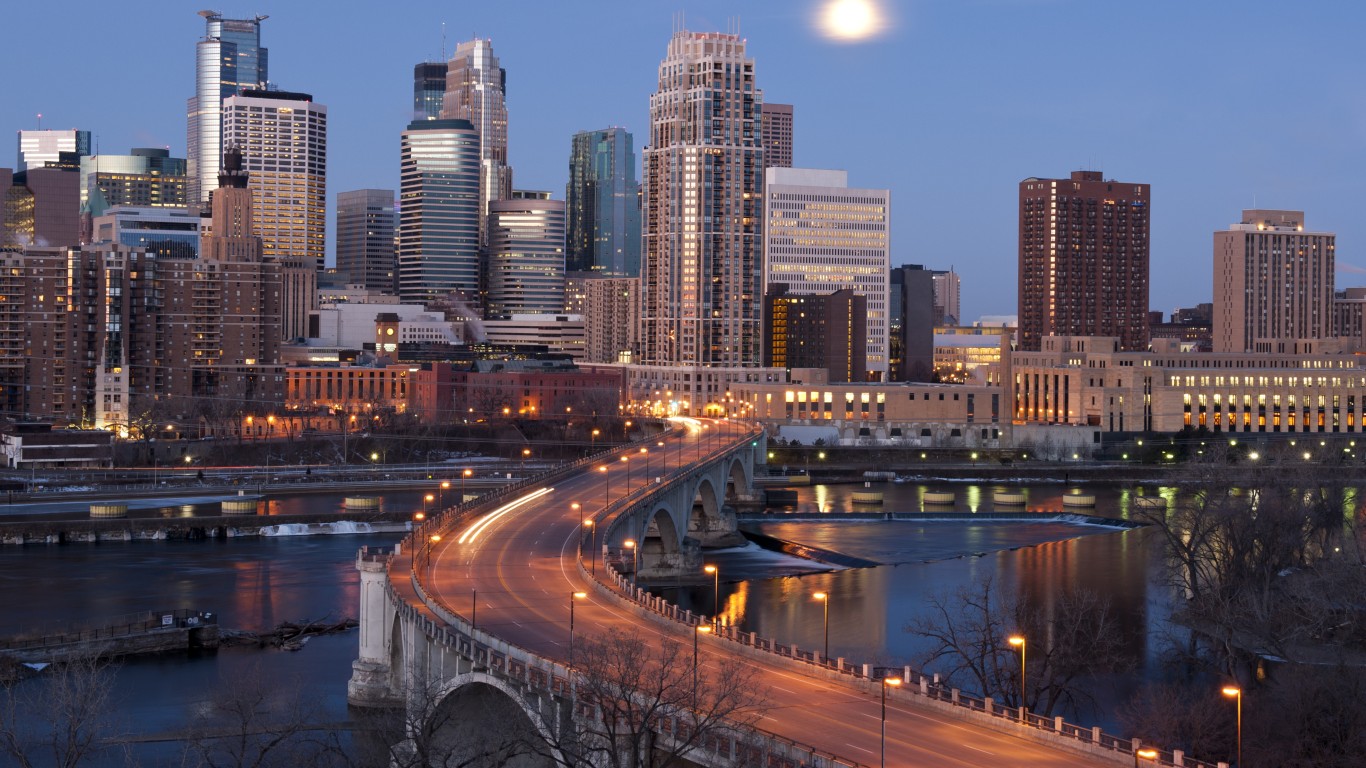
38. Minneapolis, Minnesota
> Running access rank: 26/200
> Running quality rank: 61/200
> Safety rank: 116/200
> Climate rank: 133/200
> Overall score: 40.95

37. Miami, Florida
> Running access rank: 38/200
> Running quality rank: 55/200
> Safety rank: 178/200
> Climate rank: 85/200
> Overall score: 41.1
[in-text-ad-2]
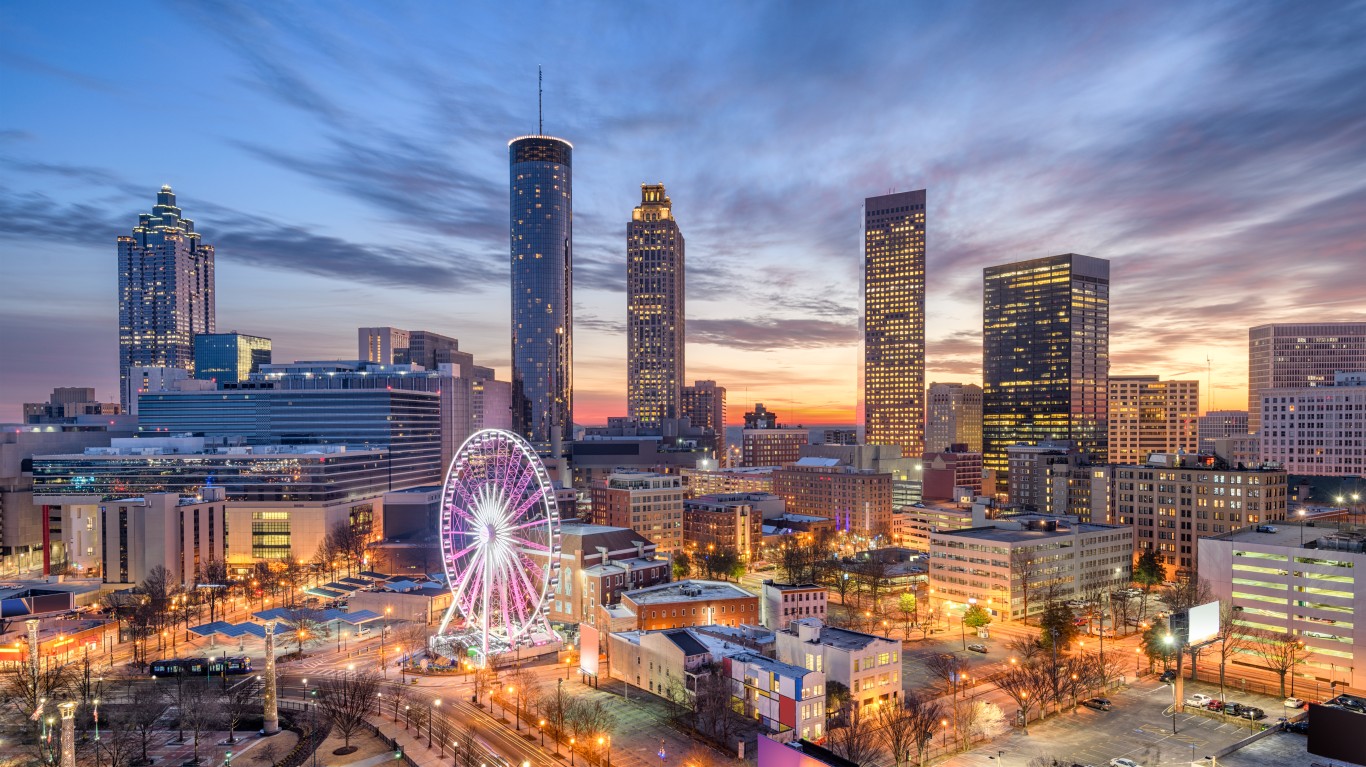
36. Atlanta, Georgia
> Running access rank: 33/200
> Running quality rank: 53/200
> Safety rank: 187/200
> Climate rank: 81/200
> Overall score: 41.33
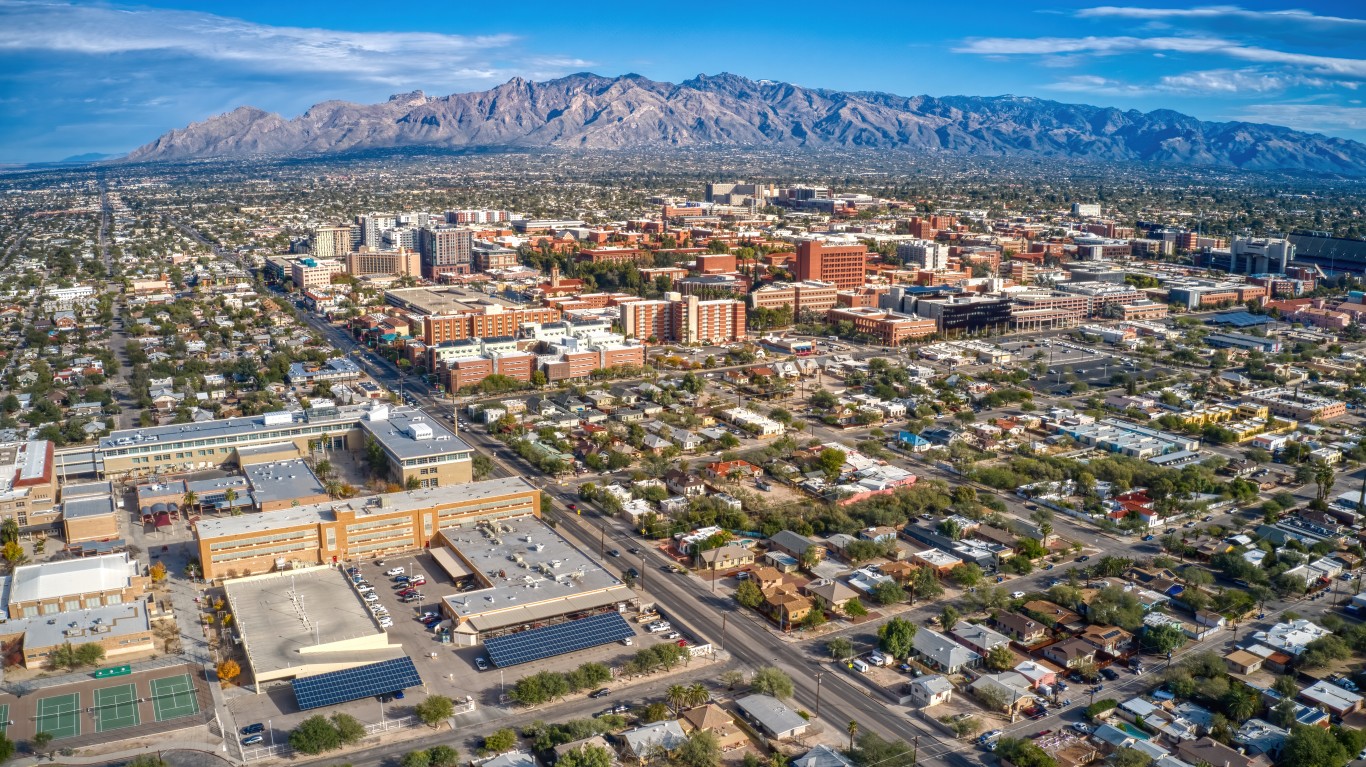
35. Tucson, Arizona
> Running access rank: 11/200
> Running quality rank: 30/200
> Safety rank: 192/200
> Climate rank: 116/200
> Overall score: 41.34
[in-text-ad]
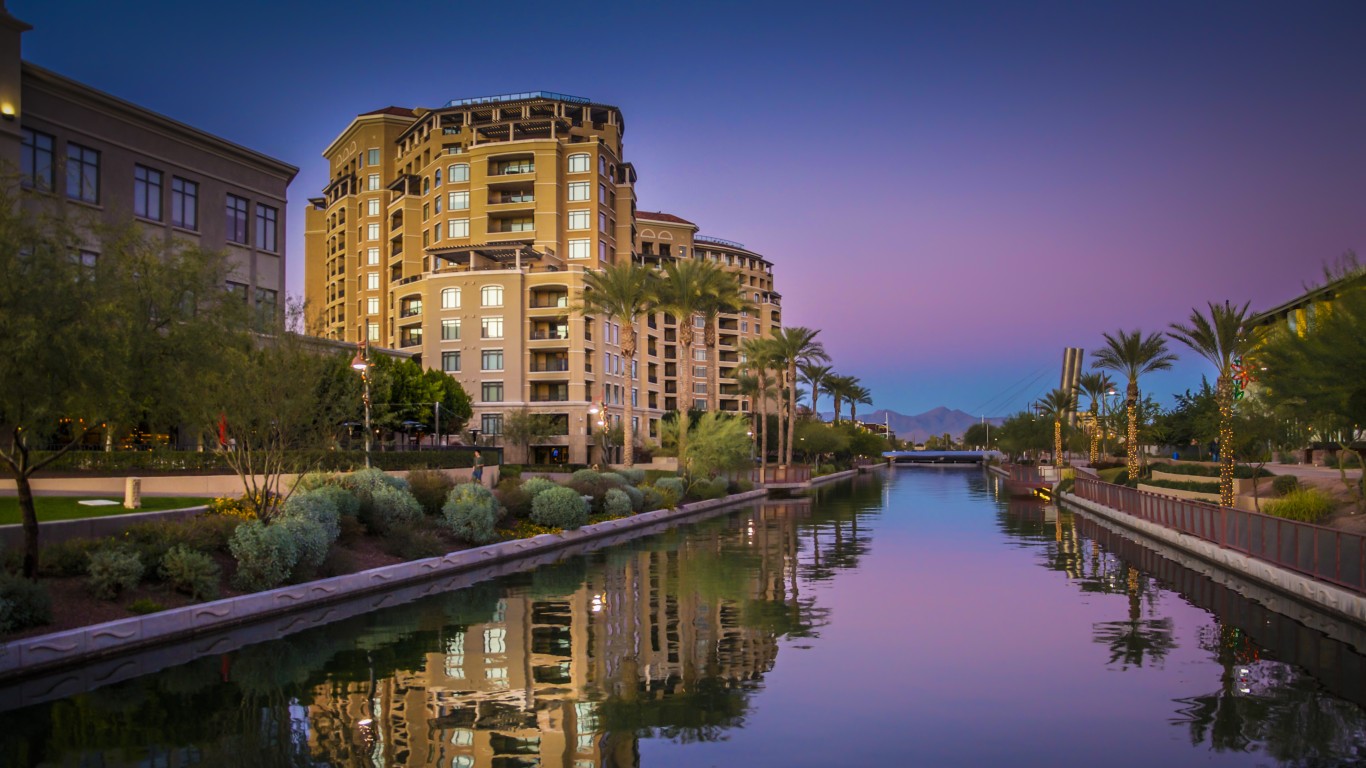
34. Scottsdale, Arizona
> Running access rank: 28/200
> Running quality rank: 21/200
> Safety rank: 63/200
> Climate rank: 193/200
> Overall score: 41.47

33. Honolulu, Hawaii
> Running access rank: 44/200
> Running quality rank: 45/200
> Safety rank: 189/200
> Climate rank: 2/200
> Overall score: 41.61
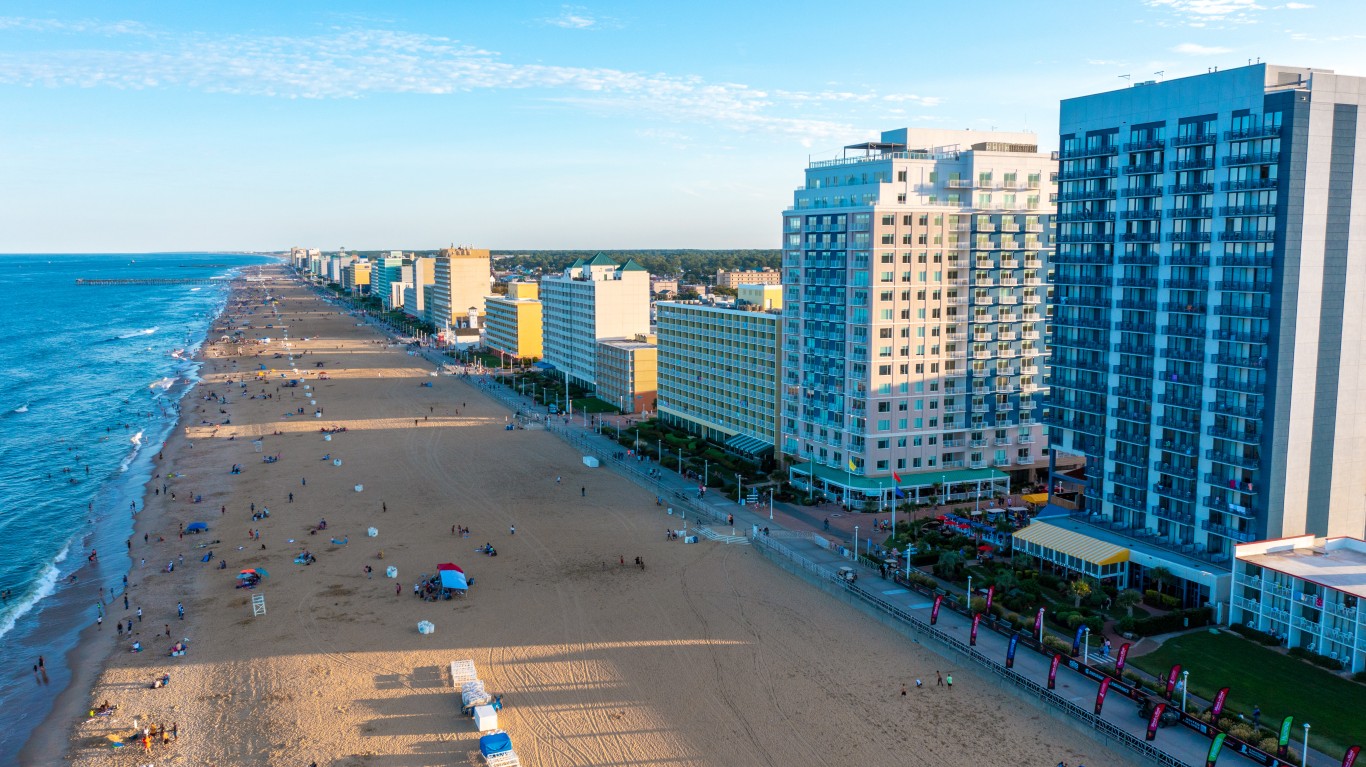
32. Virginia Beach, Virginia
> Running access rank: 62/200
> Running quality rank: 31/200
> Safety rank: 16/200
> Climate rank: 41/200
> Overall score: 42.05
[in-text-ad-2]
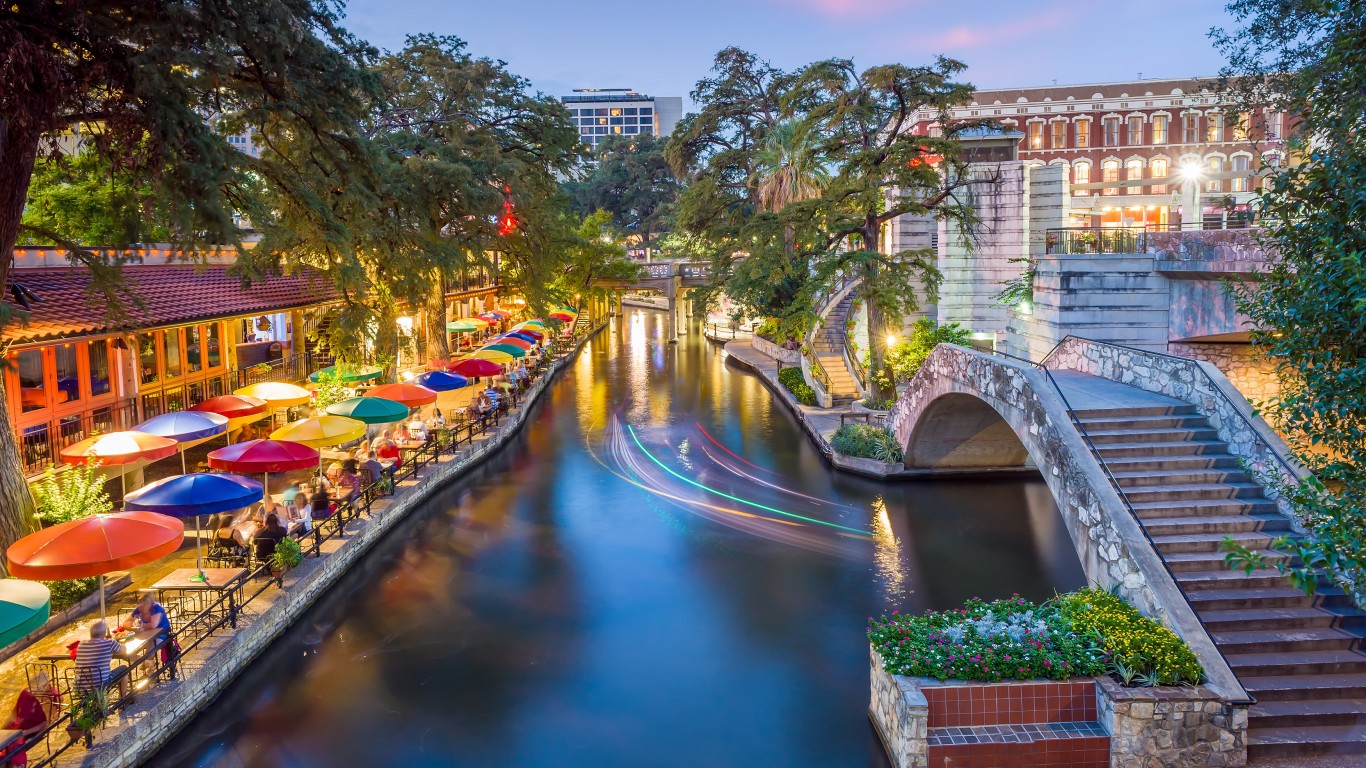
32. San Antonio, Texas
> Running access rank: 14/200
> Running quality rank: 46/200
> Safety rank: 169/200
> Climate rank: 138/200
> Overall score: 42.14
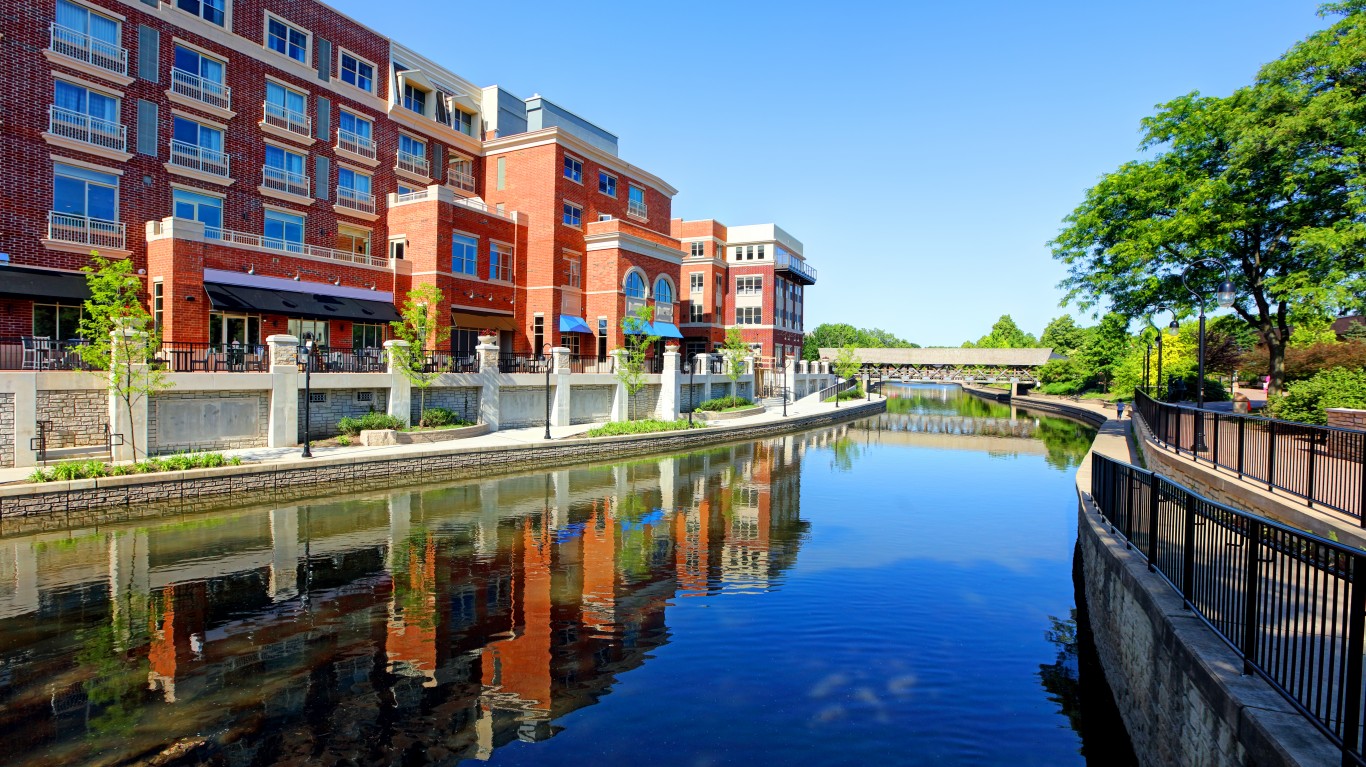
30. Naperville, Illinois
> Running access rank: 81/200
> Running quality rank: 66/200
> Safety rank: 1/200
> Climate rank: 152/200
> Overall score: 42.28
[in-text-ad]
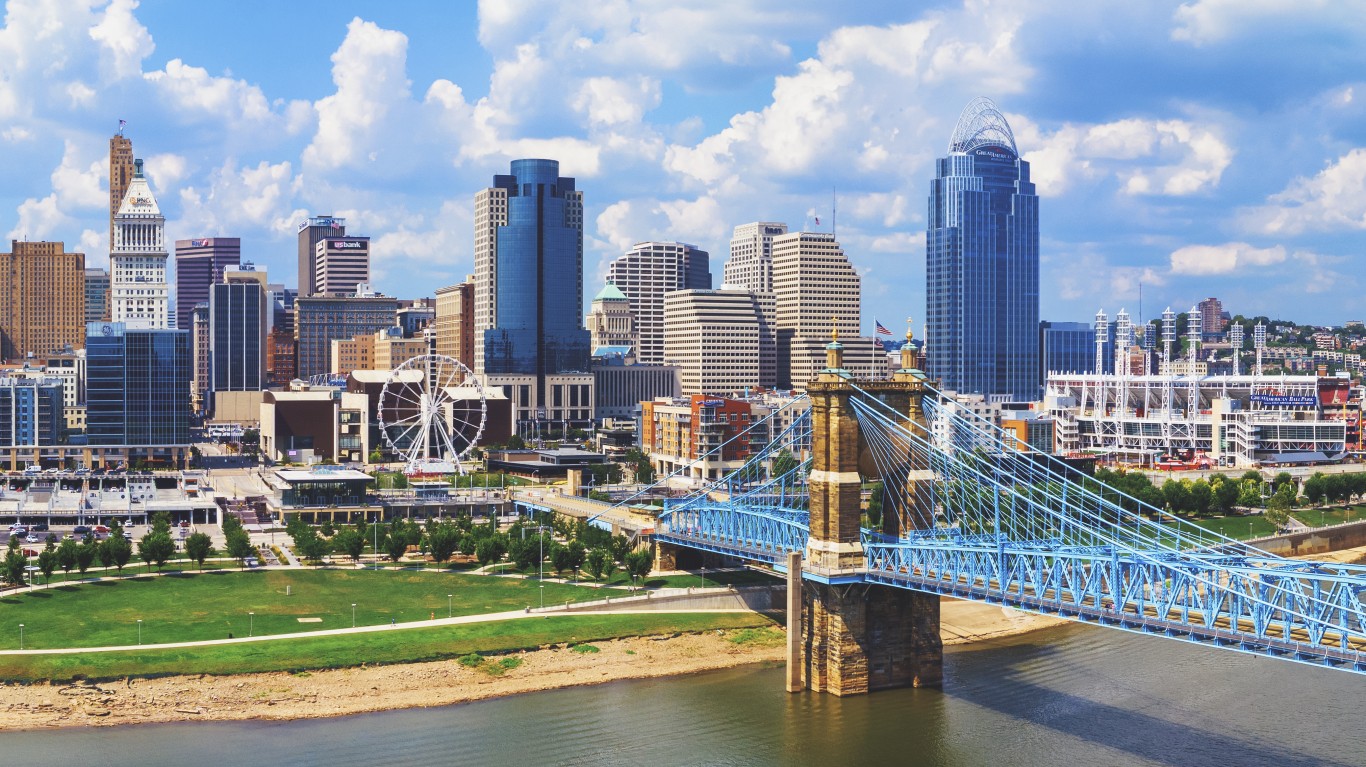
29. Cincinnati, Ohio
> Running access rank: 10/200
> Running quality rank: 122/200
> Safety rank: 111/200
> Climate rank: 143/200
> Overall score: 42.54

28. Pasadena, California
> Running access rank: 94/200
> Running quality rank: 3/200
> Safety rank: 185/200
> Climate rank: 23/200
> Overall score: 42.56
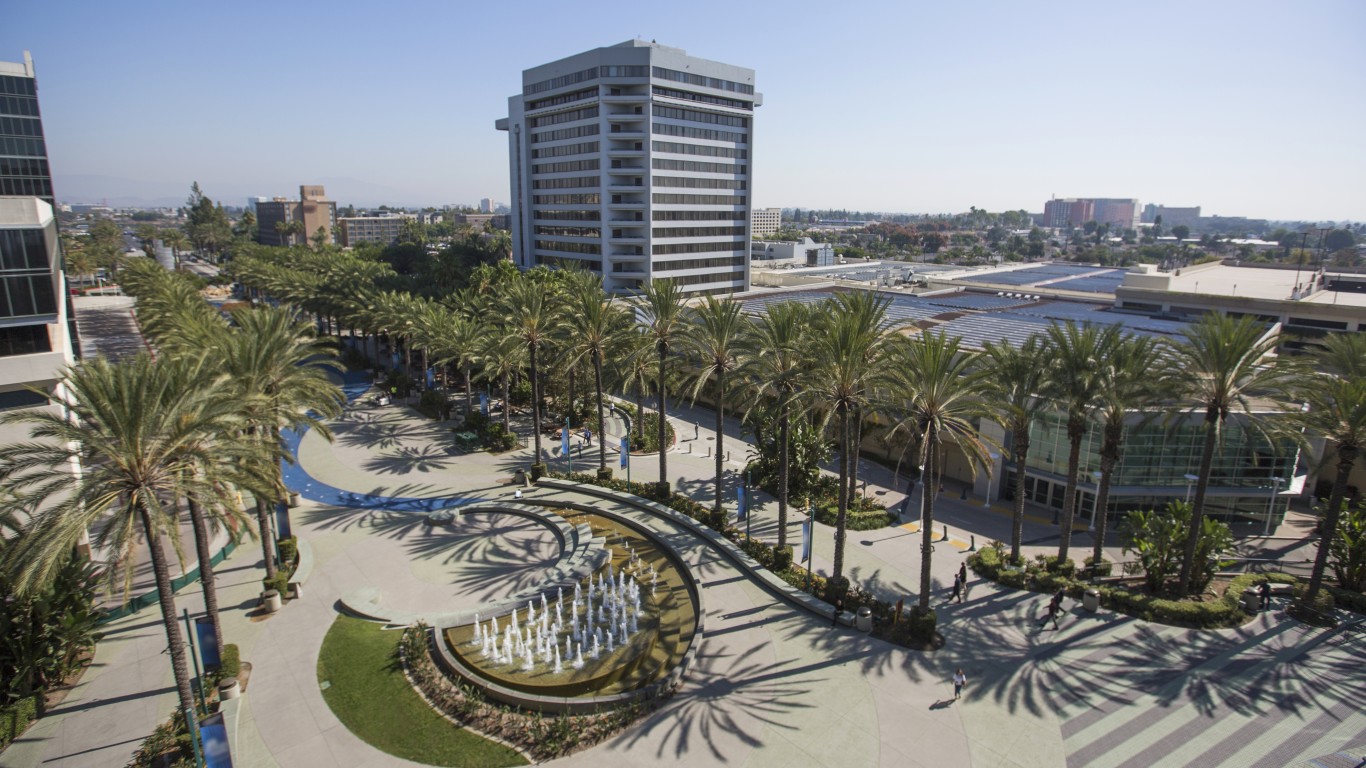
27. Anaheim, California
> Running access rank: 118/200
> Running quality rank: 4/200
> Safety rank: 98/200
> Climate rank: 23/200
> Overall score: 42.76
[in-text-ad-2]
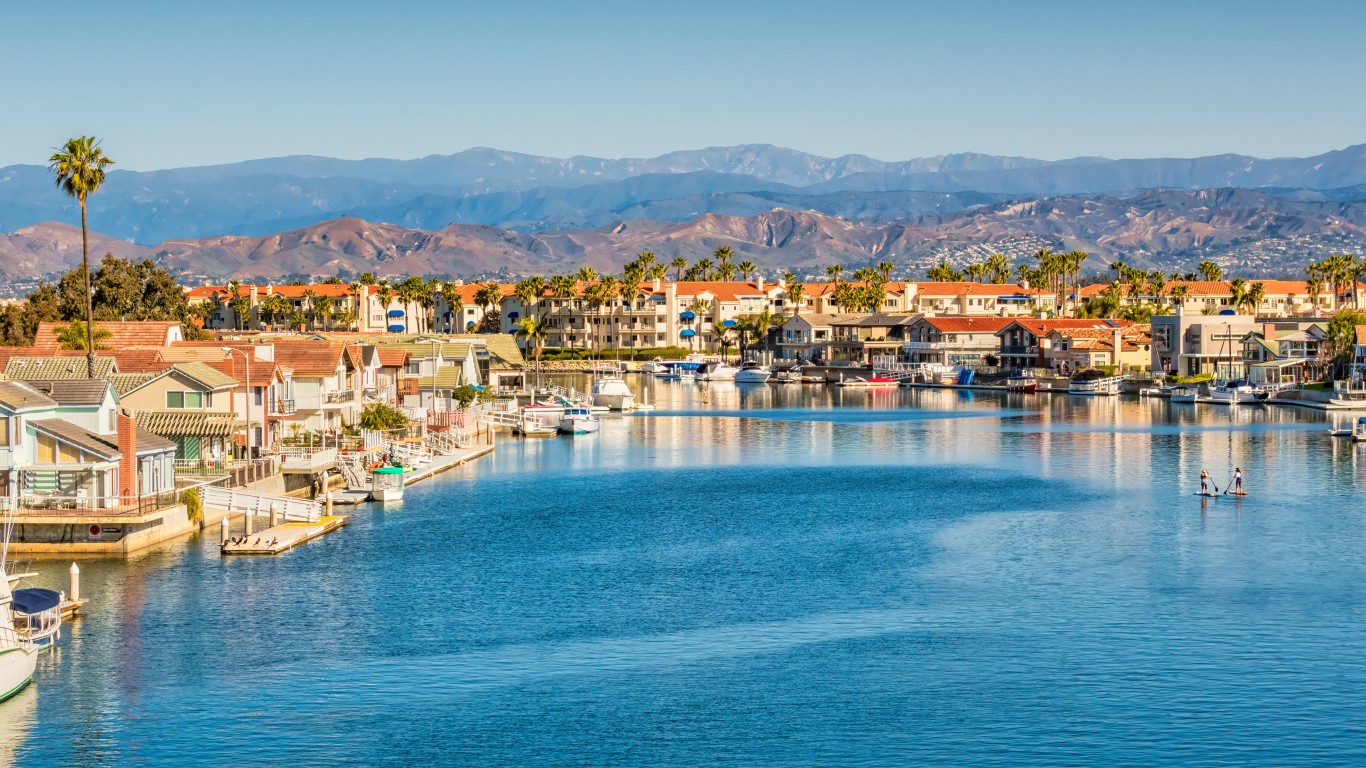
26. Oxnard, California
> Running access rank: 136/200
> Running quality rank: 8/200
> Safety rank: 30/200
> Climate rank: 14/200
> Overall score: 43.23
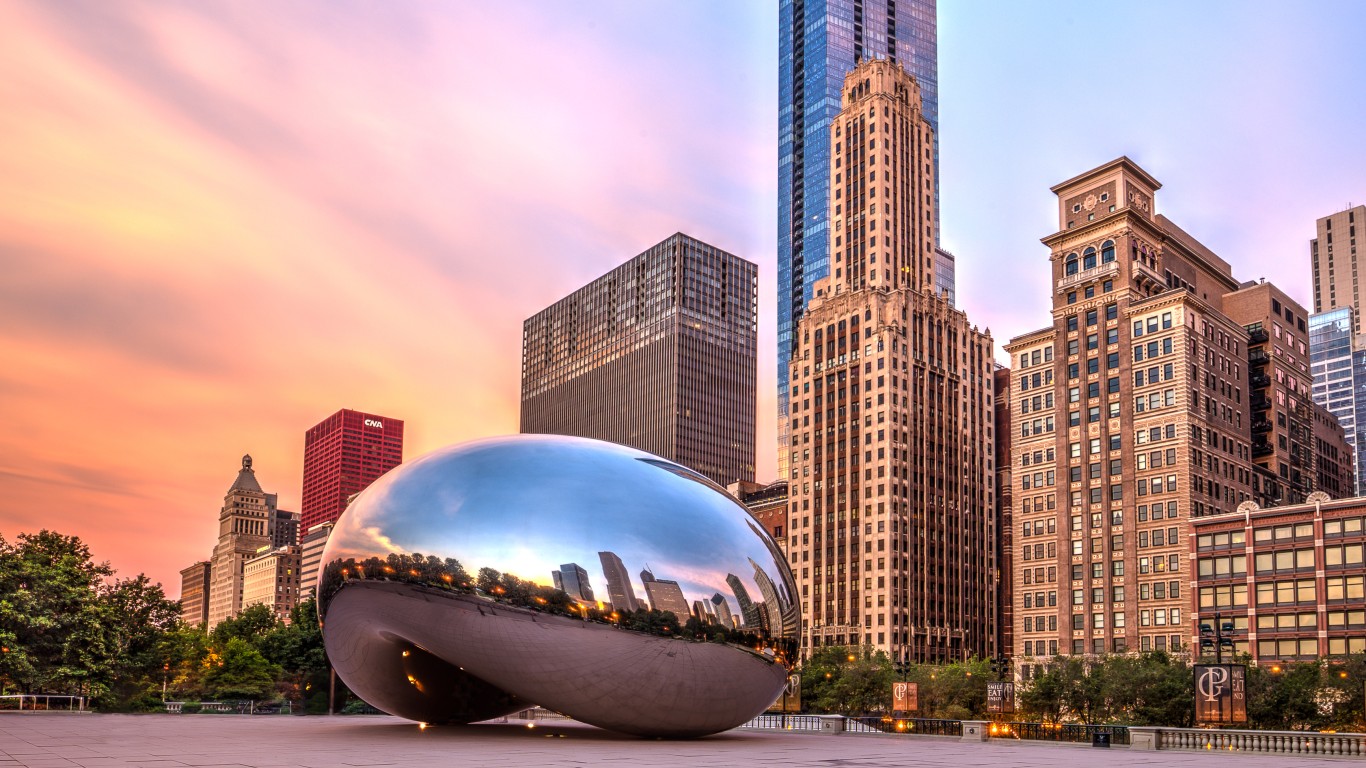
25. Chicago, Illinois
> Running access rank: 9/200
> Running quality rank: 120/200
> Safety rank: 96/200
> Climate rank: 152/200
> Overall score: 43.31
[in-text-ad]
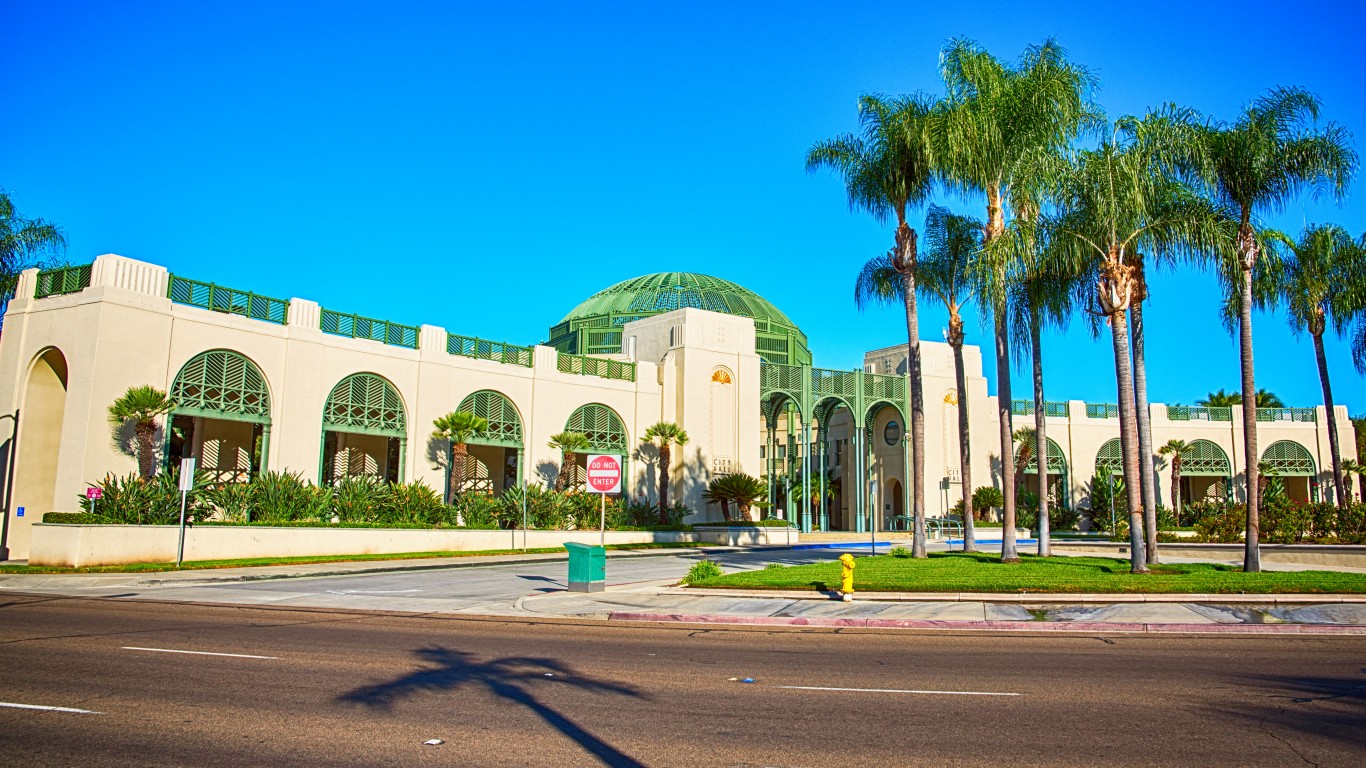
24. Escondido, California
> Running access rank: 37/200
> Running quality rank: 24/200
> Safety rank: 101/200
> Climate rank: 4/200
> Overall score: 43.56
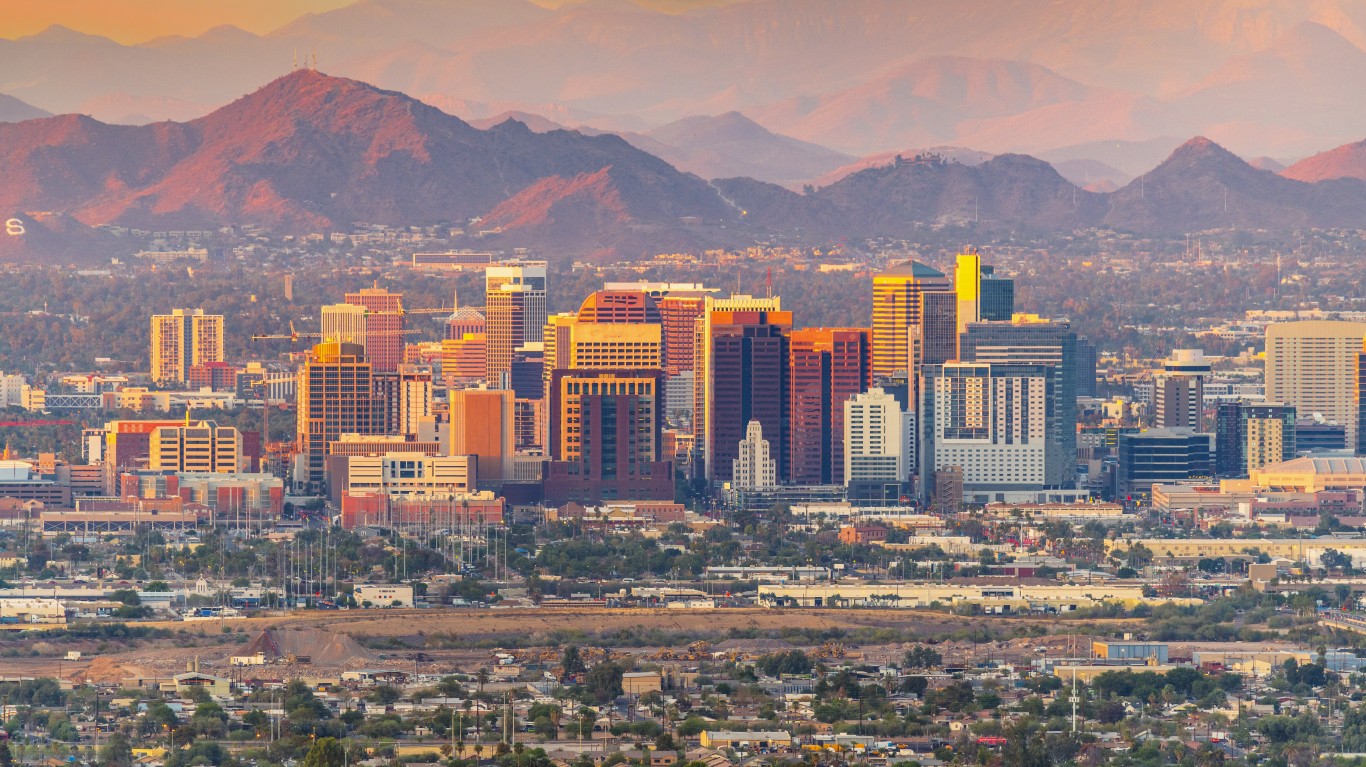
23. Phoenix, Arizona
> Running access rank: 4/200
> Running quality rank: 10/200
> Safety rank: 184/200
> Climate rank: 193/200
> Overall score: 43.7
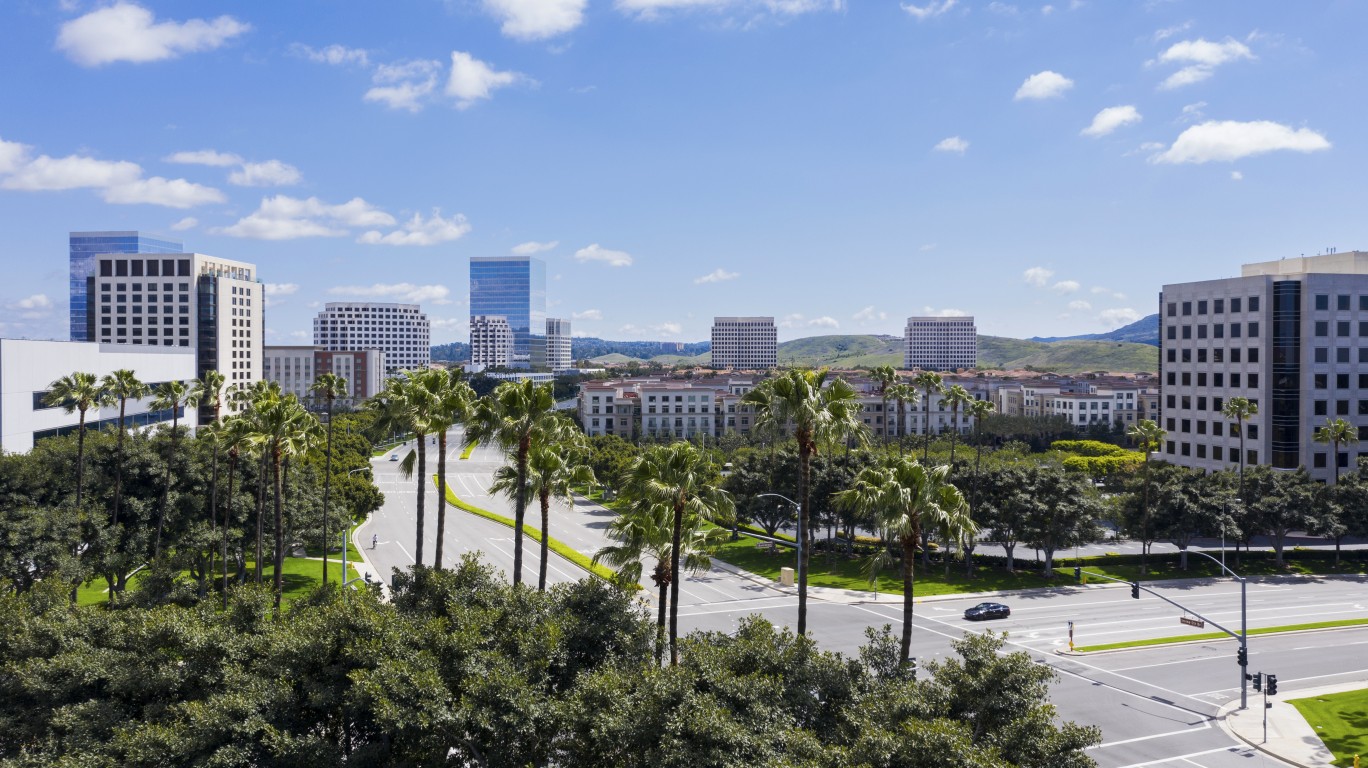
22. Irvine, California
> Running access rank: 31/200
> Running quality rank: 41/200
> Safety rank: 10/200
> Climate rank: 23/200
> Overall score: 43.74
[in-text-ad-2]
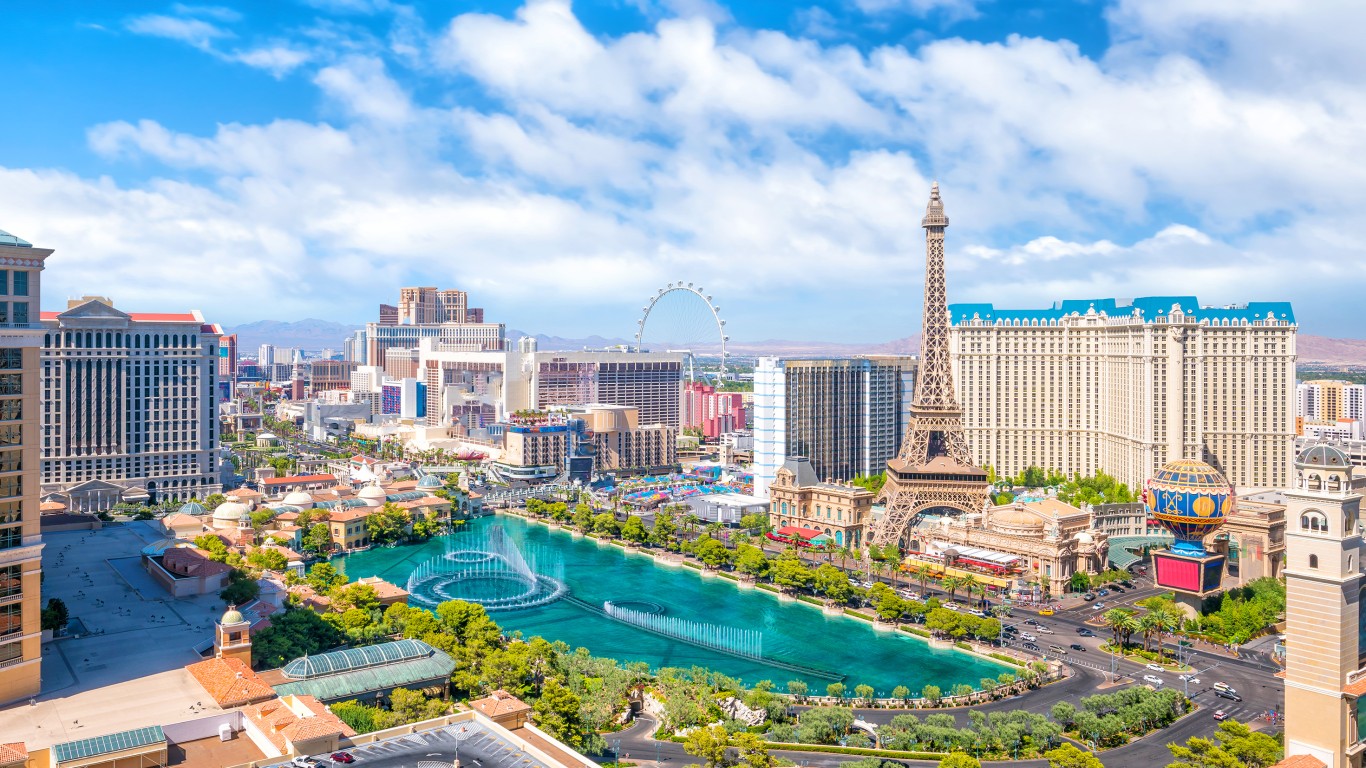
21. Las Vegas, Nevada
> Running access rank: 12/200
> Running quality rank: 40/200
> Safety rank: 82/200
> Climate rank: 176/200
> Overall score: 44.41
20. Salinas, California
> Running access rank: 84/200
> Running quality rank: 7/200
> Safety rank: 61/200
> Climate rank: 3/200
> Overall score: 44.42
[in-text-ad]

19. Philadelphia, Pennsylvania
> Running access rank: 32/200
> Running quality rank: 9/200
> Safety rank: 108/200
> Climate rank: 97/200
> Overall score: 44.6
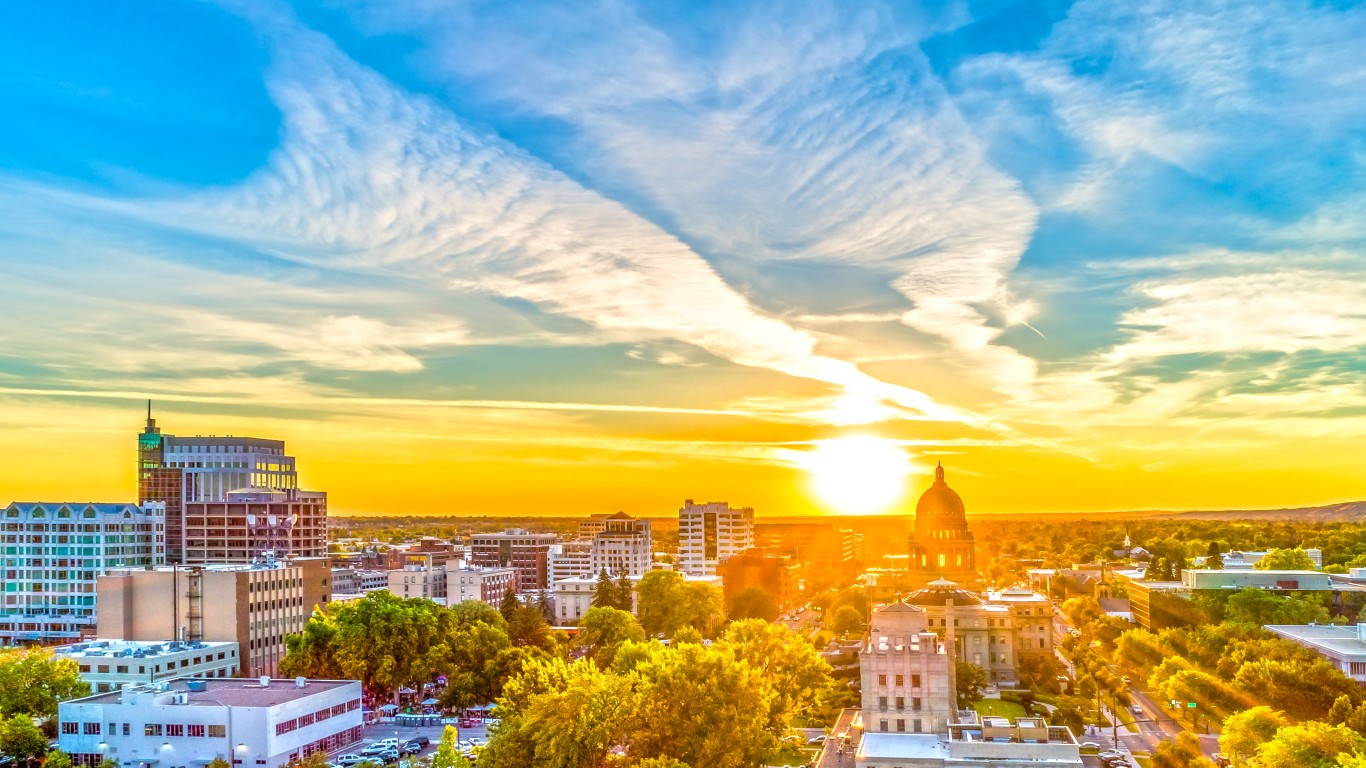
18. Boise, Idaho
> Running access rank: 20/200
> Running quality rank: 33/200
> Safety rank: 14/200
> Climate rank: 66/200
> Overall score: 45.18
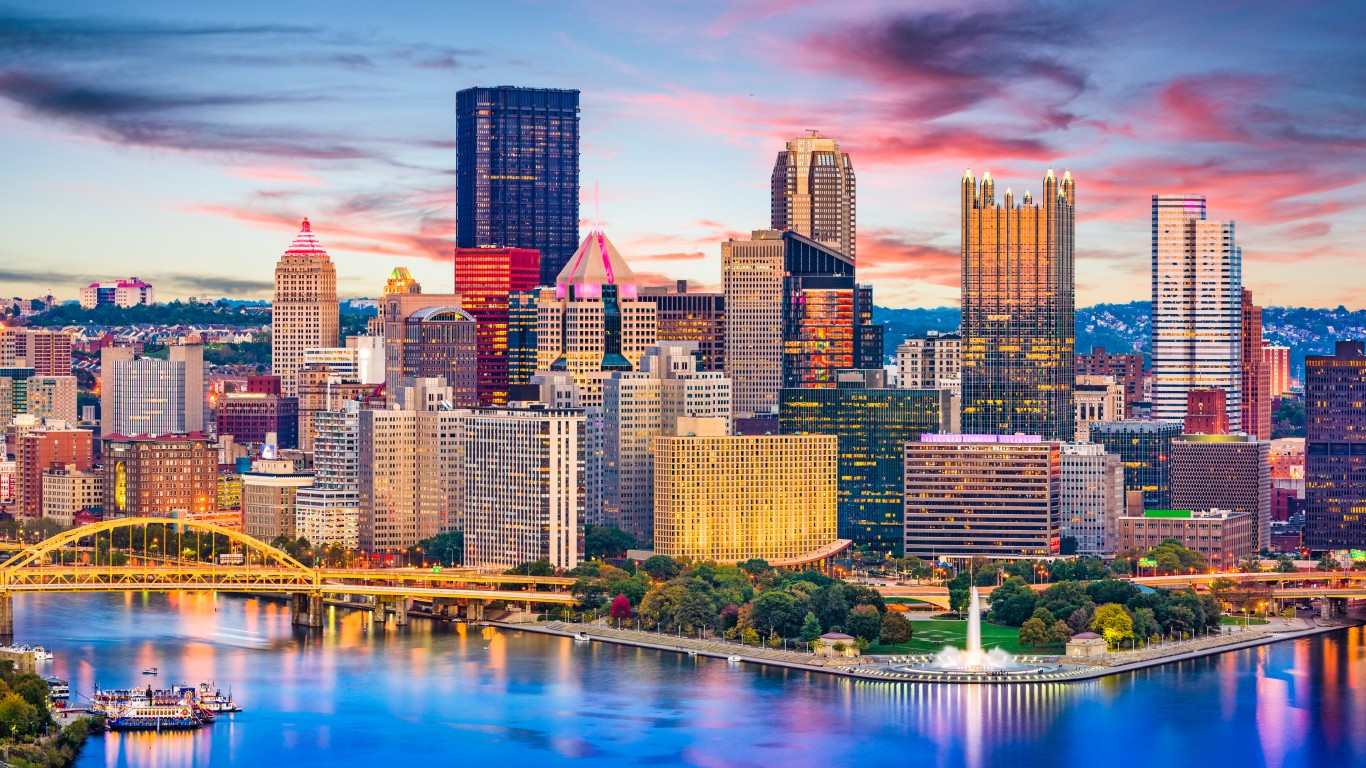
17. Pittsburgh, Pennsylvania
> Running access rank: 19/200
> Running quality rank: 74/200
> Safety rank: 73/200
> Climate rank: 92/200
> Overall score: 45.3
[in-text-ad-2]
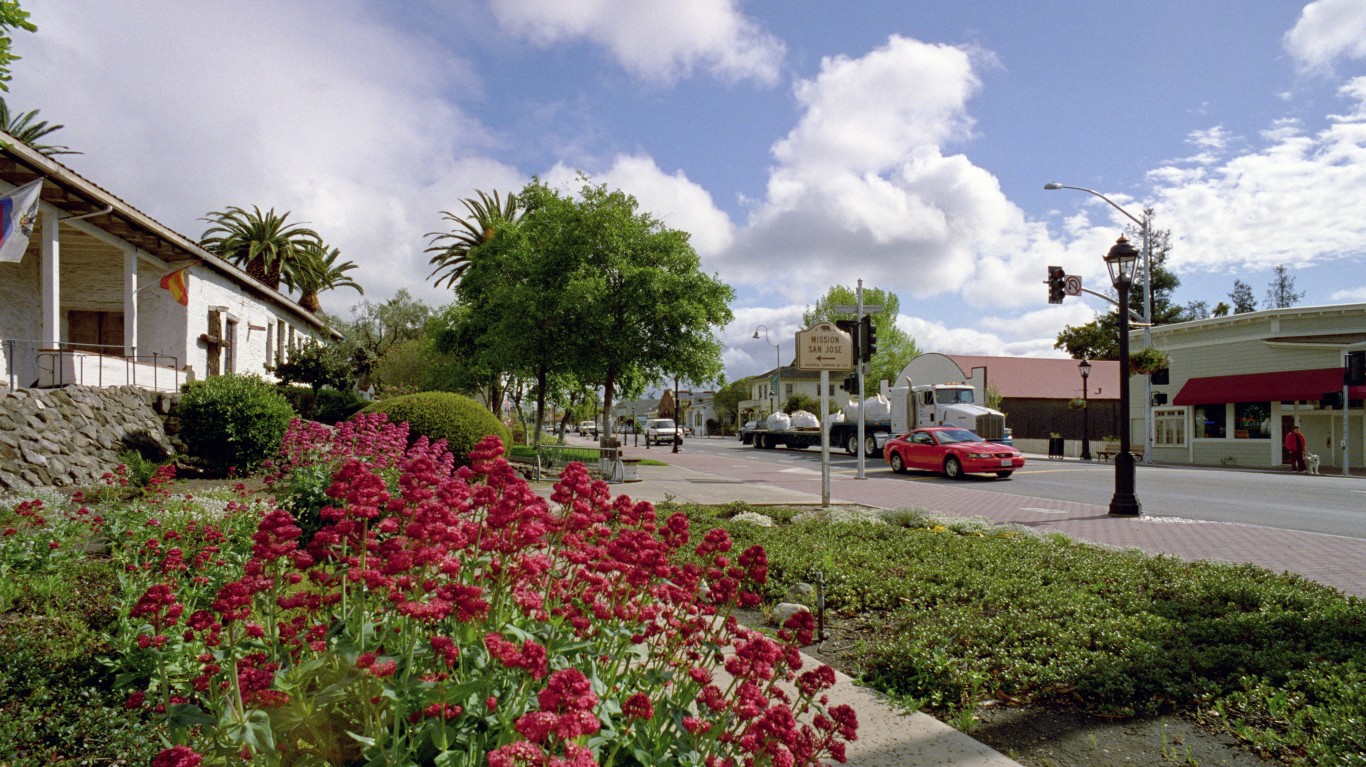
16. Fremont, California
> Running access rank: 47/200
> Running quality rank: 13/200
> Safety rank: 72/200
> Climate rank: 8/200
> Overall score: 45.48
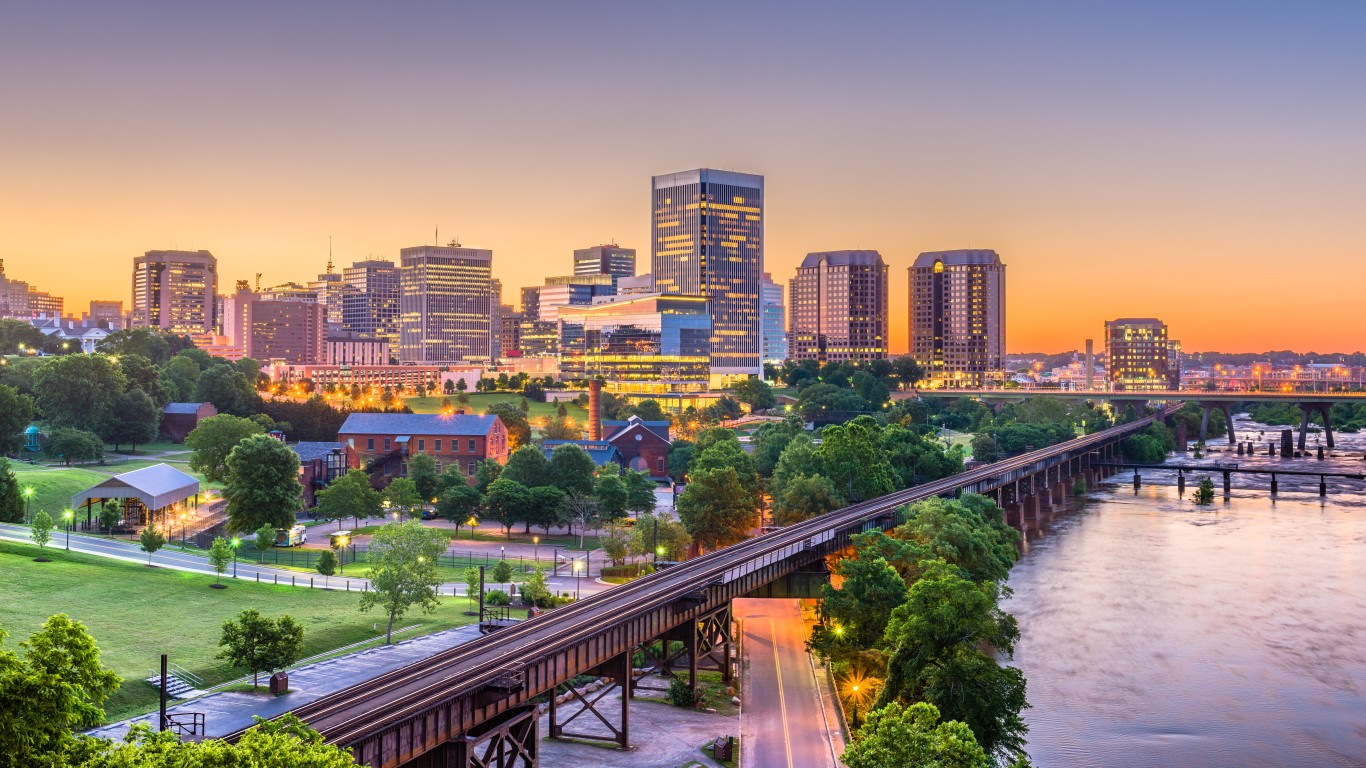
15. Richmond, Virginia
> Running access rank: 17/200
> Running quality rank: 29/200
> Safety rank: 79/200
> Climate rank: 77/200
> Overall score: 45.62
[in-text-ad]
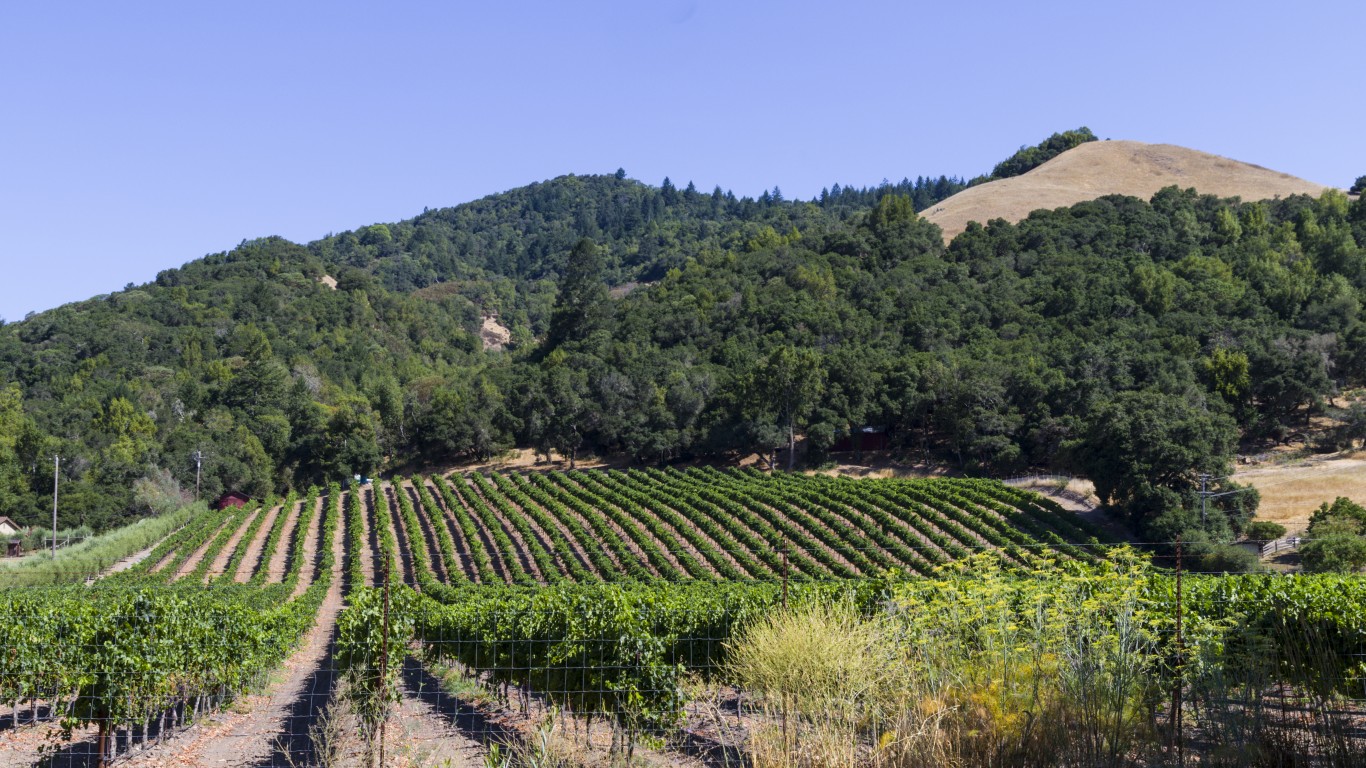
14. Santa Rosa, California
> Running access rank: 55/200
> Running quality rank: 26/200
> Safety rank: 20/200
> Climate rank: 1/200
> Overall score: 45.66
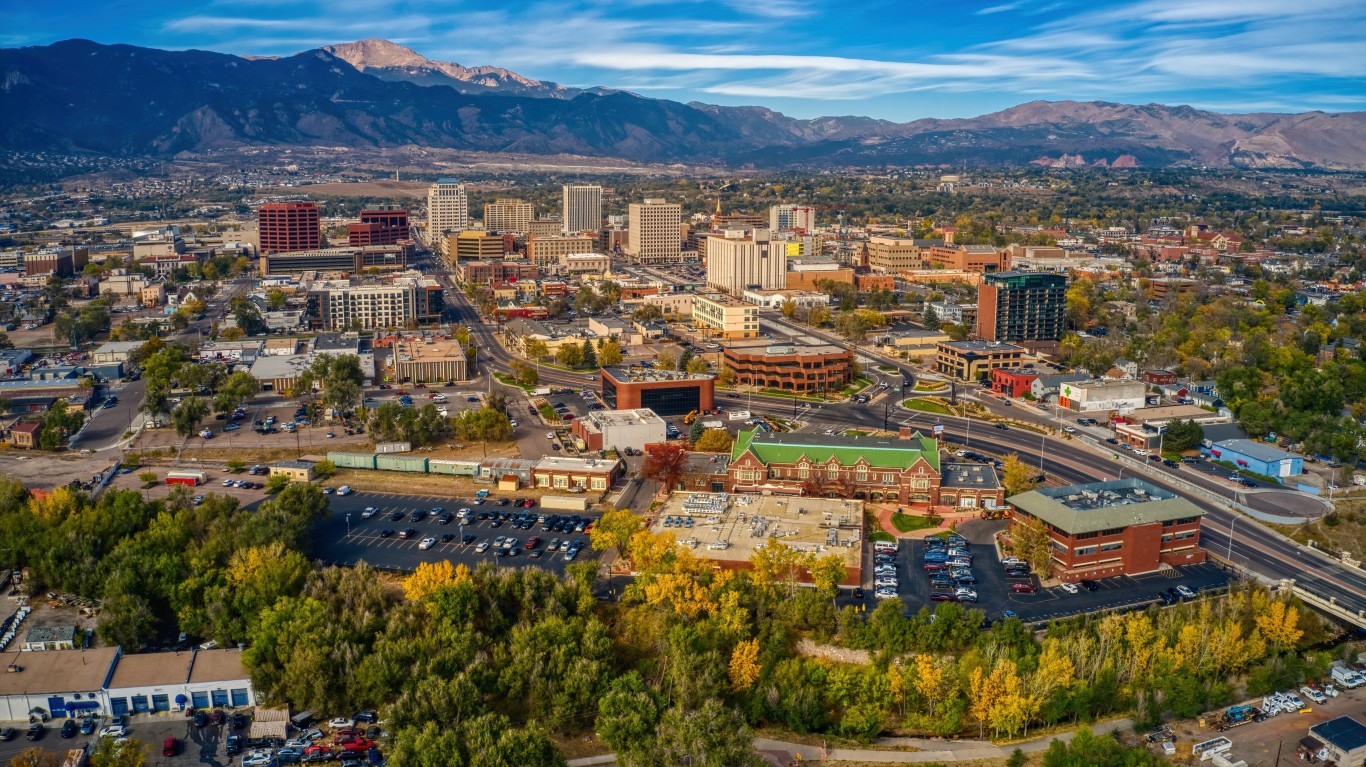
13. Colorado Springs, Colorado
> Running access rank: 2/200
> Running quality rank: 44/200
> Safety rank: 107/200
> Climate rank: 121/200
> Overall score: 46.23
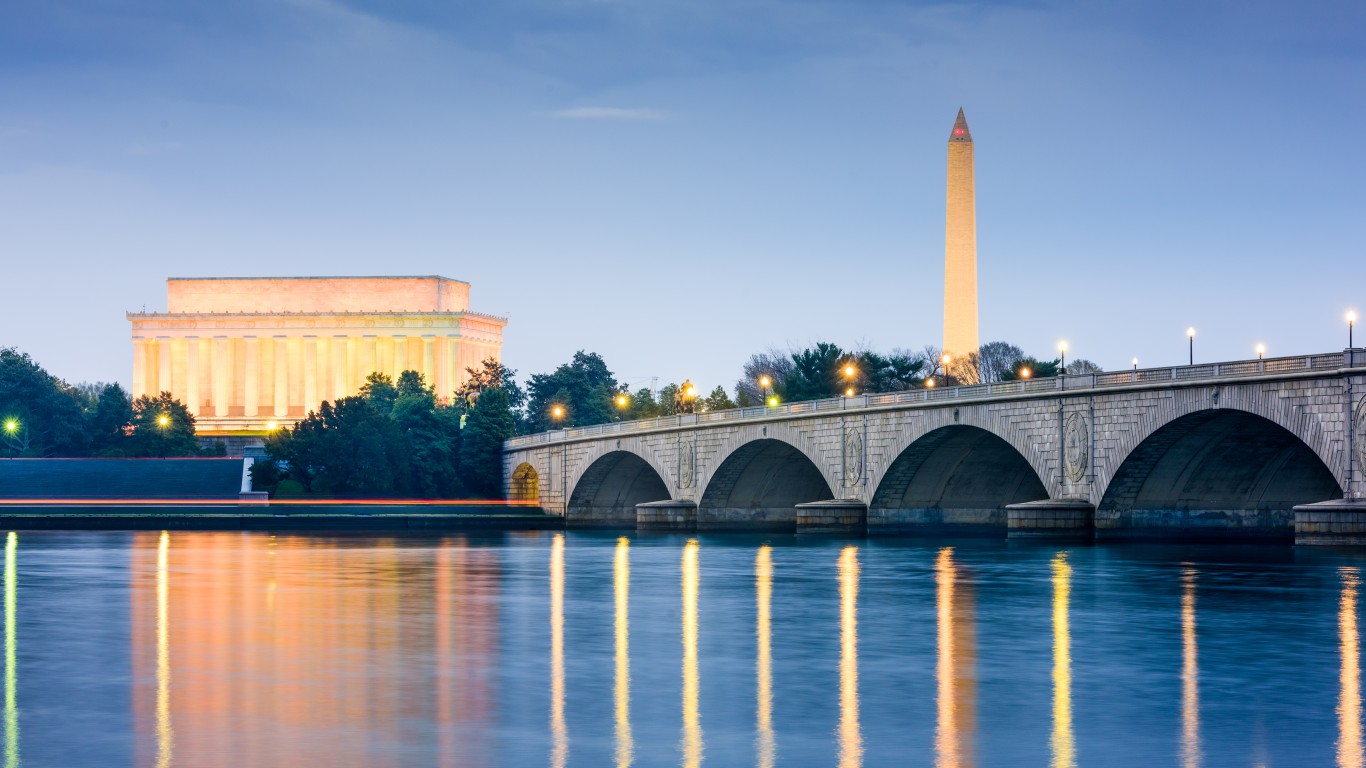
12. Washington, D.C.
> Running access rank: 22/200
> Running quality rank: 34/200
> Safety rank: 123/200
> Climate rank: 62/200
> Overall score: 46.67
[in-text-ad-2]
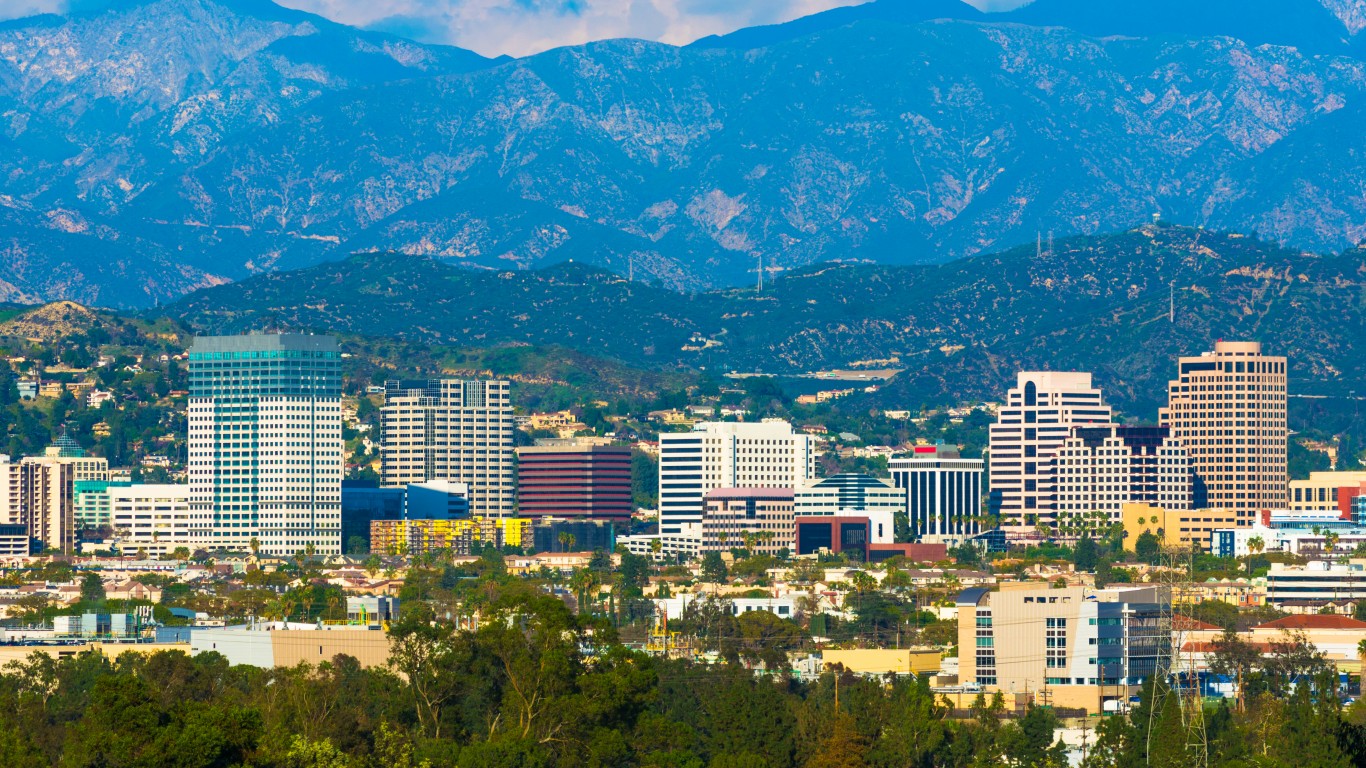
11. Glendale, California
> Running access rank: 70/200
> Running quality rank: 2/200
> Safety rank: 35/200
> Climate rank: 23/200
> Overall score: 46.78
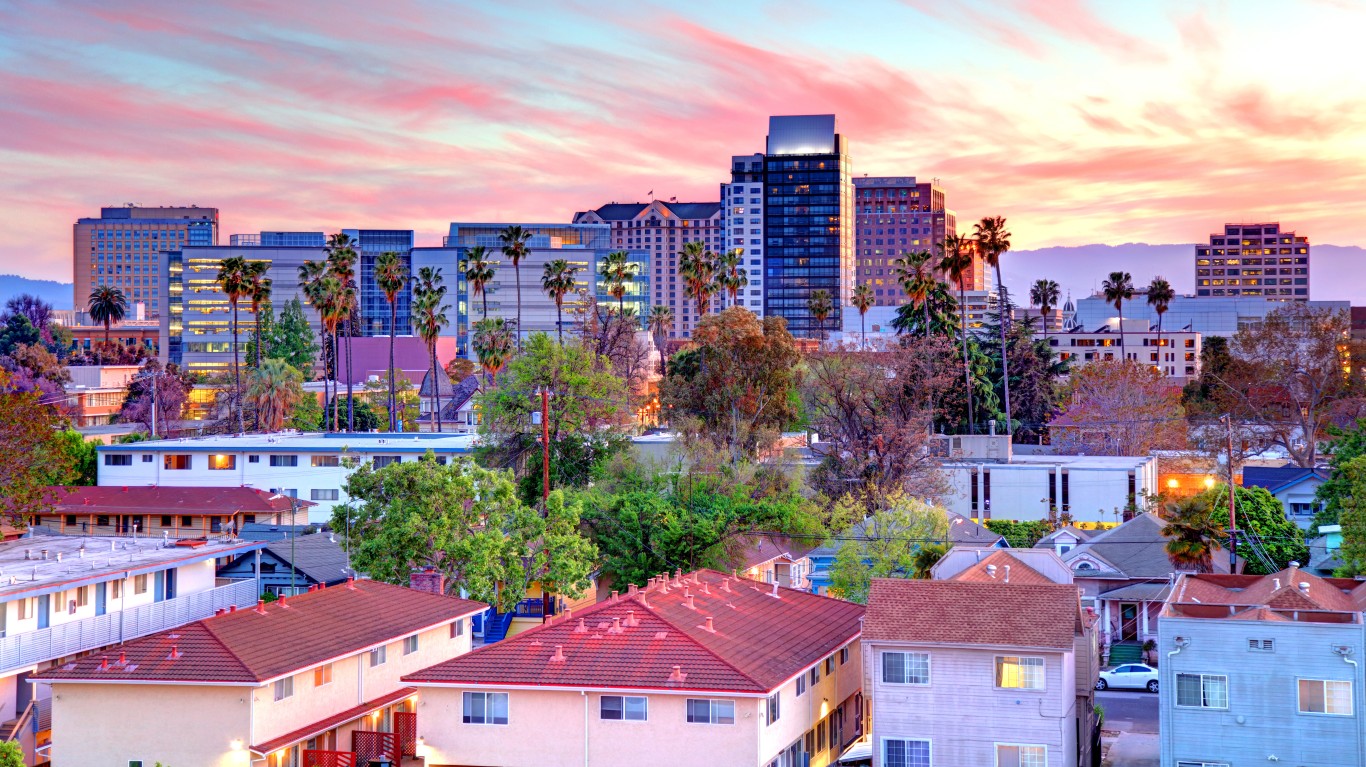
10. San Jose, California
> Running access rank: 23/200
> Running quality rank: 14/200
> Safety rank: 103/200
> Climate rank: 8/200
> Overall score: 47.07
[in-text-ad]
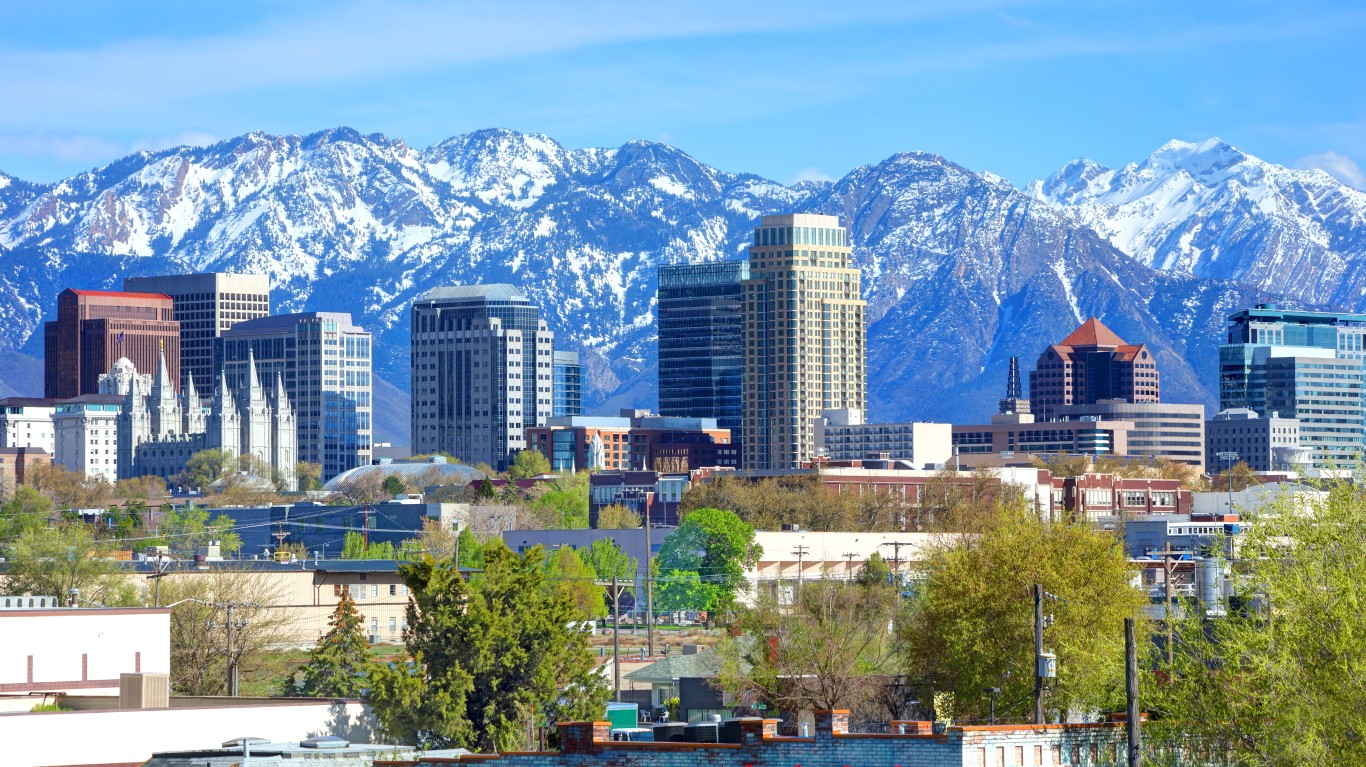
9. Salt Lake City, Utah
> Running access rank: 8/200
> Running quality rank: 19/200
> Safety rank: 176/200
> Climate rank: 150/200
> Overall score: 47.16
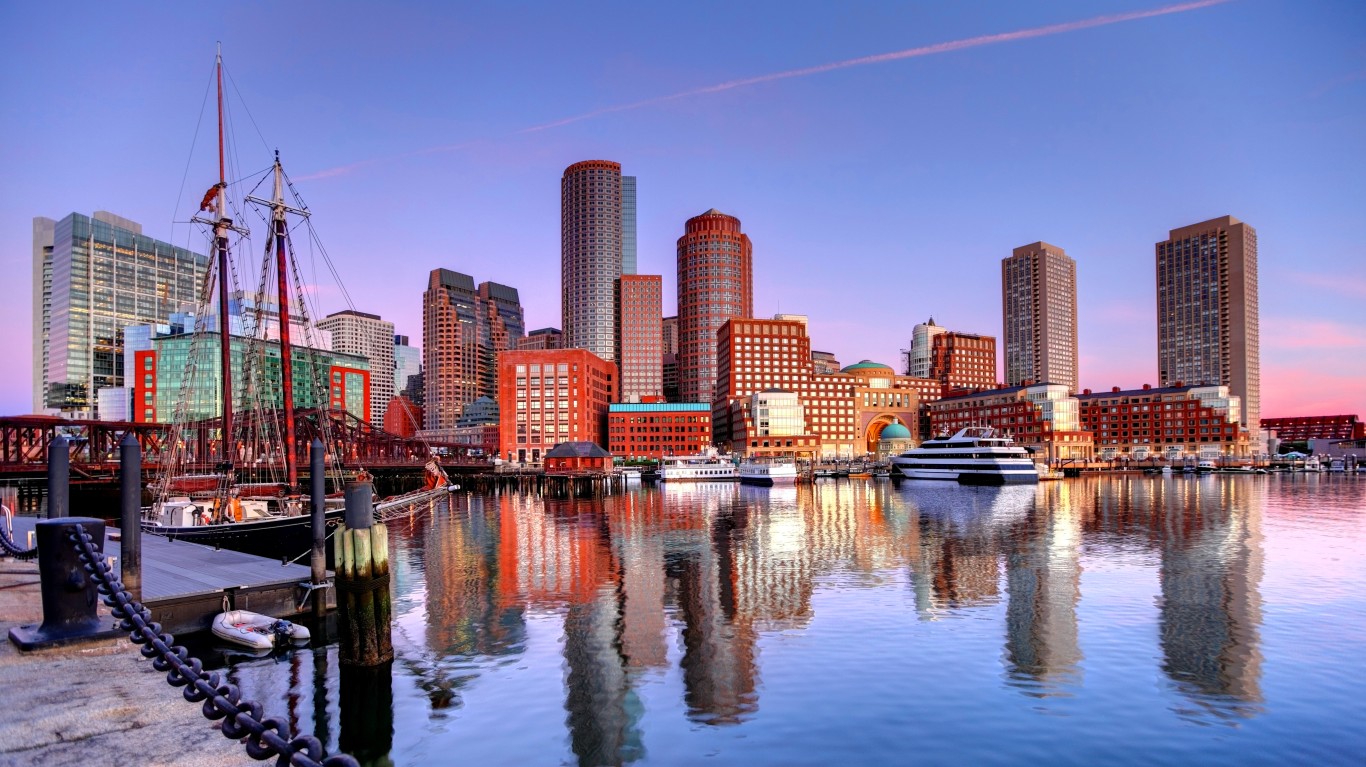
8. Boston, Massachusetts
> Running access rank: 30/200
> Running quality rank: 12/200
> Safety rank: 49/200
> Climate rank: 69/200
> Overall score: 47.69
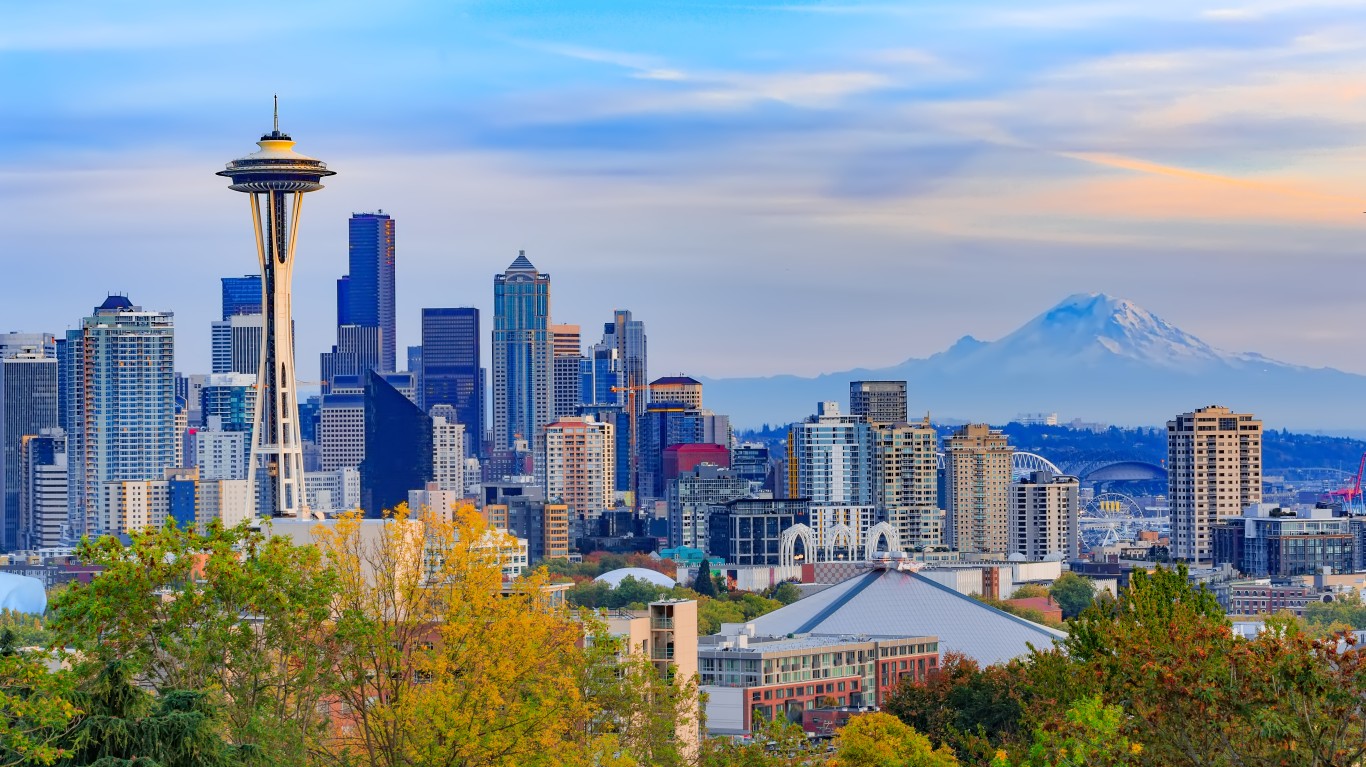
7. Seattle, Washington
> Running access rank: 21/200
> Running quality rank: 16/200
> Safety rank: 133/200
> Climate rank: 18/200
> Overall score: 48.88
[in-text-ad-2]

6. Los Angeles, California
> Running access rank: 18/200
> Running quality rank: 6/200
> Safety rank: 126/200
> Climate rank: 37/200
> Overall score: 49.34
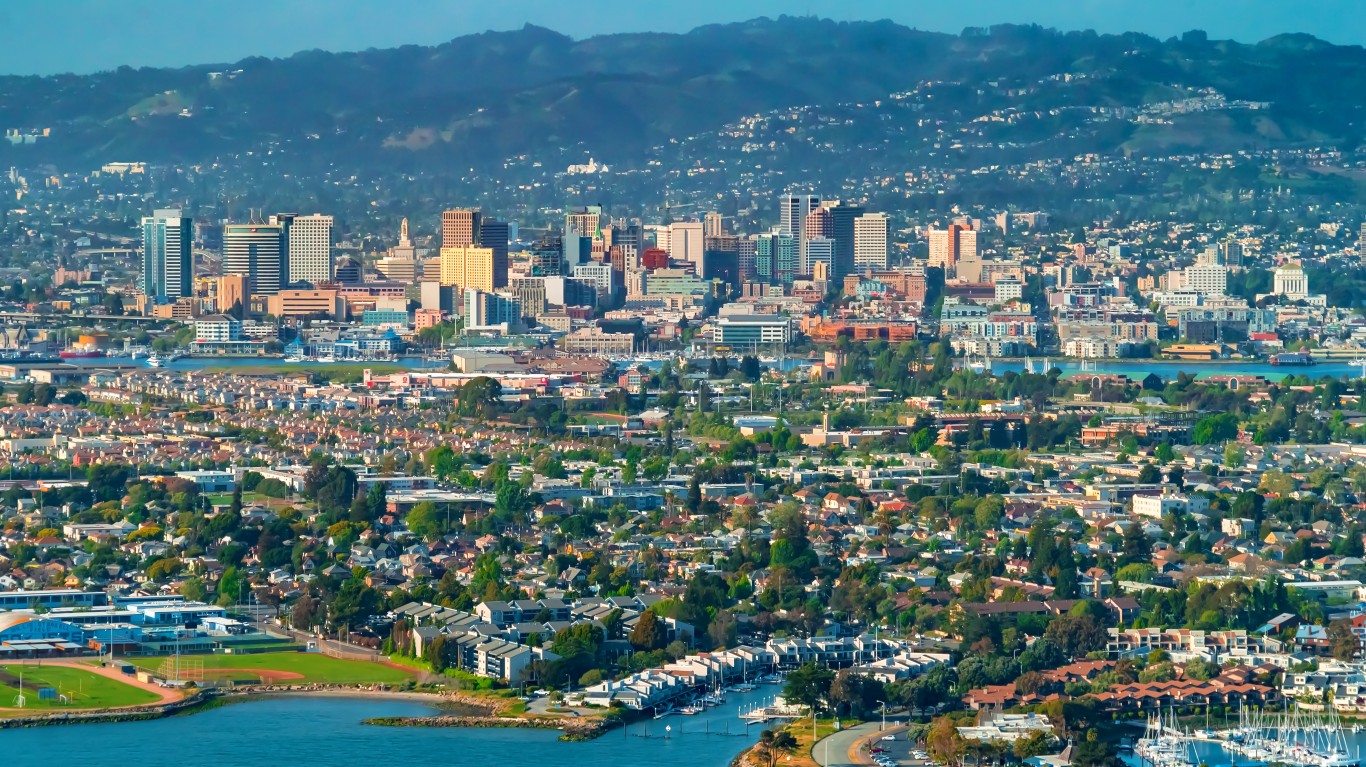
5. Oakland, California
> Running access rank: 7/200
> Running quality rank: 5/200
> Safety rank: 83/200
> Climate rank: 8/200
> Overall score: 53.47
[in-text-ad]

4. Portland, Oregon
> Running access rank: 1/200
> Running quality rank: 11/200
> Safety rank: 154/200
> Climate rank: 15/200
> Overall score: 55.23
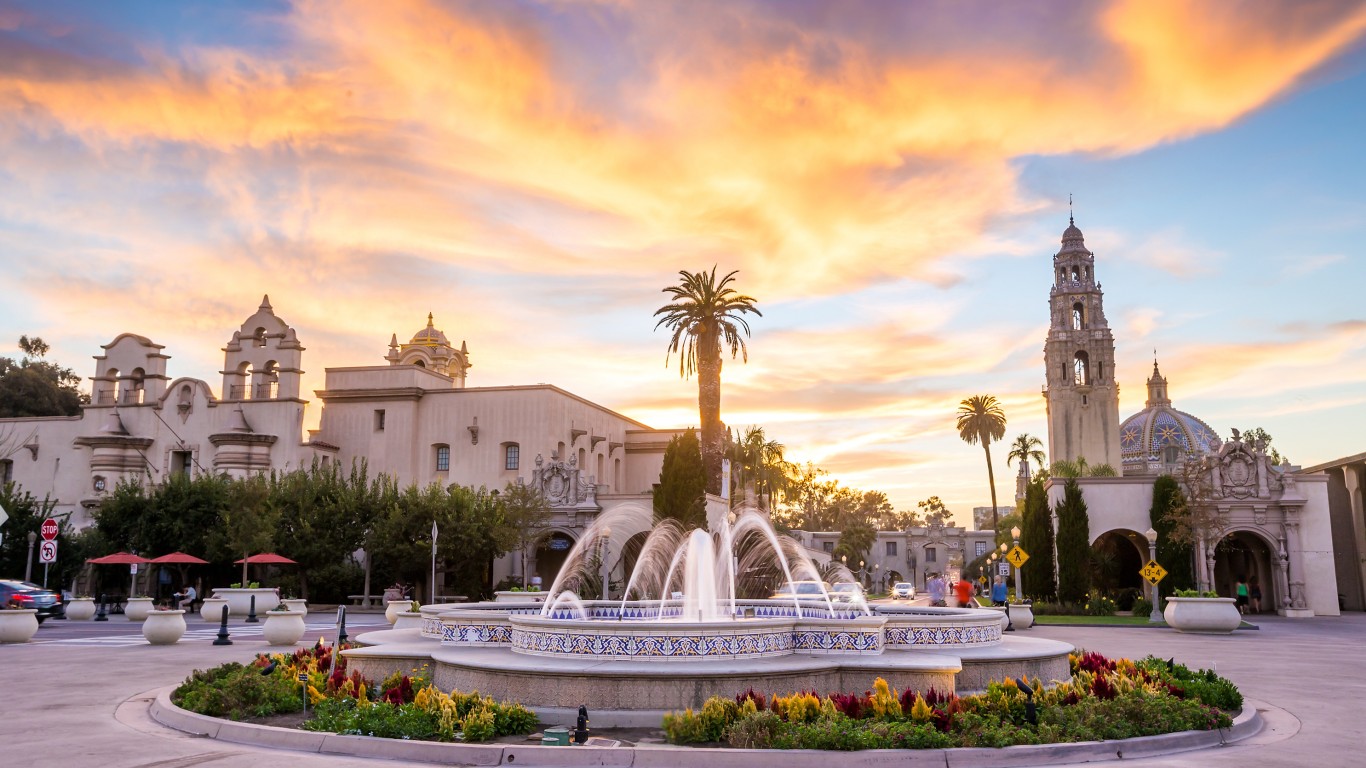
3. San Diego, California
> Running access rank: 6/200
> Running quality rank: 39/200
> Safety rank: 94/200
> Climate rank: 4/200
> Overall score: 55.53
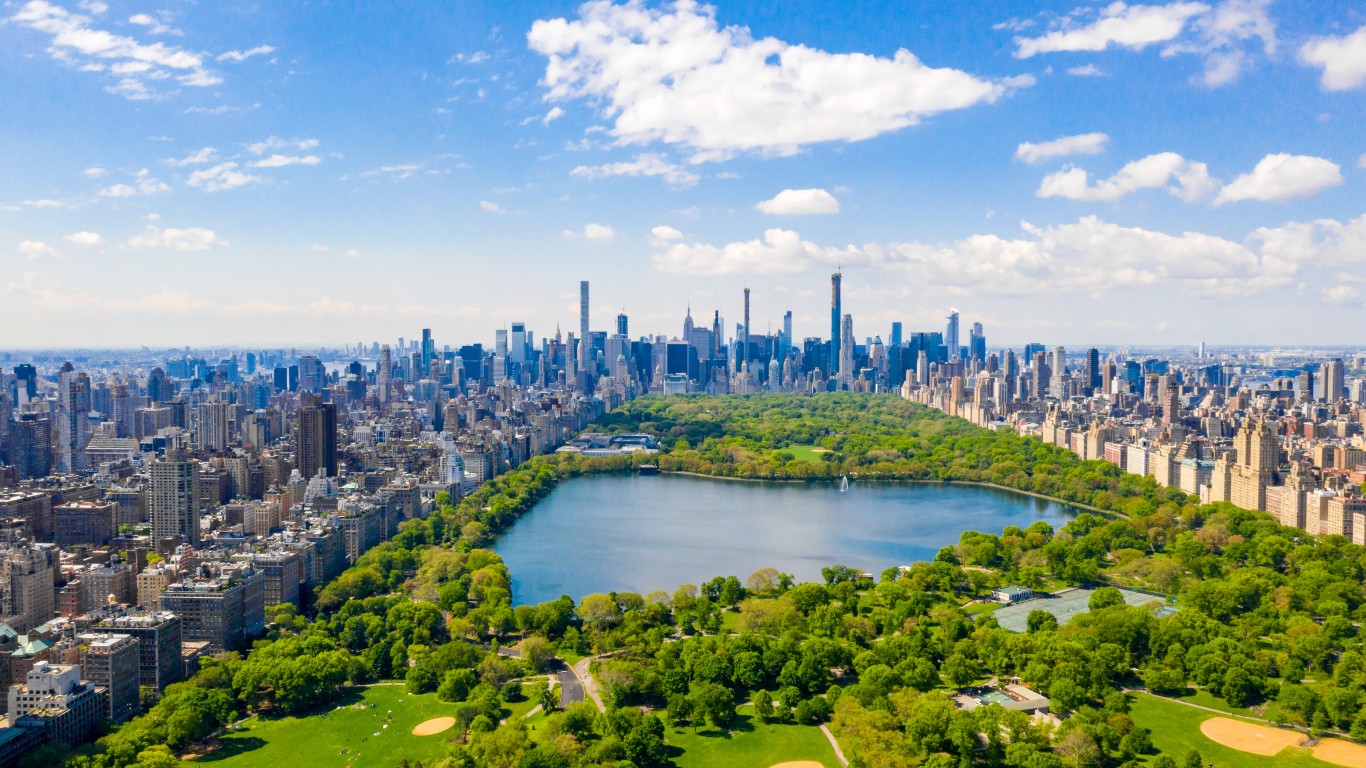
2. New York, New York
> Running access rank: 5/200
> Running quality rank: 15/200
> Safety rank: 52/200
> Climate rank: 108/200
> Overall score: 56.97
[in-text-ad-2]

1. San Francisco, California
> Running access rank: 13/200
> Running quality rank: 1/200
> Safety rank: 100/200
> Climate rank: 8/200
> Overall score: 57.96
100 Million Americans Are Missing This Crucial Retirement Tool
The thought of burdening your family with a financial disaster is most Americans’ nightmare. However, recent studies show that over 100 million Americans still don’t have proper life insurance in the event they pass away.
Life insurance can bring peace of mind – ensuring your loved ones are safeguarded against unforeseen expenses and debts. With premiums often lower than expected and a variety of plans tailored to different life stages and health conditions, securing a policy is more accessible than ever.
A quick, no-obligation quote can provide valuable insight into what’s available and what might best suit your family’s needs. Life insurance is a simple step you can take today to help secure peace of mind for your loved ones tomorrow.
Click here to learn how to get a quote in just a few minutes.
Thank you for reading! Have some feedback for us?
Contact the 24/7 Wall St. editorial team.
 24/7 Wall St.
 24/7 Wall St.