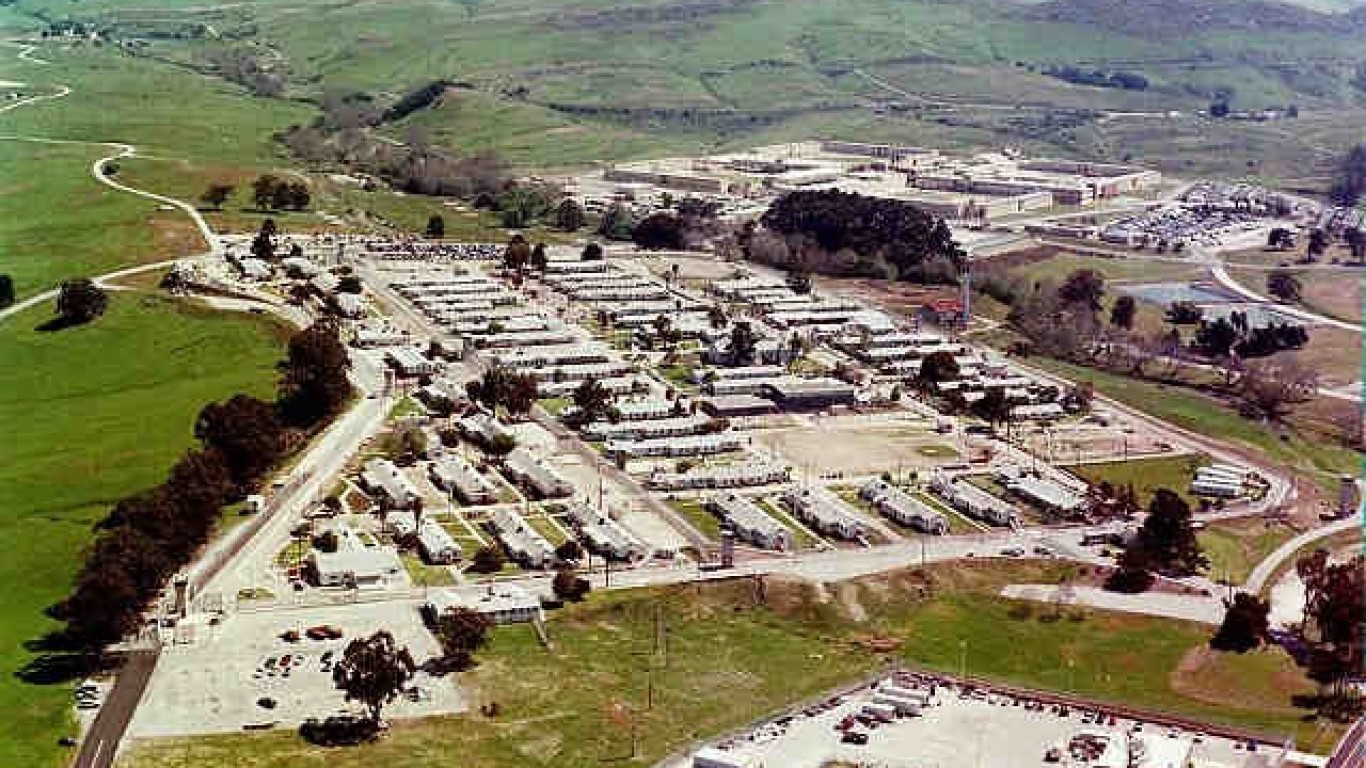
California has the country’s second-largest prison population after Texas, but the Golden State has greatly reduced the number of inmates in its state prison system after years of sentencing reforms. The coronavirus pandemic also led to a spike in the release of thousands of nonviolent offenders who had 60 days or less to serve in an effort to maximize space.
Today, about 95,000 people are serving time in California’s state-run correctional facilities, down from a peak of 165,000 in 2006, a population so large that federal courts mandated the state find a way to ease prison overcrowding. In 2015, California voters had their say, passing Proposition 47, a ballot measure to further reduce overcrowding by lowering penalties for nonviolent crimes like shoplifting, larceny of low-value items, and possession of small amounts of illegal drugs.
But recent data shows that most of California’s state-run adult correctional facilities still house more inmates than the facilities were designed to hold. Prison overcrowding typically requires measures like converting double-occupancy cells into triples and filling common areas like gymnasiums with bunk beds. Prison overcrowding increases the chance of violence encounters between inmates, reduces sanitary conditions, and adds more security challenges for prison staff. (Also see, California is the state with the most people on death row.)
To identify the biggest prisons in California and how crowded they are, 24/7 Wall St. reviewed inmate counts in 32 of the state’s adult correctional institutions. Data is as of March 1, 2023, as reported by the California Department of Corrections and Rehabilitation Division of Correctional Policy Research and Internal Oversight Office of Research. Inmate counts include all boarders confined in state-run prisons. All data came from the California Department of Corrections and Rehabilitation.
Out of the 32 state correctional facilities with data, only eight hold fewer inmates than the facility was designed to hold. These include the California Institution for Women in the city of Chino, east of Los Angeles, and the California State Prison in Sacramento.
At the other end of the spectrum, the state’s largest prisons by inmate populations are also among the most overcrowded. These include Avenal State Prison in the central San Joaquin Valley and the California Rehabilitation Center in Riverside County, which are run at 159% and 166% overcapacity, respectively. (This is what prisoners are paid for forced labor in every state.)
Five California state prisons, including Avenal and CRC have occupancy rates of more than 150%, meaning that the facility is holding about one extra inmate for every two it was intended to hold. The average occupancy rate for all 32 correctional facilities is 118%.
Here are California’s biggest prisons.
Click here to see our detailed methodology.
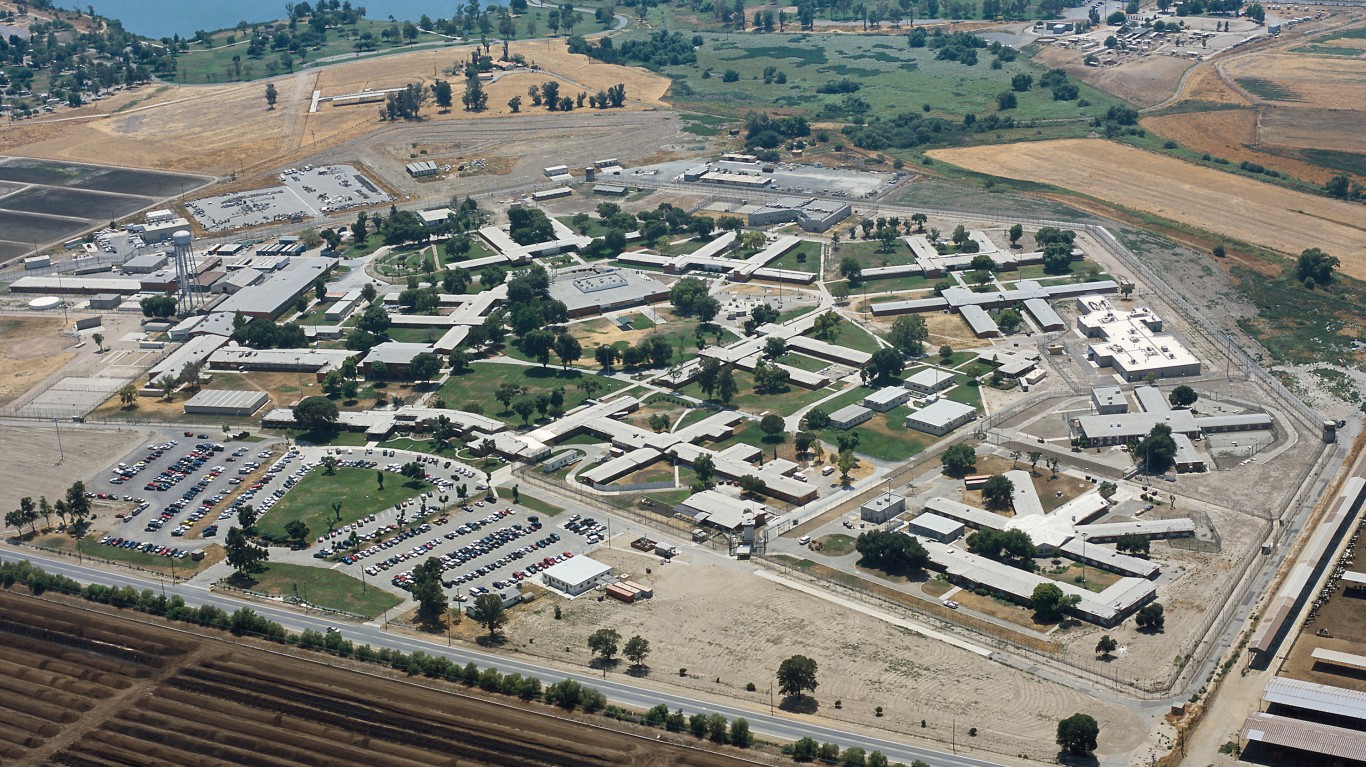
32. California Institution for Women (CIW)
> Inmates: 983
> Capacity: 1,281 – #32 most on list
> Percent occupied: 77% – #31 highest on list
> County: San Bernardino County
[in-text-ad]
31. California State Prison, Sacramento (SAC)
> Inmates: 1,513
> Capacity: 1,828 – #28 most on list
> Percent occupied: 83% – #28 highest on list
> County: Sacramento County
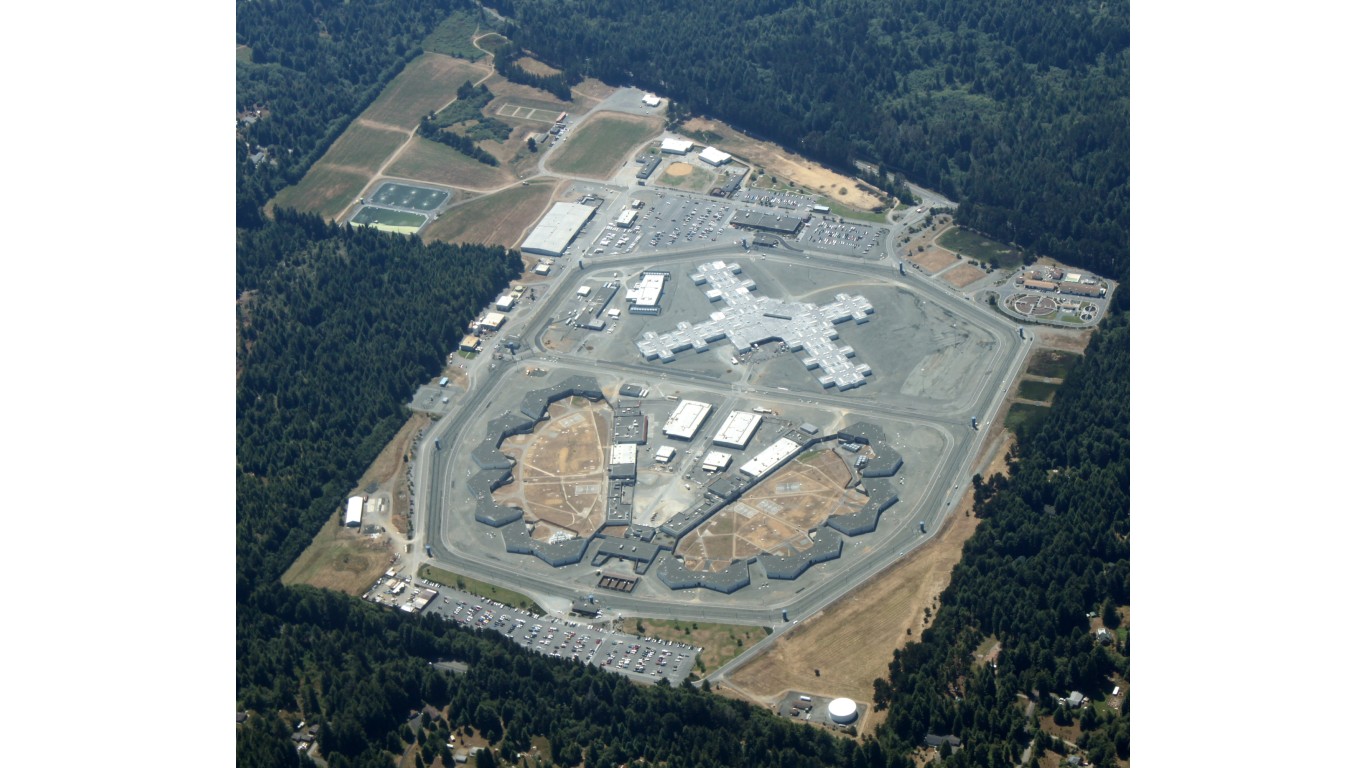
30. Pelican Bay State Prison (PBSP)
> Inmates: 1,602
> Capacity: 2,380 – #16 most on list
> Percent occupied: 67% – #32 highest on list
> County: Del Norte
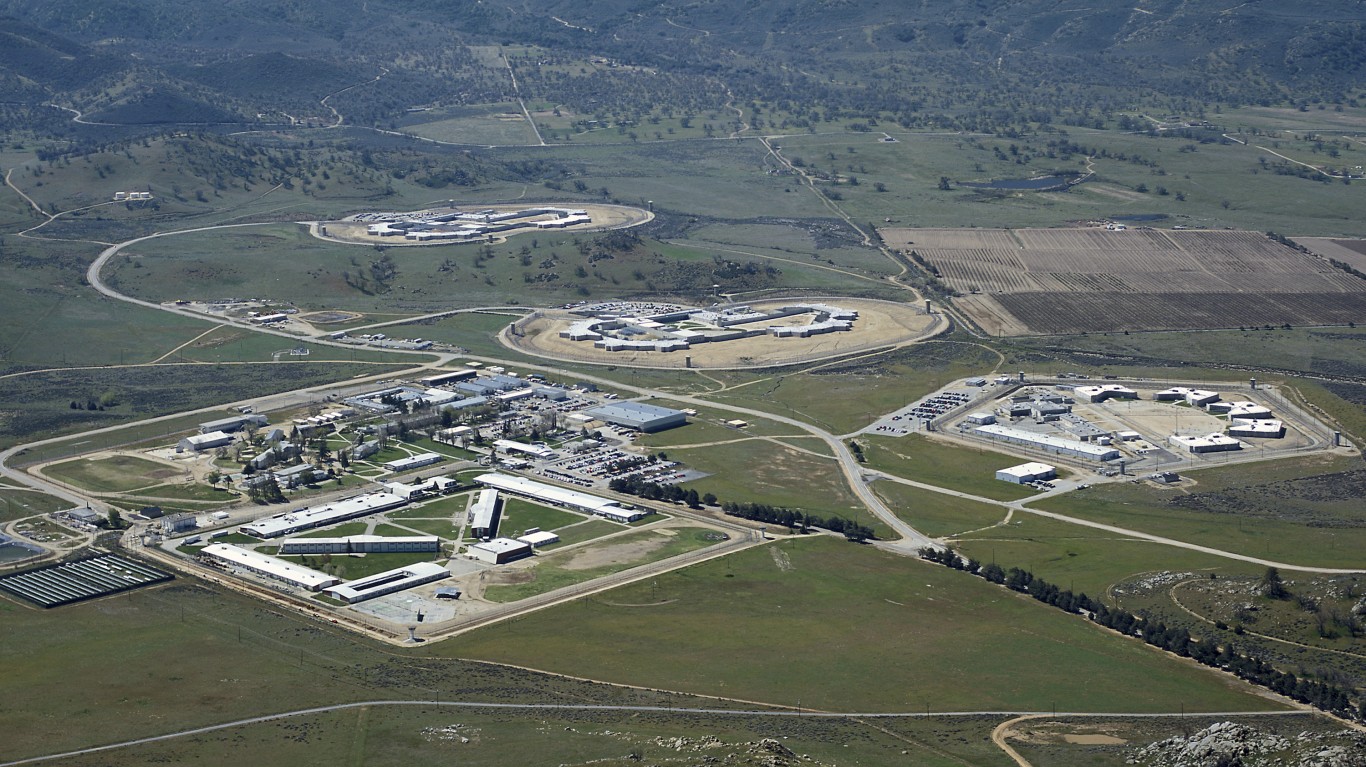
29. California Correctional Institution (CCI)
> Inmates: 1,900
> Capacity: 2,172 – #24 most on list
> Percent occupied: 88% – #26 highest on list
> County: Kern
[in-text-ad-2]
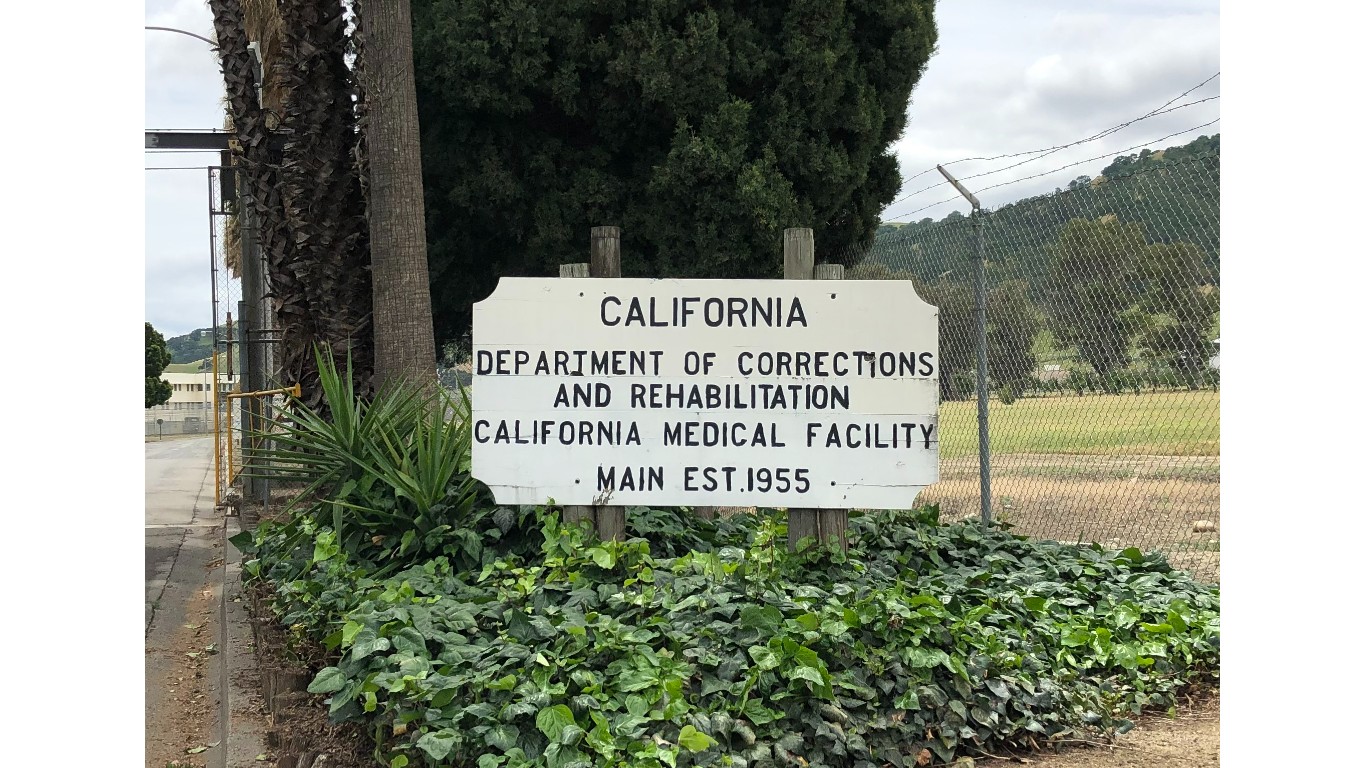
28. California Medical Facility (CMF)
> Inmates: 1,975
> Capacity: 2,318 – #18 most on list
> Percent occupied: 85% – #27 highest on list
> County: Solano
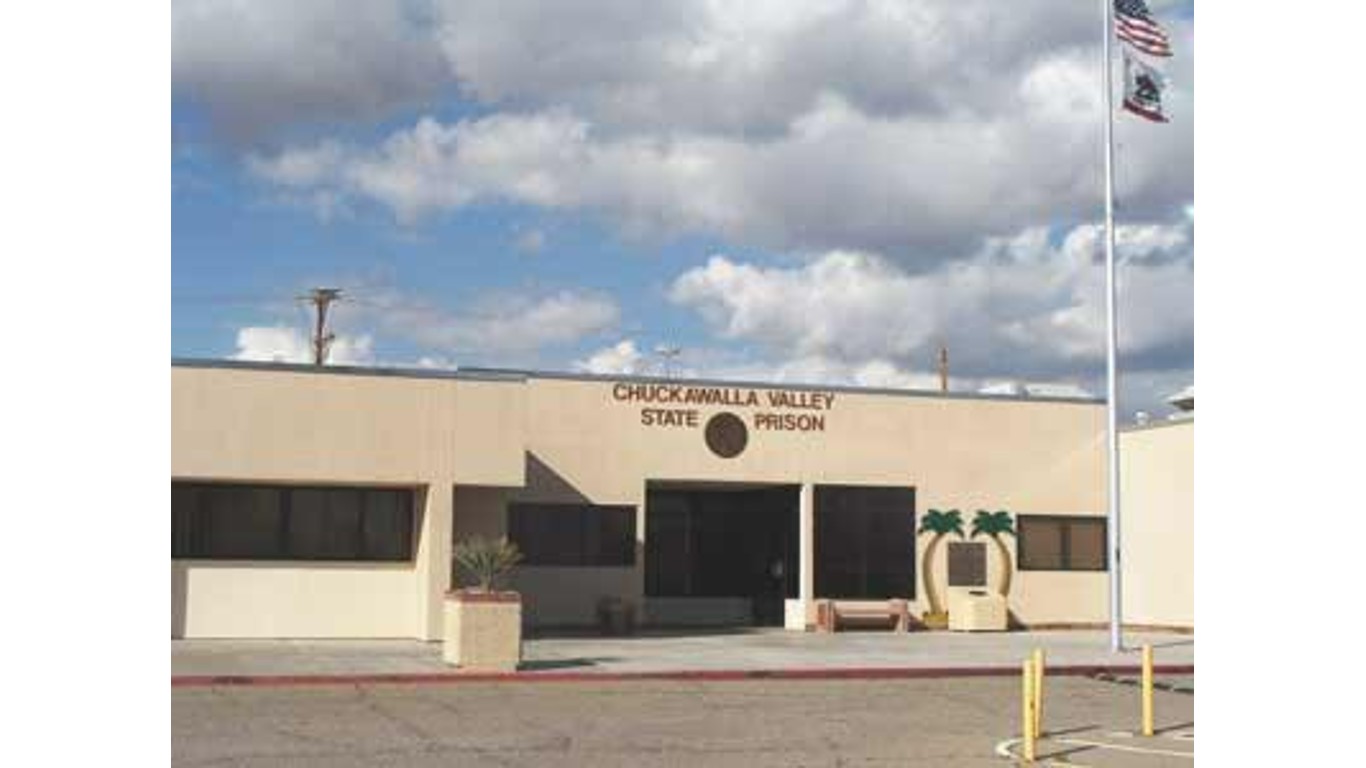
27. Chuckawalla Valley State Prison (CVSP)
> Inmates: 2,094
> Capacity: 1,738 – #30 most on list
> Percent occupied: 121% – #14 highest on list
> County: Riverside
[in-text-ad]
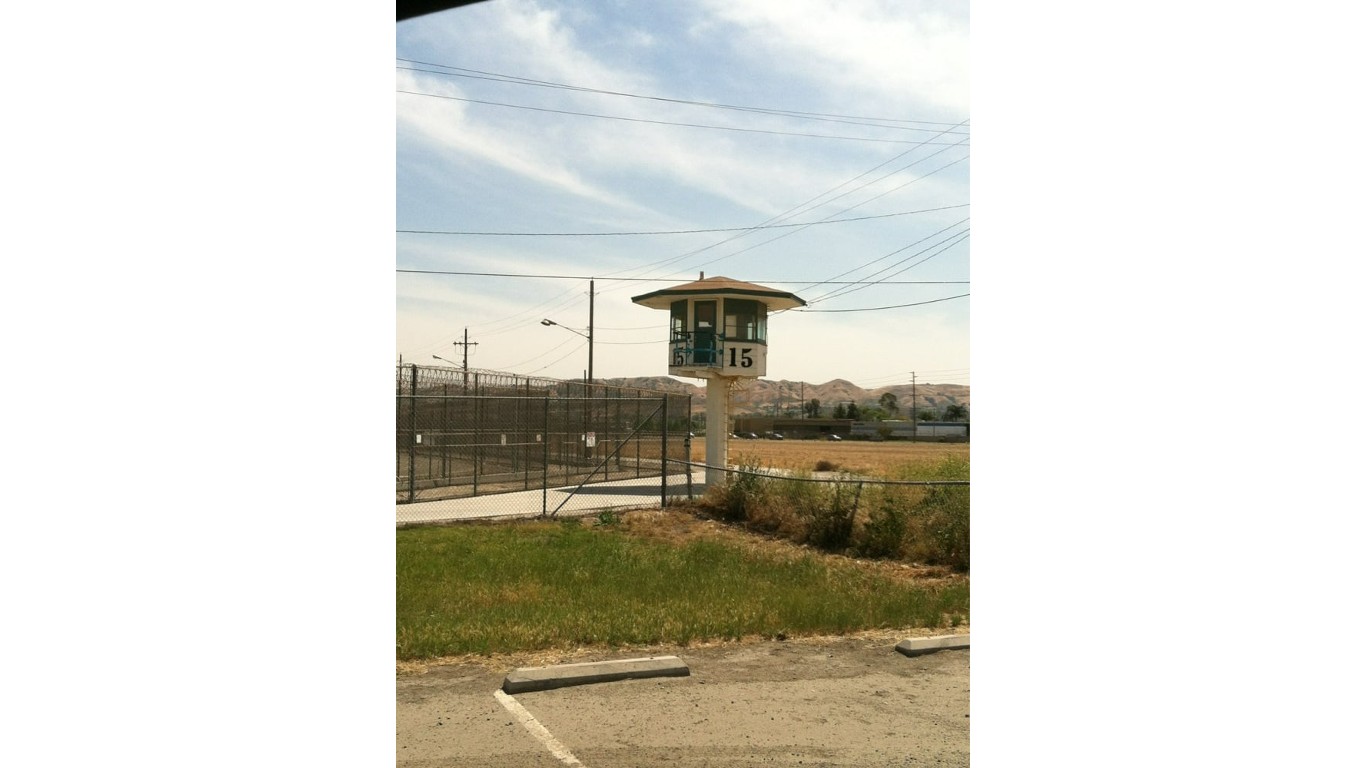
26. California Institution for Men (CIM)
> Inmates: 2,196
> Capacity: 1,604 – #31 most on list
> Percent occupied: 137% – #8 highest on list
> County: San Bernardino
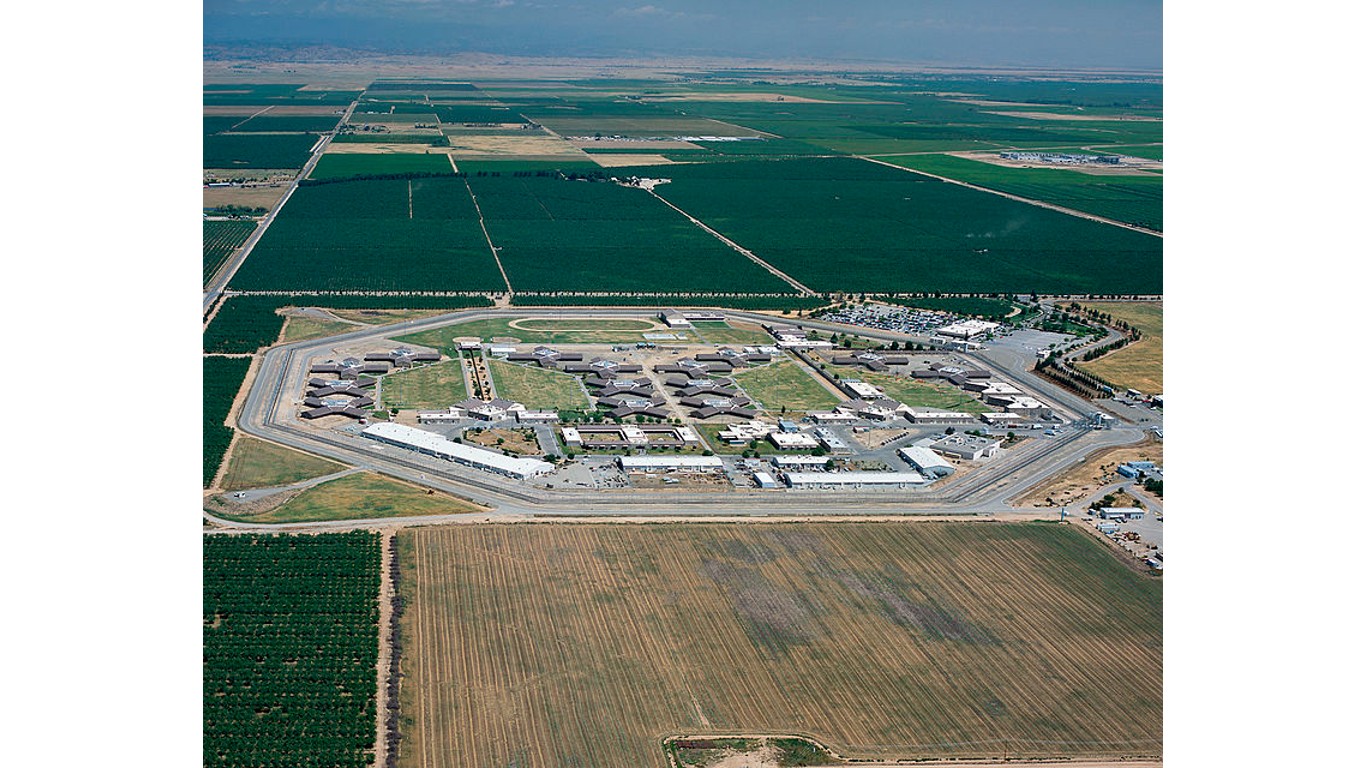
25. Central California Women’s Facility (CCWF)
> Inmates: 2,355
> Capacity: 1,990 – #26 most on list
> Percent occupied: 118% – #15 highest on list
> County: Madera
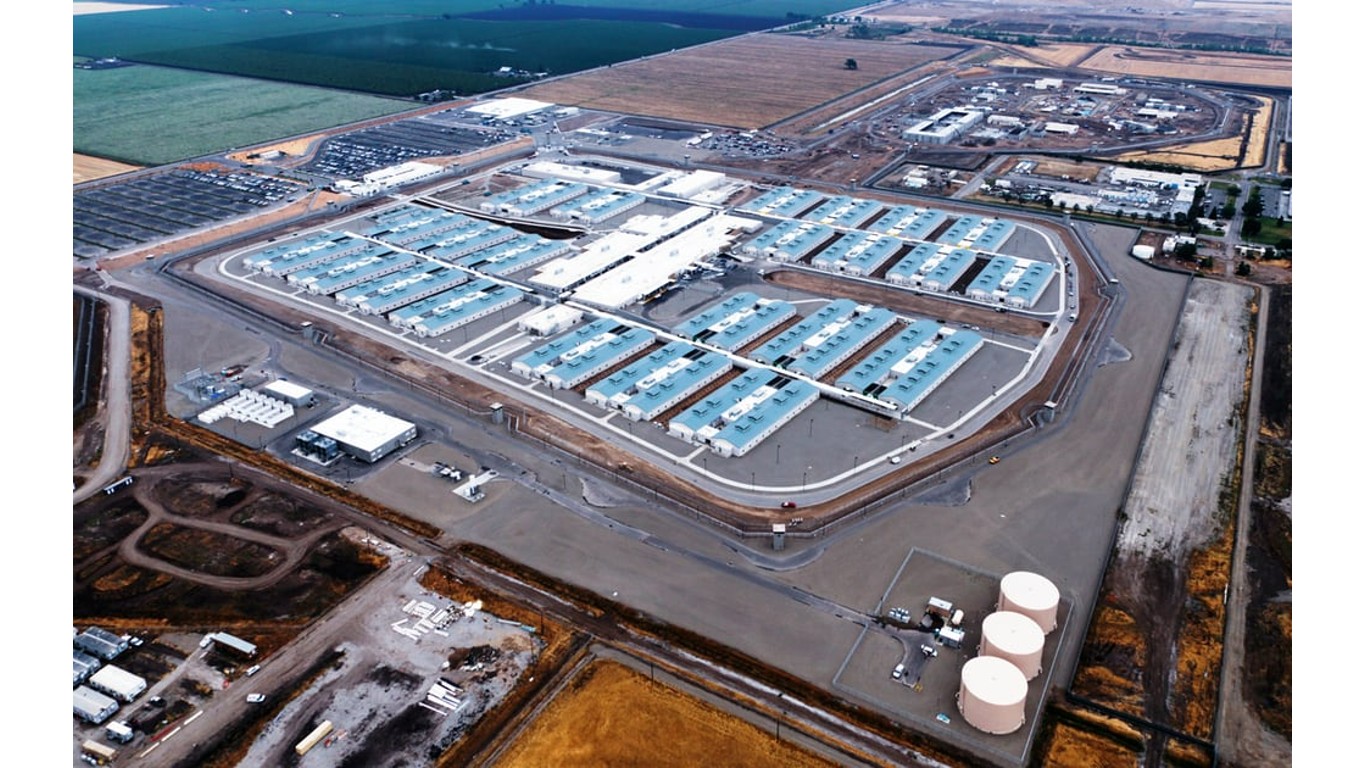
24. California Health Care Facility – Stockton (CHCF)
> Inmates: 2,360
> Capacity: 2,953 – #9 most on list
> Percent occupied: 80% – #30 highest on list
> County: San Joaquin
[in-text-ad-2]

23. Calipatria State Prison (CAL)
> Inmates: 2,494
> Capacity: 2,308 – #19 most on list
> Percent occupied: 108% – #23 highest on list
> County: Imperial
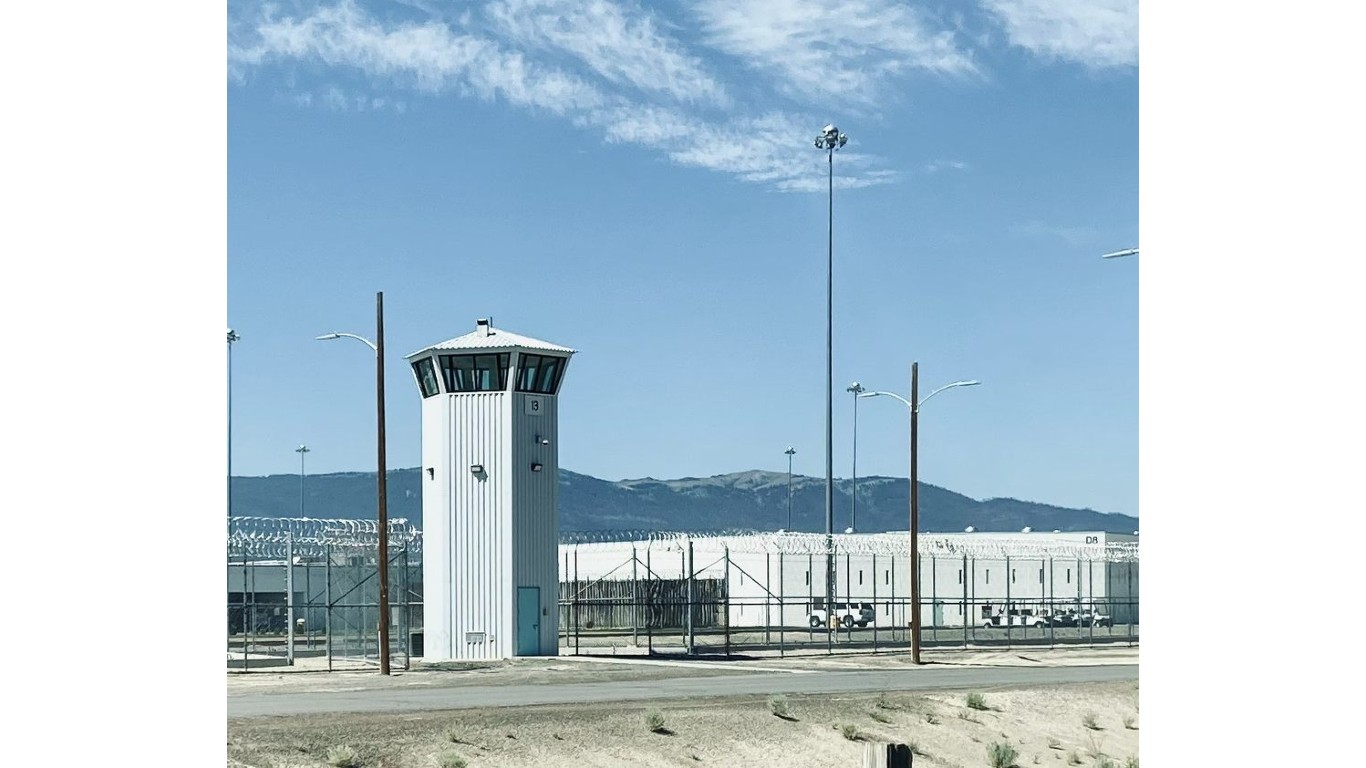
22. High Desert State Prison (HDSP)
> Inmates: 2,518
> Capacity: 2,324 – #17 most on list
> Percent occupied: 108% – #22 highest on list
> County: Lassen
[in-text-ad]

21. California State Prison, Los Angeles County (LAC)
> Inmates: 2,557
> Capacity: 2,300 – #22 most on list
> Percent occupied: 111% – #20 highest on list
> County: Los Angeles
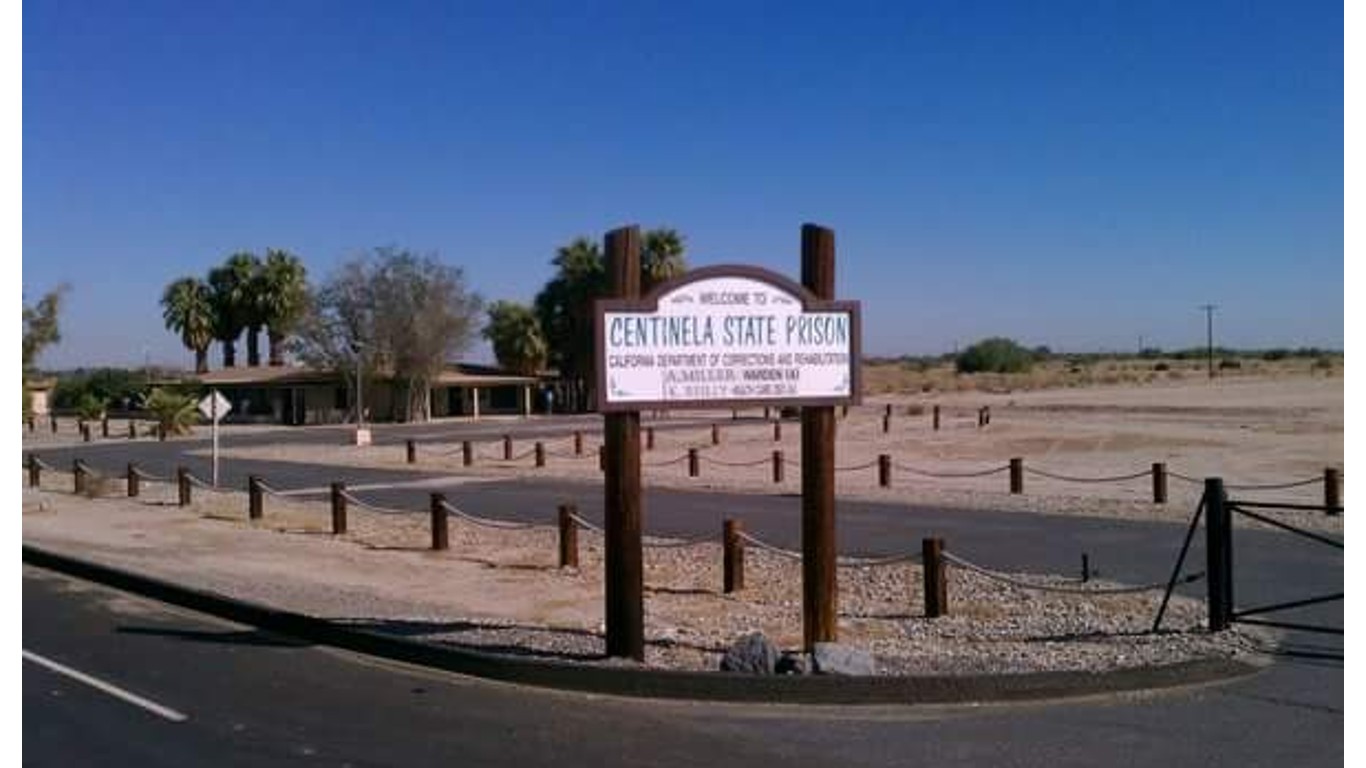
20. Centinela State Prison (CEN)
> Inmates: 2,589
> Capacity: 2,308 – #19 most on list
> Percent occupied: 112% – #19 highest on list
> County: Imperial
19. Kern Valley State Prison (KVSP)
> Inmates: 2,694
> Capacity: 2,448 – #15 most on list
> Percent occupied: 110% – #21 highest on list
> County: Kern
[in-text-ad-2]
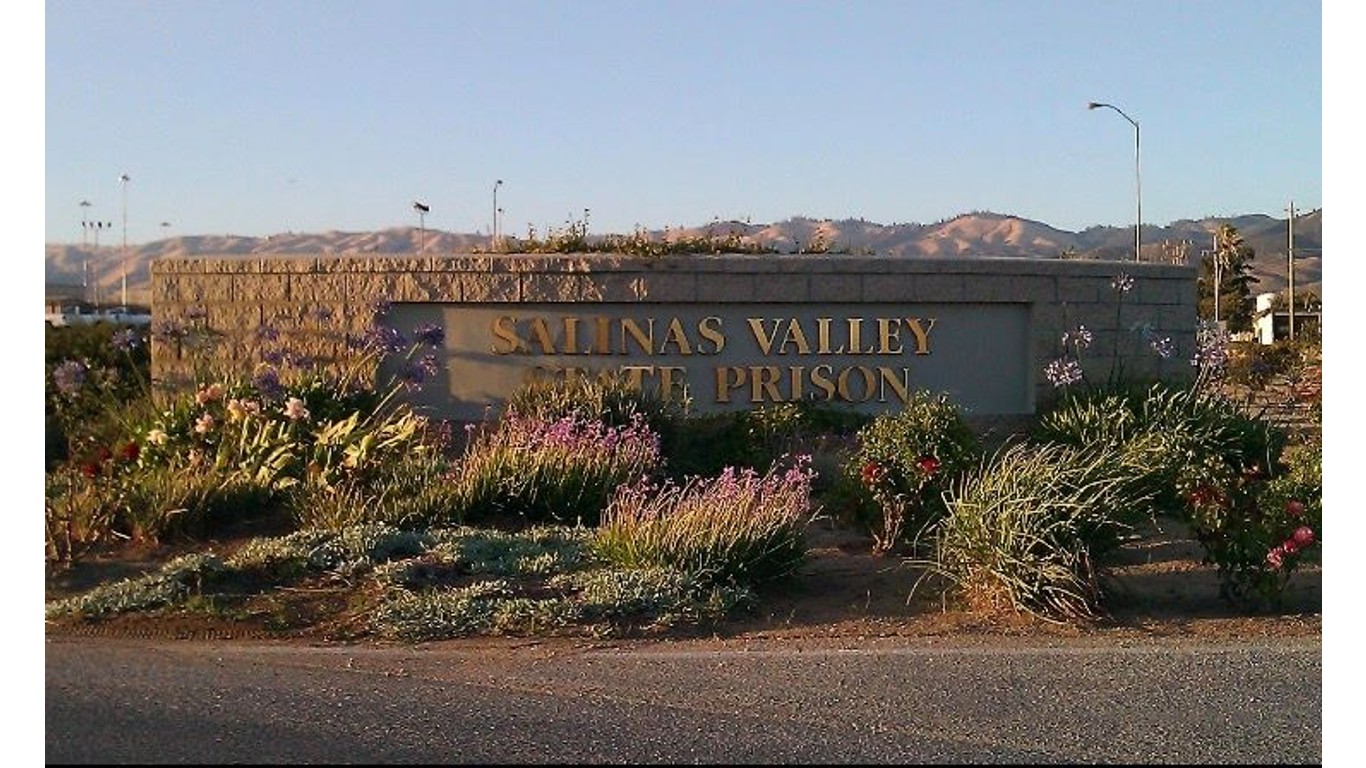
18. Salinas Valley State Prison (SVSP)
> Inmates: 2,900
> Capacity: 2,452 – #14 most on list
> Percent occupied: 118% – #15 highest on list
> County: Monterey
17. RJ Donovan Correctional Facility (RJD)
> Inmates: 2,938
> Capacity: 2,992 – #7 most on list
> Percent occupied: 98% – #25 highest on list
> County: San Diego
[in-text-ad]
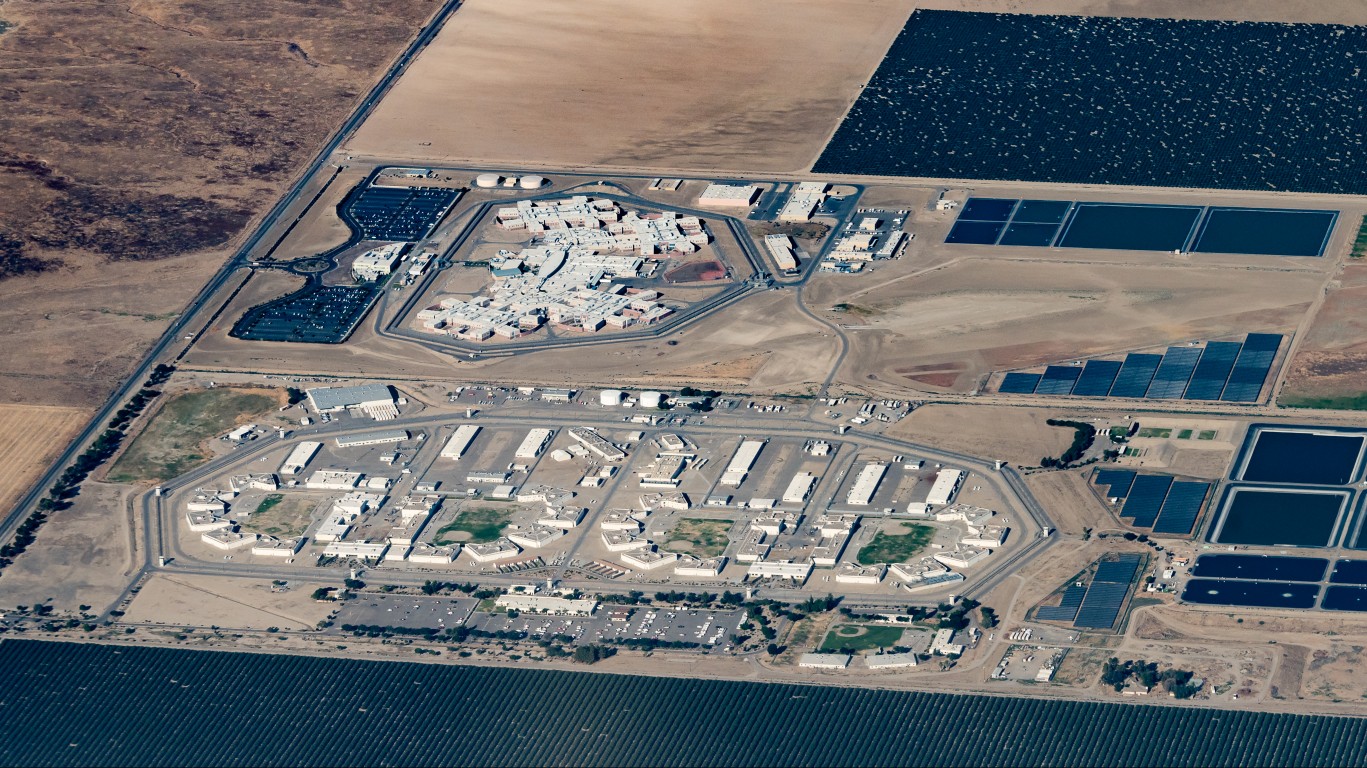
16. Pleasant Valley State Prison (PVSP)
> Inmates: 2,940
> Capacity: 2,308 – #19 most on list
> Percent occupied: 127% – #12 highest on list
> County: Fresno
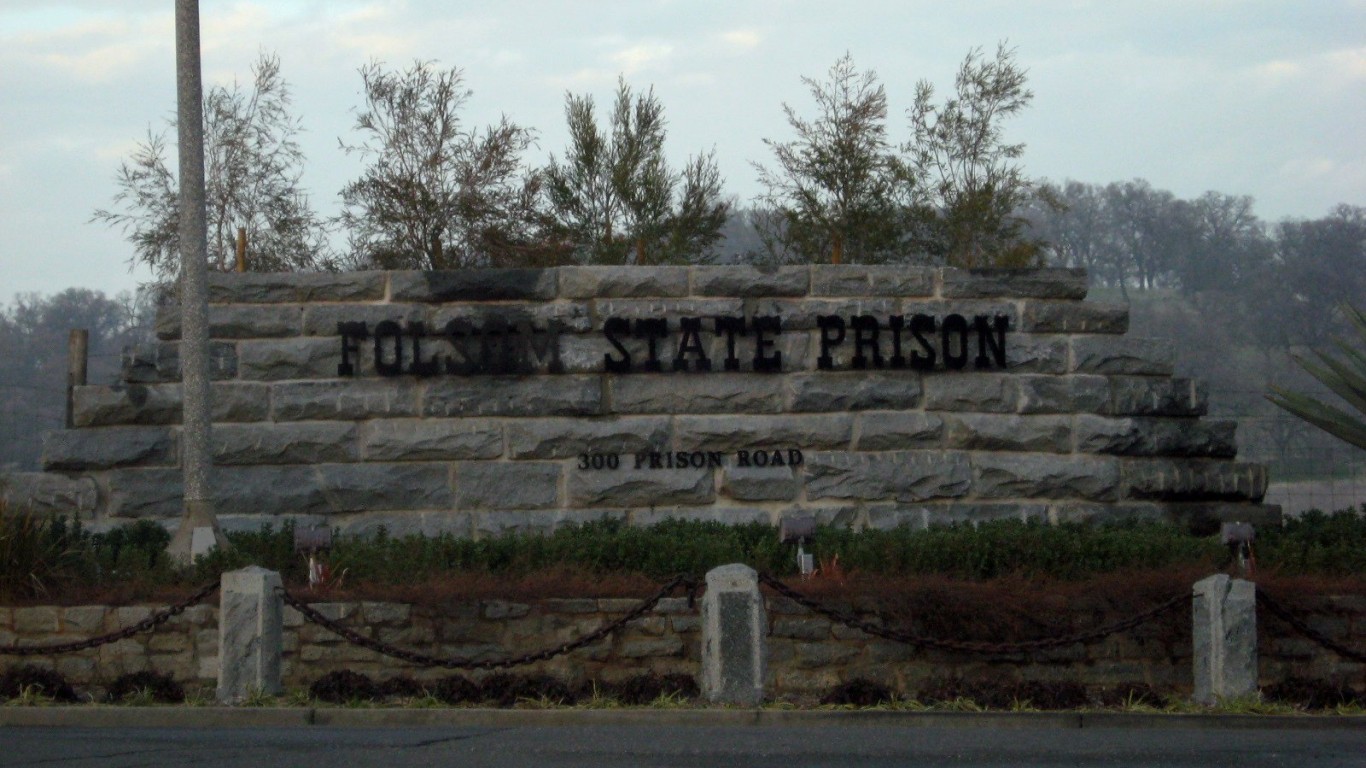
15. Folsom State Prison (FOL)
> Inmates: 3,023
> Capacity: 2,065 – #25 most on list
> Percent occupied: 146% – #6 highest on list
> County: Sacramento
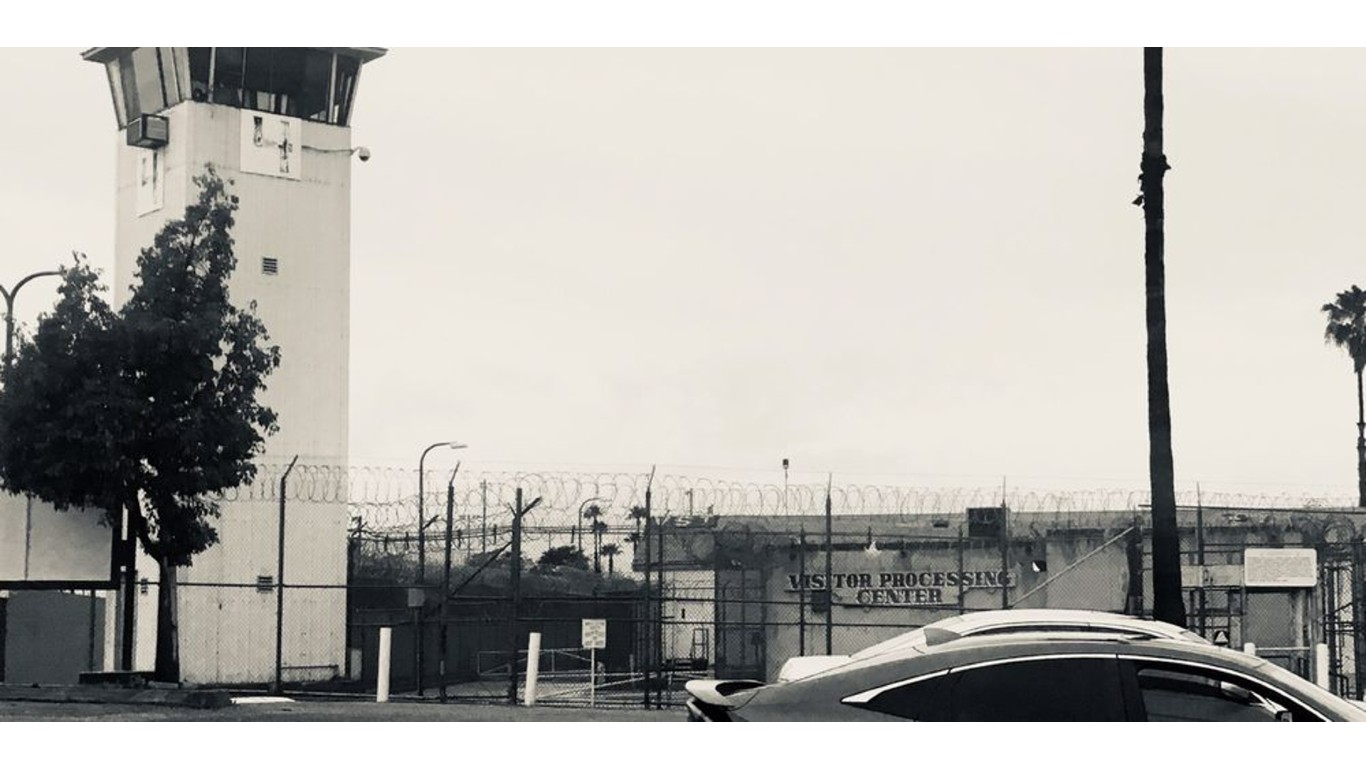
14. California Rehabilitation Center (CRC)
> Inmates: 3,026
> Capacity: 1,822 – #29 most on list
> Percent occupied: 166% – #1 highest on list
> County: Riverside
[in-text-ad-2]
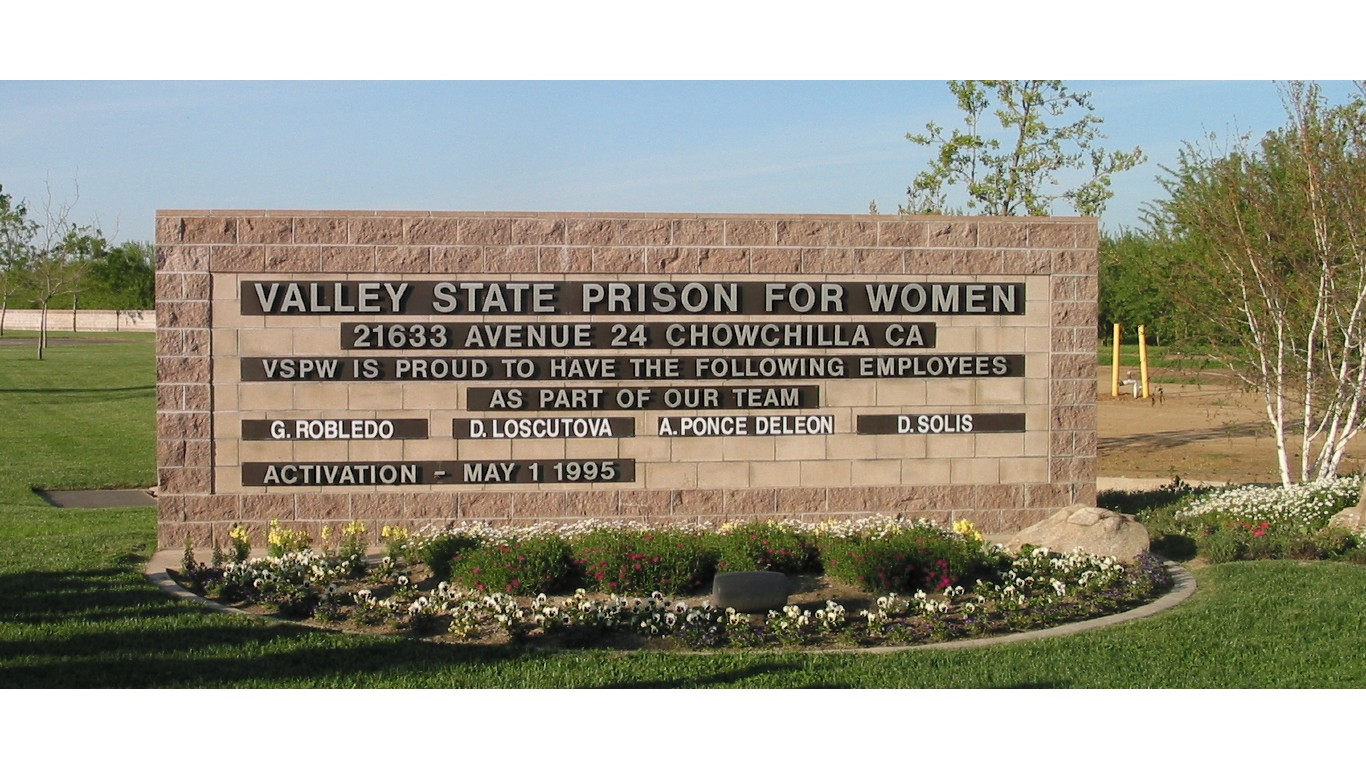
13. Valley State Prison (VSP)
> Inmates: 3,044
> Capacity: 1,961 – #27 most on list
> Percent occupied: 155% – #3 highest on list
> County: Madera

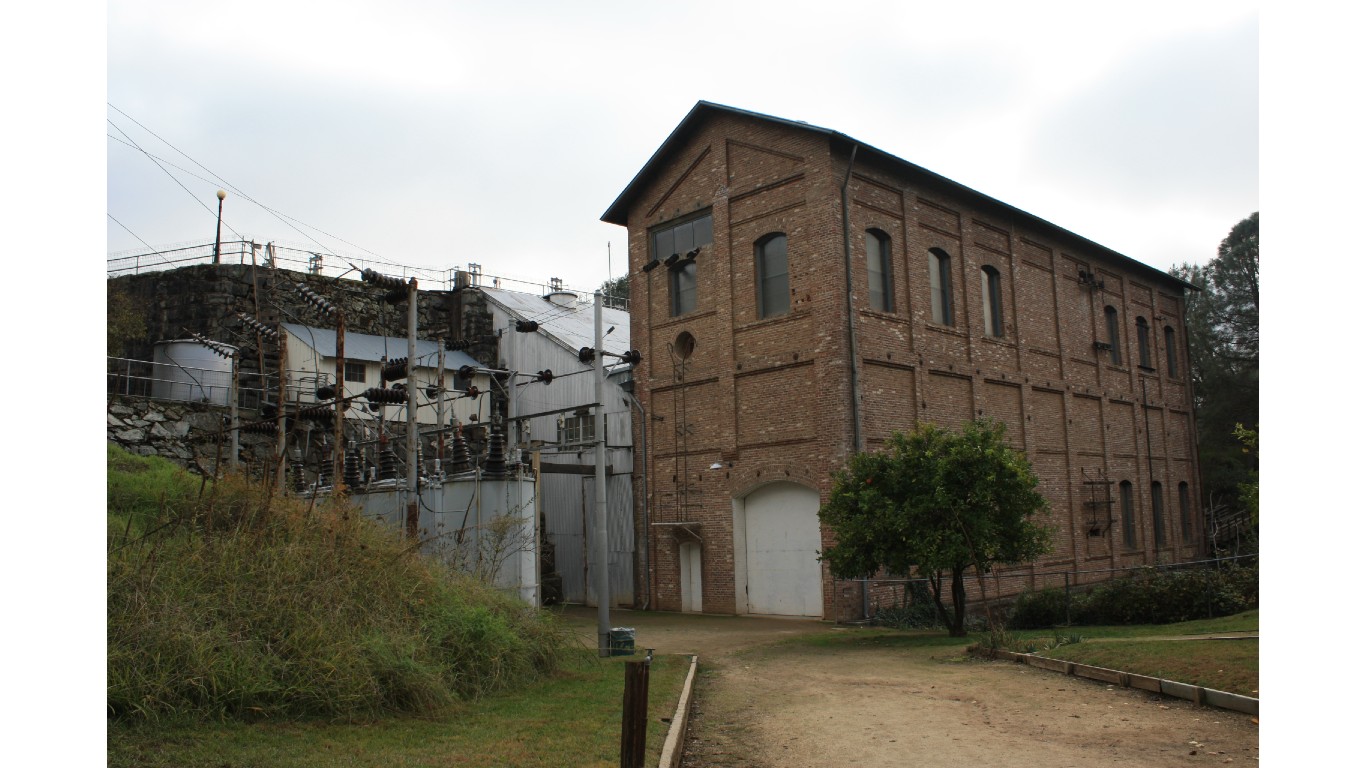
12. California Men’s Colony (CMC)
> Inmates: 3,161
> Capacity: 3,816 – #1 most on list
> Percent occupied: 83% – #28 highest on list
> County: San Luis Obispo
[in-text-ad]
11. Ironwood State Prison (ISP)
> Inmates: 3,180
> Capacity: 2,200 – #23 most on list
> Percent occupied: 145% – #7 highest on list
> County: Riverside
10. California State Prison, Corcoran (COR)
> Inmates: 3,284
> Capacity: 3,115 – #5 most on list
> Percent occupied: 105% – #24 highest on list
> County: Kings
9. California State Prison, Solano (SOL)
> Inmates: 3,438
> Capacity: 2,594 – #13 most on list
> Percent occupied: 133% – #9 highest on list
> County: Los Angeles
[in-text-ad-2]
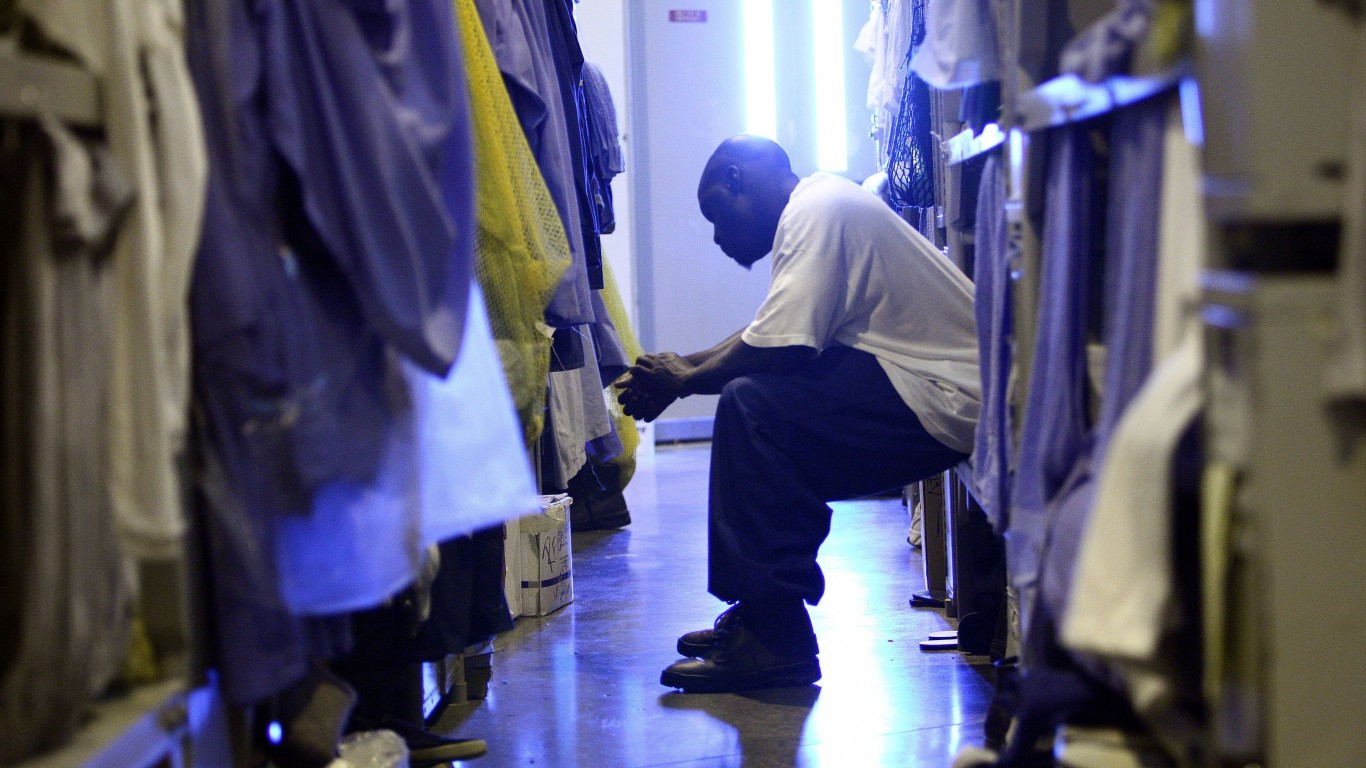
8. Mule Creek State Prison (MCSP)
> Inmates: 3,846
> Capacity: 3,284 – #4 most on list
> Percent occupied: 117% – #17 highest on list
> County: Amador

7. San Quentin State Prison (SQ)
> Inmates: 3,897
> Capacity: 3,084 – #6 most on list
> Percent occupied: 126% – #13 highest on list
> County: Marin
[in-text-ad]
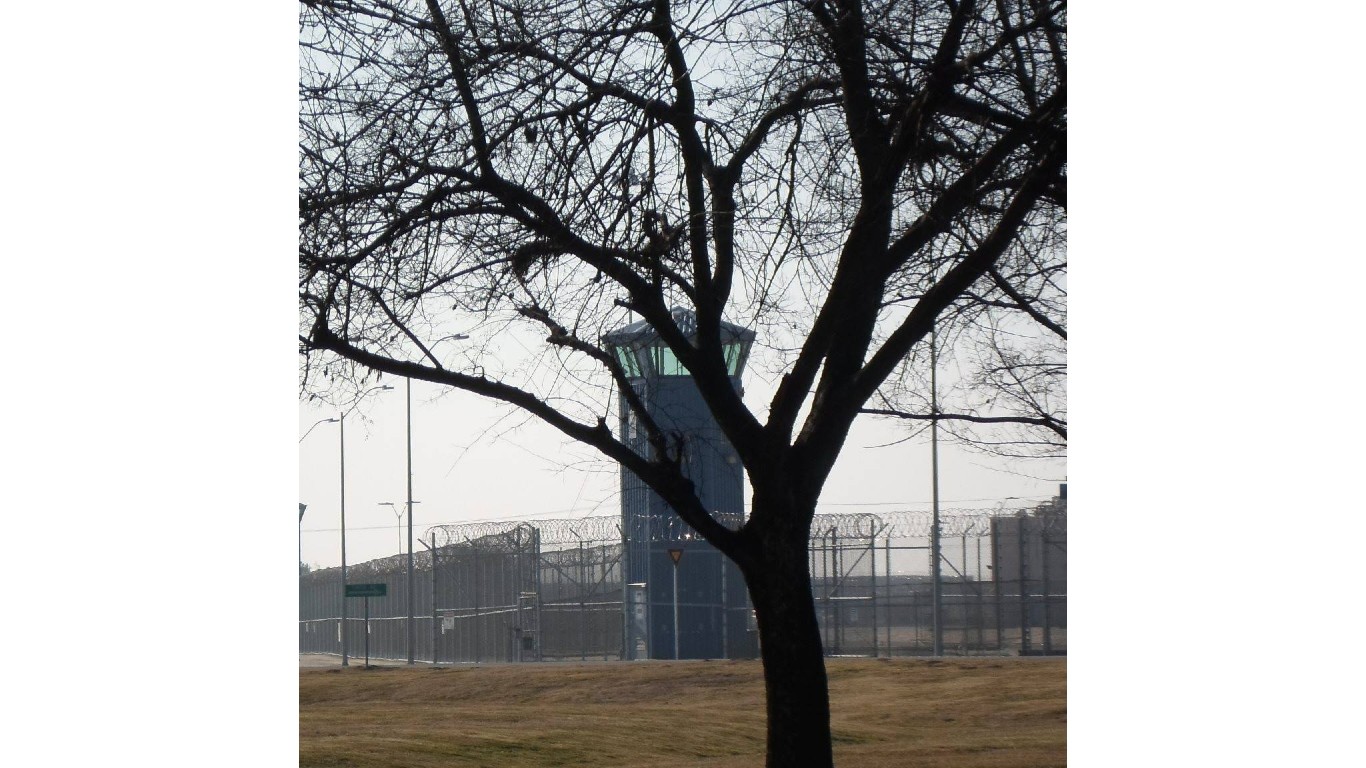
6. Wasco State Prison (WSP)
> Inmates: 3,951
> Capacity: 2,984 – #8 most on list
> Percent occupied: 132% – #10 highest on list
> County: Kern
5. Sierra Conservation Center (SCC)
> Inmates: 3,956
> Capacity: 3,404 – #3 most on list
> Percent occupied: 116% – #18 highest on list
> County: Tuolumne
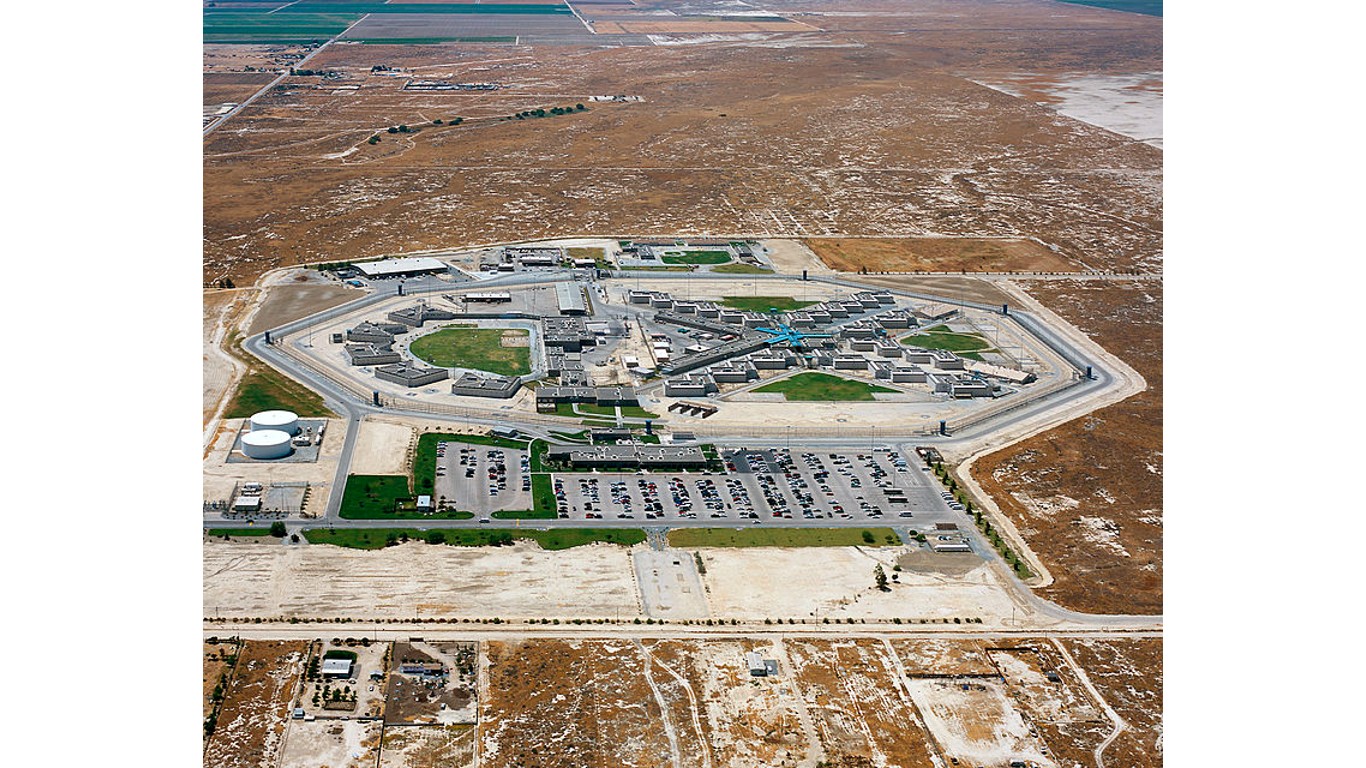
4. North Kern State Prison (NKSP)
> Inmates: 4,153
> Capacity: 2,694 – #12 most on list
> Percent occupied: 154% – #4 highest on list
> County: Kern
[in-text-ad-2]
3. Correctional Training Facility (CTF)
> Inmates: 4,265
> Capacity: 2,800 – #11 most on list
> Percent occupied: 152% – #5 highest on list
> County: Monterey
2. California Substance Abuse Treatment Facility (SATF)
> Inmates: 4,535
> Capacity: 3,424 – #2 most on list
> Percent occupied: 132% – #10 highest on list
> County: Kings
[in-text-ad]
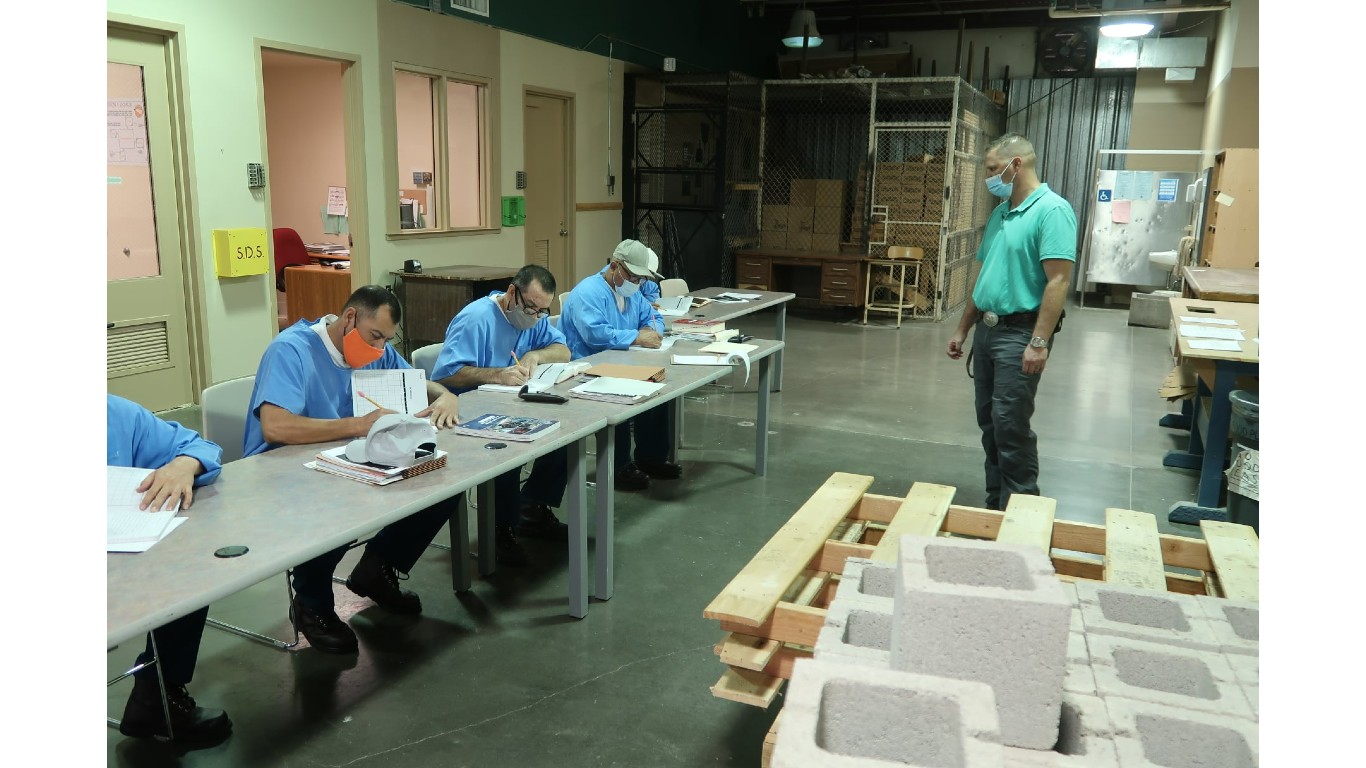
1. Avenal State Prison (ASP)
> Inmates: 4,612
> Capacity: 2,909 – #10 most on list
> Percent occupied: 159% – #2 highest on list
> County: Kings
Methodology
To identify the biggest prisons in California and how crowded they are, 24/7 Wall St. reviewed inmate counts in 32 of the state’s adult correctional institutions. Data is as of March 1, 2023, as California Department of Corrections and Rehabilitation Division of Correctional Policy Research and Internal Oversight Office of Research.
Inmate counts include felons, county contract boarders, federal boarders, state boarders,
safekeepers, county diagnostic cases, Department of Mental Health boarders, and Division of
Juvenile Justice boarders confined in state-run prisons. Each prison’s total capacity and occupancy also came from the California Department of Corrections and Rehabilitation.
The Average American Has No Idea How Much Money You Can Make Today (Sponsor)
The last few years made people forget how much banks and CD’s can pay. Meanwhile, interest rates have spiked and many can afford to pay you much more, but most are keeping yields low and hoping you won’t notice.
But there is good news. To win qualified customers, some accounts are paying almost 10x the national average! That’s an incredible way to keep your money safe and earn more at the same time. Our top pick for high yield savings accounts includes other benefits as well. You can earn up to 3.80% with a Checking & Savings Account today Sign up and get up to $300 with direct deposit. No account fees. FDIC Insured.
Click here to see how much more you could be earning on your savings today. It takes just a few minutes to open an account to make your money work for you.
Our top pick for high yield savings accounts includes other benefits as well. You can earn up to 4.00% with a Checking & Savings Account from Sofi. Sign up and get up to $300 with direct deposit. No account fees. FDIC Insured.
Thank you for reading! Have some feedback for us?
Contact the 24/7 Wall St. editorial team.
 24/7 Wall St.
 24/7 Wall St.