
The United States comprises 50 states, each with its own culture, laws, and socioeconomic conditions that can greatly affect health. Varying greatly between the states, access to health care and job opportunities also contribute to health outcomes among adult residents. Urban populations in most states for instance are consistently better off than residents of rural areas with respect to health, although these gaps also vary between and within states.
24/7 Tempo determined the healthiest city in every state. To measure and rank the health of cities in every state, we calculated an index using eight data points from the 2023 County Health Rankings & Roadmaps program of the University of Wisconsin Population Health Institute.
Based on our index, healthier cities had lower obesity and smoking rates, but these characteristics varied between populations of healthy cities and the state as a whole. Forty of the healthiest cities on this list have lower adult obesity rates than their respective states, and 35 have lower adult smoking rates than their respective states. Similarly, in 42 cities, the percentage of adults reporting poor or fair health is lower than the respective percentage statewide.
Still, because these cities represent the healthiest in each state and not the healthiest nationwide, they are very diverse in their health outcomes. For example, the adult smoking rate ranges from 6.8% in Provo-Orem, Utah, to 20.1% in Morgantown, West Virginia, and the adult obesity rate ranges from just 17.6% in Boulder, Colorado, to 39.1% in Dover, Delaware. (Here is the most obese city in every state.)
The healthiest city on this list is also the healthiest nationwide. San Jose-Sunnyvale-Santa Clara, California, boasts an 8.5% smoking rate and a 20.1% obesity rate, some of the lowest nationwide. It also has a $139,892 median household income, the highest of the 384 metros considered. And though it is the healthiest city in its state, Gulfport-Biloxi, Mississippi, is the least healthy city on the list, ranking as the 79th least healthy of the 384 metros considered. It reported a 19% smoking rate, and a 36.5% obesity rate. Its median household income of $56,348 ranks 89th lowest. (Here are America’s healthiest cities.)
Click here for the healthiest city in every state
Click here for our detailed methodology

Alabama: Daphne-Fairhope-Foley
> Adults in fair or poor health: 14.9% (state: 18.9%)
> Adult smoking rate: 16.9% (state: 19.5%)
> Adult obesity rate: 32.6% (state: 39.3%)
> Median household income: $63,866 (state: $53,913)
[in-text-ad]

Alaska: Fairbanks
> Adults in fair or poor health: 11.9% (state: 12.2%)
> Adult smoking rate: 15.9% (state: 18.0%)
> Adult obesity rate: 31.2% (state: 31.8%)
> Median household income: $72,149 (state: $77,845)

Arizona: Phoenix-Mesa-Chandler
> Adults in fair or poor health: 14.0% (state: 14.5%)
> Adult smoking rate: 15.0% (state: 13.7%)
> Adult obesity rate: 31.2% (state: 31.5%)
> Median household income: $75,731 (state: $69,056)

Arkansas: Fayetteville-Springdale-Rogers
> Adults in fair or poor health: 16.2% (state: 19.4%)
> Adult smoking rate: 17.7% (state: 21.6%)
> Adult obesity rate: 32.5% (state: 37.2%)
> Median household income: $71,767 (state: $52,528)
[in-text-ad-2]

California: San Jose-Sunnyvale-Santa Clara
> Adults in fair or poor health: 10.7% (state: 14.4%)
> Adult smoking rate: 8.5% (state: 9.0%)
> Adult obesity rate: 20.9% (state: 30.2%)
> Median household income: $139,892 (state: $84,907)
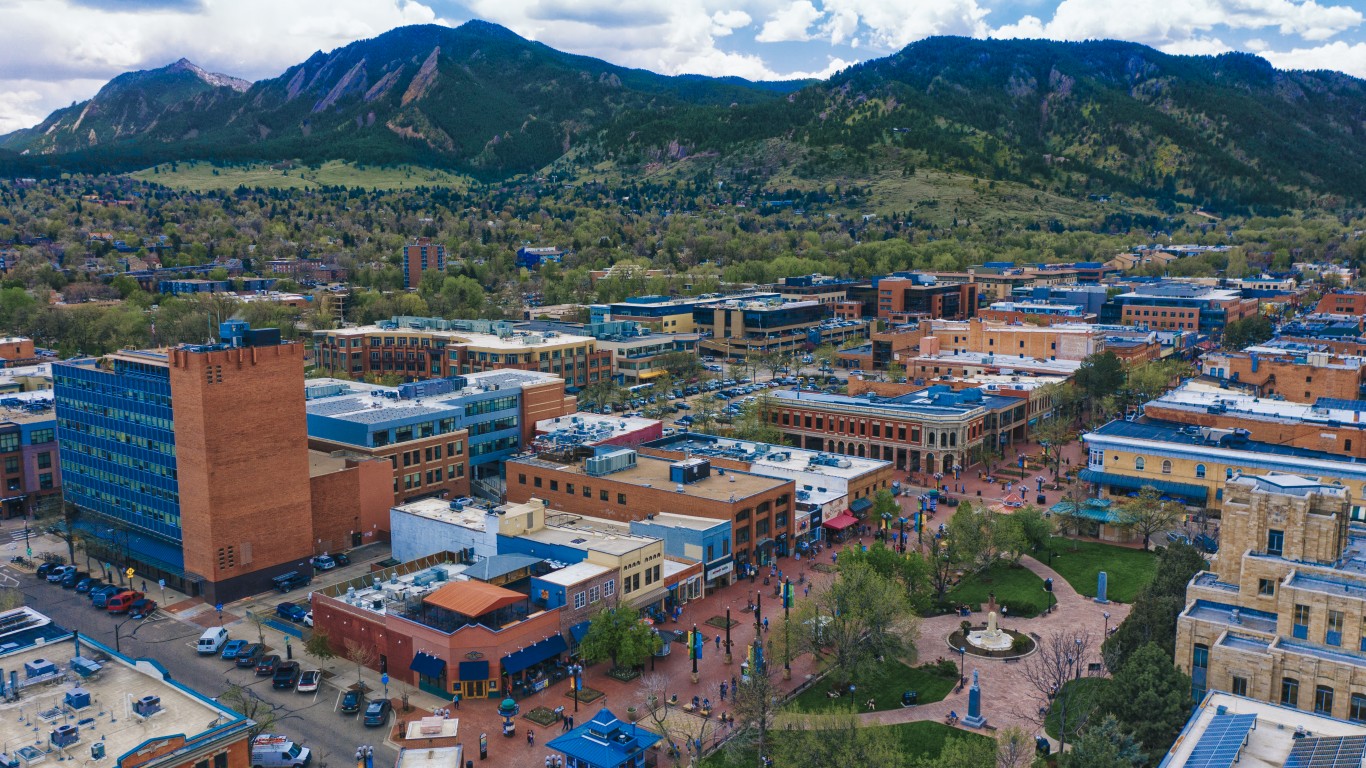
Colorado: Boulder
> Adults in fair or poor health: 8.5% (state: 10.2%)
> Adult smoking rate: 11.3% (state: 12.6%)
> Adult obesity rate: 17.6% (state: 24.2%)
> Median household income: $90,168 (state: $82,254)
[in-text-ad]

Connecticut: Bridgeport-Stamford-Norwalk
> Adults in fair or poor health: 9.9% (state: 11.0%)
> Adult smoking rate: 10.5% (state: 12.6%)
> Adult obesity rate: 23.5% (state: 29.5%)
> Median household income: $100,810 (state: $83,771)

Delaware: Dover
> Adults in fair or poor health: 14.6% (state: 12.8%)
> Adult smoking rate: 20.0% (state: 15.8%)
> Adult obesity rate: 39.1% (state: 36.2%)
> Median household income: $64,308 (state: $71,091)

Florida: Naples-Marco Island
> Adults in fair or poor health: 14.5% (state: 13.3%)
> Adult smoking rate: 15.2% (state: 15.5%)
> Adult obesity rate: 27.2% (state: 28.3%)
> Median household income: $74,215 (state: $63,062)
[in-text-ad-2]

Georgia: Atlanta-Sandy Springs-Alpharetta
> Adults in fair or poor health: 14.1% (state: 15.1%)
> Adult smoking rate: 14.9% (state: 16.3%)
> Adult obesity rate: 32.8% (state: 34.3%)
> Median household income: $77,589 (state: $66,559)

Hawaii: Urban Honolulu
> Adults in fair or poor health: 11.4% (state: 10.3%)
> Adult smoking rate: 12.0% (state: 12.2%)
> Adult obesity rate: 24.3% (state: 25.0%)
> Median household income: $90,704 (state: $84,857)
[in-text-ad]

Idaho: Boise City
> Adults in fair or poor health: 12.5% (state: 11.8%)
> Adult smoking rate: 14.7% (state: 14.2%)
> Adult obesity rate: 31.2% (state: 31.3%)
> Median household income: $73,343 (state: $66,474)
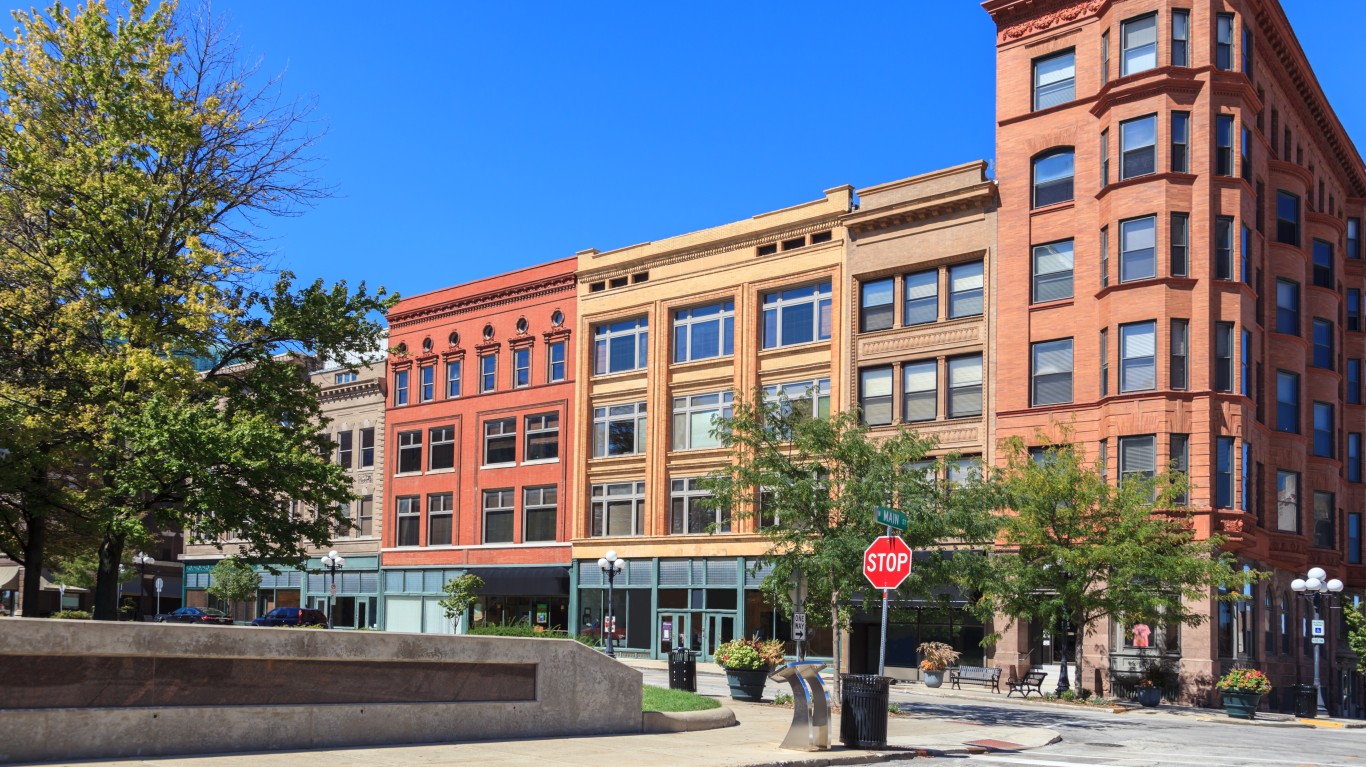
Illinois: Bloomington
> Adults in fair or poor health: 12.0% (state: 12.3%)
> Adult smoking rate: 15.7% (state: 12.8%)
> Adult obesity rate: 36.1% (state: 32.5%)
> Median household income: $69,612 (state: $72,205)

Indiana: Bloomington
> Adults in fair or poor health: 14.8% (state: 15.1%)
> Adult smoking rate: 19.4% (state: 20.2%)
> Adult obesity rate: 33.8% (state: 37.2%)
> Median household income: $52,588 (state: $62,743)
[in-text-ad-2]

Iowa: Ames
> Adults in fair or poor health: 10.8% (state: 12.0%)
> Adult smoking rate: 15.0% (state: 16.8%)
> Adult obesity rate: 33.7% (state: 37.2%)
> Median household income: $64,569 (state: $65,600)

Kansas: Lawrence
> Adults in fair or poor health: 11.6% (state: 12.8%)
> Adult smoking rate: 15.8% (state: 17.2%)
> Adult obesity rate: 32.0% (state: 35.8%)
> Median household income: $56,576 (state: $64,124)
[in-text-ad]
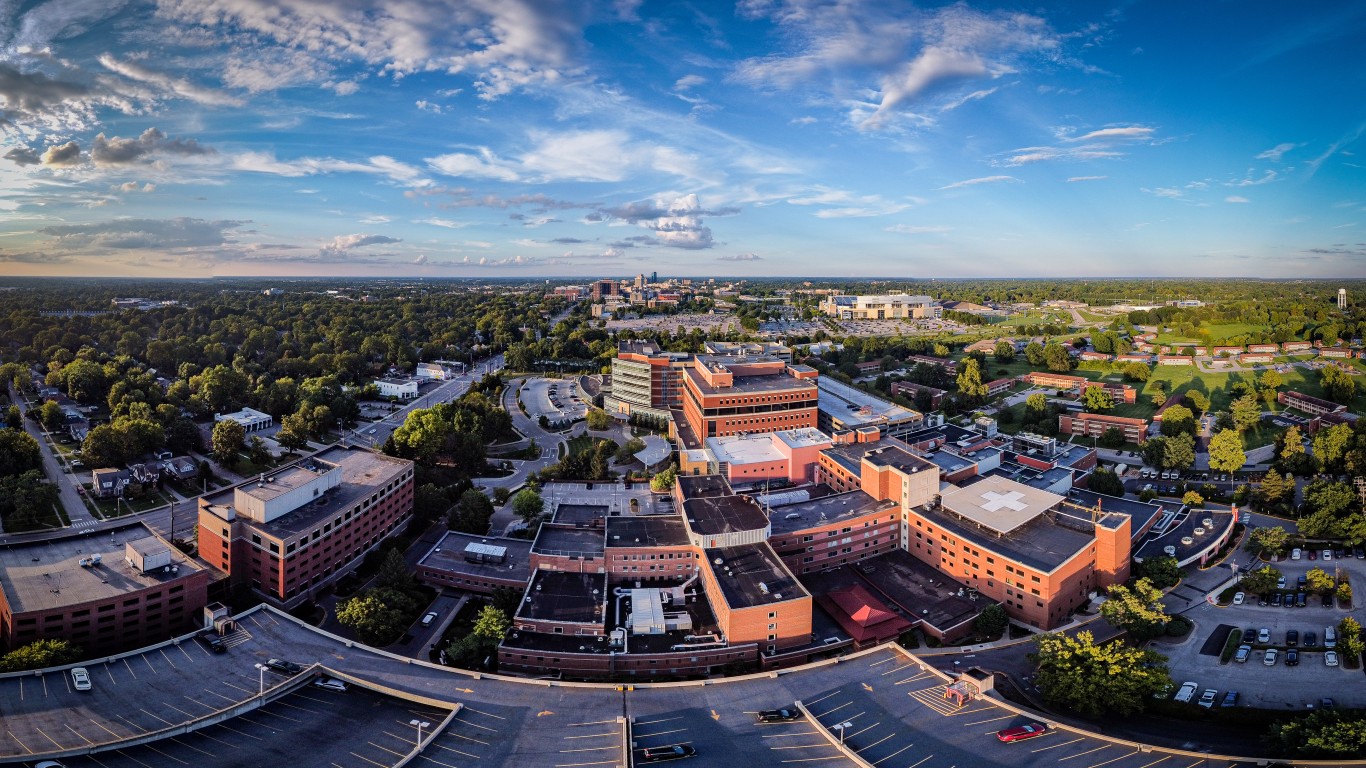
Kentucky: Lexington-Fayette
> Adults in fair or poor health: 16.4% (state: 19.5%)
> Adult smoking rate: 18.8% (state: 22.2%)
> Adult obesity rate: 34.1% (state: 37.0%)
> Median household income: $62,612 (state: $55,573)
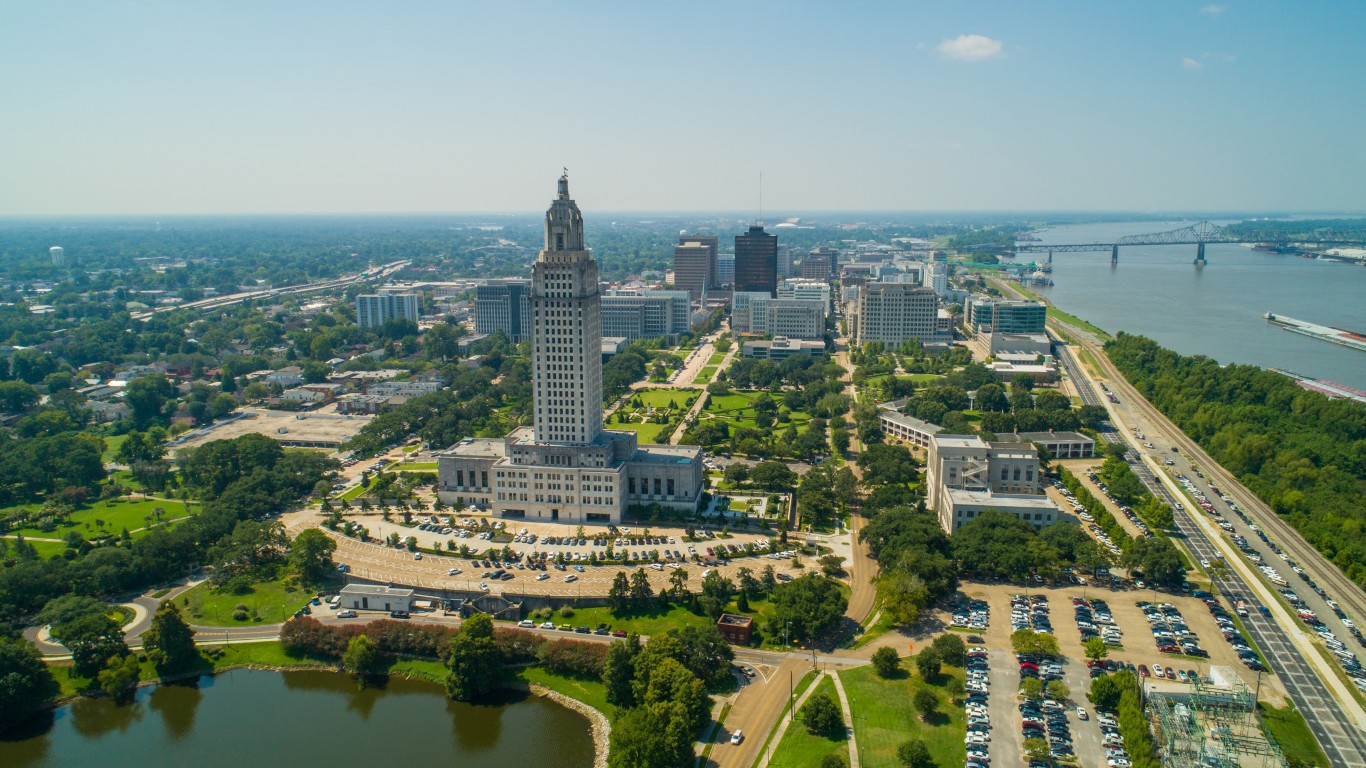
Louisiana: Baton Rouge
> Adults in fair or poor health: 16.6% (state: 19.0%)
> Adult smoking rate: 17.9% (state: 18.9%)
> Adult obesity rate: 37.3% (state: 38.3%)
> Median household income: $58,276 (state: $52,087)

Maine: Portland-South Portland
> Adults in fair or poor health: 9.6% (state: 11.1%)
> Adult smoking rate: 14.3% (state: 18.0%)
> Adult obesity rate: 28.0% (state: 31.3%)
> Median household income: $78,558 (state: $64,767)
[in-text-ad-2]
Maryland: California-Lexington Park
> Adults in fair or poor health: 11.3% (state: 10.6%)
> Adult smoking rate: 15.5% (state: 11.1%)
> Adult obesity rate: 36.5% (state: 30.9%)
> Median household income: $108,397 (state: $90,203)

Massachusetts: Boston-Cambridge-Newton
> Adults in fair or poor health: 9.9% (state: 10.8%)
> Adult smoking rate: 11.9% (state: 11.4%)
> Adult obesity rate: 23.9% (state: 24.5%)
> Median household income: $100,750 (state: $89,645)
[in-text-ad]
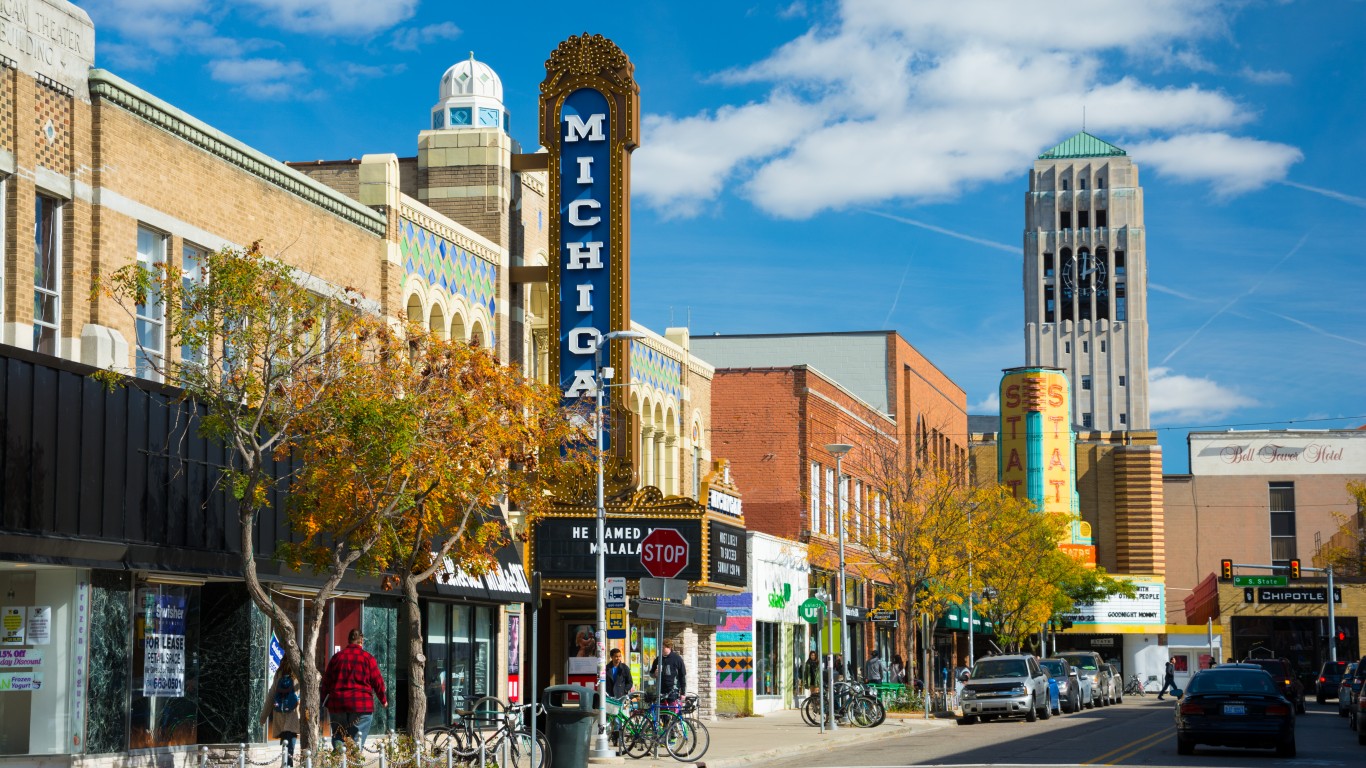
Michigan: Ann Arbor
> Adults in fair or poor health: 10.9% (state: 14.7%)
> Adult smoking rate: 13.8% (state: 19.3%)
> Adult obesity rate: 30.8% (state: 35.3%)
> Median household income: $76,918 (state: $63,498)

Minnesota: Rochester
> Adults in fair or poor health: 9.7% (state: 10.0%)
> Adult smoking rate: 15.2% (state: 14.3%)
> Adult obesity rate: 32.5% (state: 30.6%)
> Median household income: $80,434 (state: $77,720)

Mississippi: Gulfport-Biloxi
> Adults in fair or poor health: 17.1% (state: 18.7%)
> Adult smoking rate: 19.0% (state: 20.7%)
> Adult obesity rate: 36.5% (state: 39.9%)
> Median household income: $56,348 (state: $48,716)
[in-text-ad-2]

Missouri: Columbia
> Adults in fair or poor health: 13.6% (state: 15.2%)
> Adult smoking rate: 16.5% (state: 18.6%)
> Adult obesity rate: 33.4% (state: 34.2%)
> Median household income: $61,781 (state: $61,847)

Montana: Missoula
> Adults in fair or poor health: 10.2% (state: 12.1%)
> Adult smoking rate: 14.2% (state: 17.5%)
> Adult obesity rate: 26.4% (state: 28.9%)
> Median household income: $66,803 (state: $63,249)
[in-text-ad]
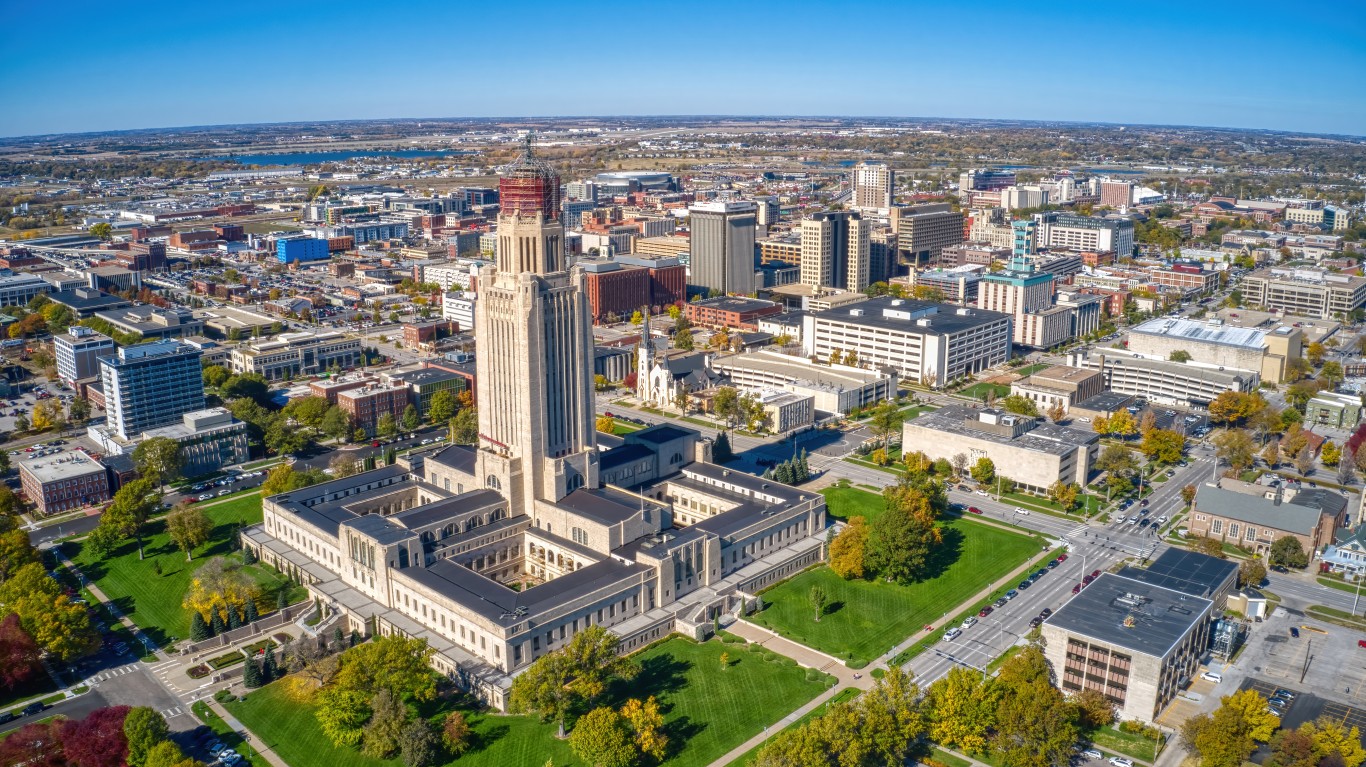
Nebraska: Lincoln
> Adults in fair or poor health: 9.6% (state: 10.2%)
> Adult smoking rate: 15.0% (state: 14.5%)
> Adult obesity rate: 32.9% (state: 34.0%)
> Median household income: $65,229 (state: $66,817)

Nevada: Reno
> Adults in fair or poor health: 14.2% (state: 16.7%)
> Adult smoking rate: 17.4% (state: 14.1%)
> Adult obesity rate: 26.9% (state: 28.1%)
> Median household income: $76,182 (state: $66,274)

New Hampshire: Manchester-Nashua
> Adults in fair or poor health: 10.9% (state: 10.8%)
> Adult smoking rate: 14.1% (state: 14.7%)
> Adult obesity rate: 29.2% (state: 30.5%)
> Median household income: $91,627 (state: $88,465)
[in-text-ad-2]

New Jersey: Trenton-Princeton
> Adults in fair or poor health: 11.2% (state: 10.8%)
> Adult smoking rate: 12.3% (state: 11.1%)
> Adult obesity rate: 28.4% (state: 27.7%)
> Median household income: $87,662 (state: $89,296)

New Mexico: Santa Fe
> Adults in fair or poor health: 12.1% (state: 13.8%)
> Adult smoking rate: 12.2% (state: 16.9%)
> Adult obesity rate: 21.6% (state: 31.7%)
> Median household income: $67,341 (state: $53,992)
[in-text-ad]

New York: Ithaca
> Adults in fair or poor health: 9.9% (state: 11.8%)
> Adult smoking rate: 14.7% (state: 12.3%)
> Adult obesity rate: 26.9% (state: 26.5%)
> Median household income: $66,441 (state: $74,314)

North Carolina: Raleigh-Cary
> Adults in fair or poor health: 10.5% (state: 13.5%)
> Adult smoking rate: 12.9% (state: 17.0%)
> Adult obesity rate: 29.5% (state: 33.6%)
> Median household income: $85,303 (state: $61,972)

North Dakota: Bismarck
> Adults in fair or poor health: 10.2% (state: 11.6%)
> Adult smoking rate: 15.8% (state: 17.9%)
> Adult obesity rate: 32.9% (state: 33.6%)
> Median household income: $67,793 (state: $66,519)
[in-text-ad-2]

Ohio: Columbus
> Adults in fair or poor health: 13.8% (state: 14.5%)
> Adult smoking rate: 19.6% (state: 20.2%)
> Adult obesity rate: 36.2% (state: 35.8%)
> Median household income: $71,839 (state: $62,262)

Oklahoma: Oklahoma City
> Adults in fair or poor health: 15.6% (state: 17.3%)
> Adult smoking rate: 18.2% (state: 19.6%)
> Adult obesity rate: 35.4% (state: 37.1%)
> Median household income: $61,815 (state: $55,826)
[in-text-ad]

Oregon: Corvallis
> Adults in fair or poor health: 11.1% (state: 12.7%)
> Adult smoking rate: 12.7% (state: 13.6%)
> Adult obesity rate: 28.5% (state: 28.3%)
> Median household income: $64,163 (state: $71,562)

Pennsylvania: State College
> Adults in fair or poor health: 12.7% (state: 13.1%)
> Adult smoking rate: 17.2% (state: 16.7%)
> Adult obesity rate: 31.2% (state: 31.6%)
> Median household income: $66,789 (state: $68,957)

Rhode Island: Providence-Warwick
> Adults in fair or poor health: 12.5% (state: 11.8%)
> Adult smoking rate: 15.7% (state: 14.1%)
> Adult obesity rate: 29.6% (state: 30.6%)
> Median household income: $73,788 (state: $74,008)
[in-text-ad-2]

South Carolina: Hilton Head Island-Bluffton
> Adults in fair or poor health: 12.8% (state: 15.9%)
> Adult smoking rate: 15.5% (state: 19.1%)
> Adult obesity rate: 30.7% (state: 36.7%)
> Median household income: $67,779 (state: $59,318)

South Dakota: Sioux Falls
> Adults in fair or poor health: 9.4% (state: 10.4%)
> Adult smoking rate: 15.5% (state: 19.0%)
> Adult obesity rate: 31.2% (state: 33.4%)
> Median household income: $75,946 (state: $66,143)
[in-text-ad]

Tennessee: Nashville-Davidson-Murfreesboro-Franklin
> Adults in fair or poor health: 13.8% (state: 15.7%)
> Adult smoking rate: 18.5% (state: 19.7%)
> Adult obesity rate: 34.2% (state: 35.8%)
> Median household income: $72,725 (state: $59,695)
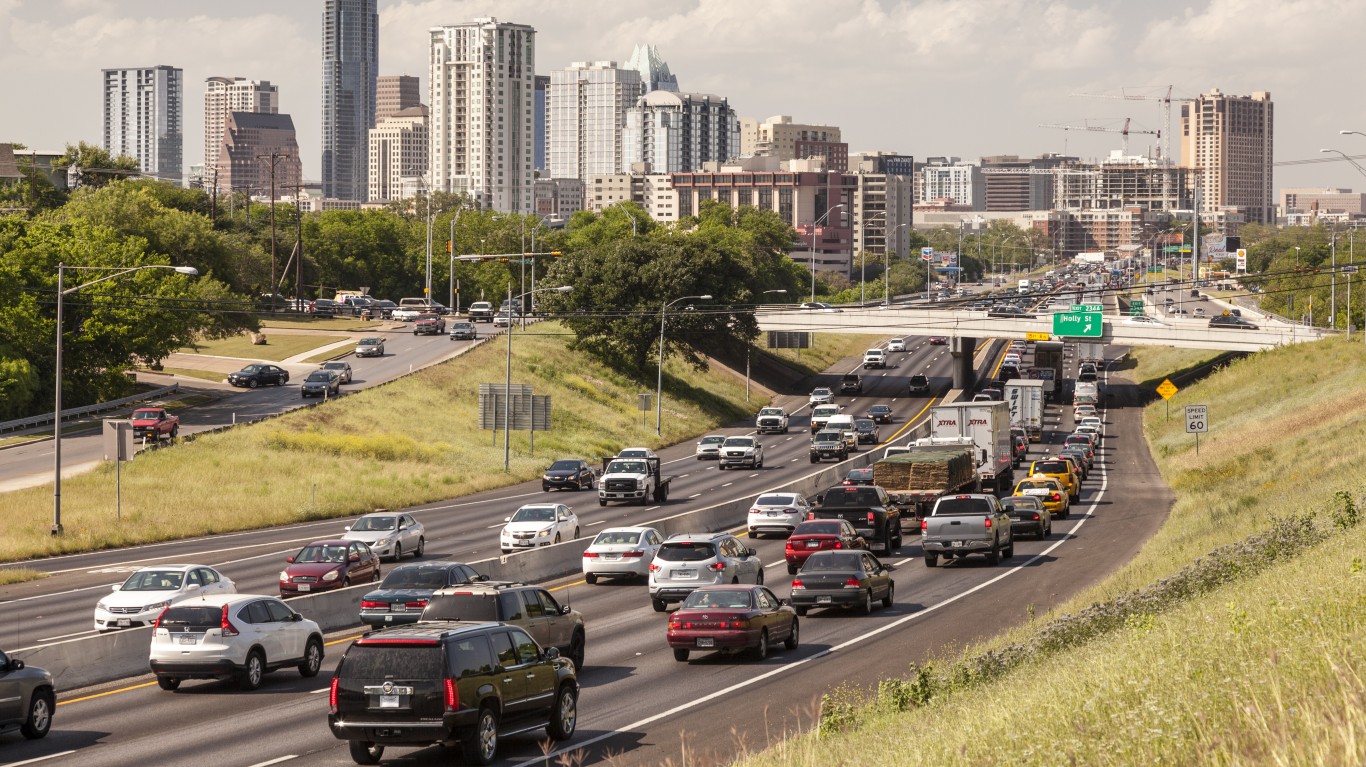
Texas: Austin-Round Rock-Georgetown
> Adults in fair or poor health: 13.2% (state: 15.7%)
> Adult smoking rate: 12.8% (state: 13.3%)
> Adult obesity rate: 30.4% (state: 35.8%)
> Median household income: $86,530 (state: $66,963)

Utah: Provo-Orem
> Adults in fair or poor health: 10.8% (state: 10.9%)
> Adult smoking rate: 6.8% (state: 8.3%)
> Adult obesity rate: 30.1% (state: 29.3%)
> Median household income: $86,629 (state: $79,449)
[in-text-ad-2]

Vermont: Burlington-South Burlington
> Adults in fair or poor health: 9.1% (state: 10.6%)
> Adult smoking rate: 13.0% (state: 14.4%)
> Adult obesity rate: 24.5% (state: 26.3%)
> Median household income: $81,852 (state: $72,431)

Virginia: Charlottesville
> Adults in fair or poor health: 11.8% (state: 12.4%)
> Adult smoking rate: 14.2% (state: 13.9%)
> Adult obesity rate: 30.0% (state: 32.4%)
> Median household income: $78,819 (state: $80,963)
[in-text-ad]
Washington: Seattle-Tacoma-Bellevue
> Adults in fair or poor health: 11.0% (state: 11.8%)
> Adult smoking rate: 11.6% (state: 11.6%)
> Adult obesity rate: 25.6% (state: 28.0%)
> Median household income: $101,721 (state: $84,247)

West Virginia: Morgantown
> Adults in fair or poor health: 16.9% (state: 20.0%)
> Adult smoking rate: 20.1% (state: 24.0%)
> Adult obesity rate: 35.5% (state: 39.6%)
> Median household income: $58,274 (state: $51,248)

Wisconsin: Madison
> Adults in fair or poor health: 9.3% (state: 12.4%)
> Adult smoking rate: 13.3% (state: 16.1%)
> Adult obesity rate: 26.4% (state: 32.7%)
> Median household income: $76,731 (state: $67,125)
[in-text-ad-2]
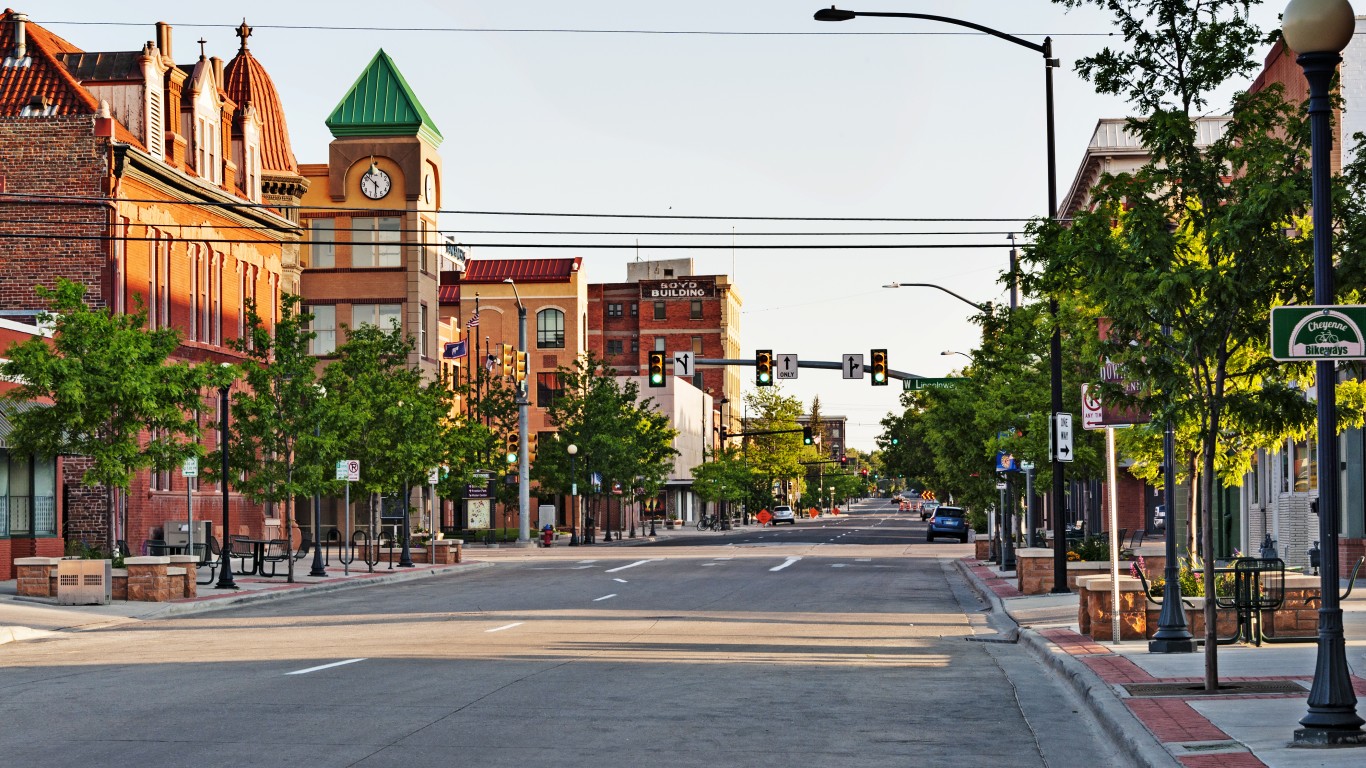
Wyoming: Cheyenne
> Adults in fair or poor health: 10.6% (state: 11.5%)
> Adult smoking rate: 18.2% (state: 19.4%)
> Adult obesity rate: 30.9% (state: 30.6%)
> Median household income: $61,381 (state: $65,204)
Methodology
To determine the healthiest city in every state, 24/7 Tempo reviewed county-level data from the 2023 County Health Rankings & Roadmaps program of the University of Wisconsin Population Health Institute. Metropolitan statistical areas were ranked based on an index consisting of eight health measures, all using data from the CHR.
The measures are: The years of potential life lost before age 75 per 100,000 residents from 2018 to 2020; the percentage of adults reporting fair or poor health in 2020; the average number of physically unhealthy days reported in the last 30 days in 2020; the percentage of live births with low birthweight from 2014 to 2020; the percentage of adults who are current smokers in 2020; the percentage of adults reporting a body mass index of 30 or greater in 2020; the number of preventable hospital stays for ambulatory-care sensitive conditions per 100,000 Medicare enrollees in 2020; and the number of deaths due to injury per 100,000 residents from 2016 to 2020.
All data was aggregated from the county level to the metropolitan level using boundary definitions from the U.S. Census Bureau and was weighted by county population. Supplemental data on median household income is from the Census Bureau’s 2021 American Community Survey and are one-year estimates. Note that four states — Rhode Island, New Hampshire, Vermont, and Delaware — have only one metropolitan area, which is listed here by default.
In 20 Years, I Haven’t Seen A Cash Back Card This Good
After two decades of reviewing financial products I haven’t seen anything like this. Credit card companies are at war, handing out free rewards and benefits to win the best customers.
A good cash back card can be worth thousands of dollars a year in free money, not to mention other perks like travel, insurance, and access to fancy lounges.
Our top pick today pays up to 5% cash back, a $200 bonus on top, and $0 annual fee. Click here to apply before they stop offering rewards this generous.
Flywheel Publishing has partnered with CardRatings for our coverage of credit card products. Flywheel Publishing and CardRatings may receive a commission from card issuers.
Thank you for reading! Have some feedback for us?
Contact the 24/7 Wall St. editorial team.
 24/7 Wall St.


