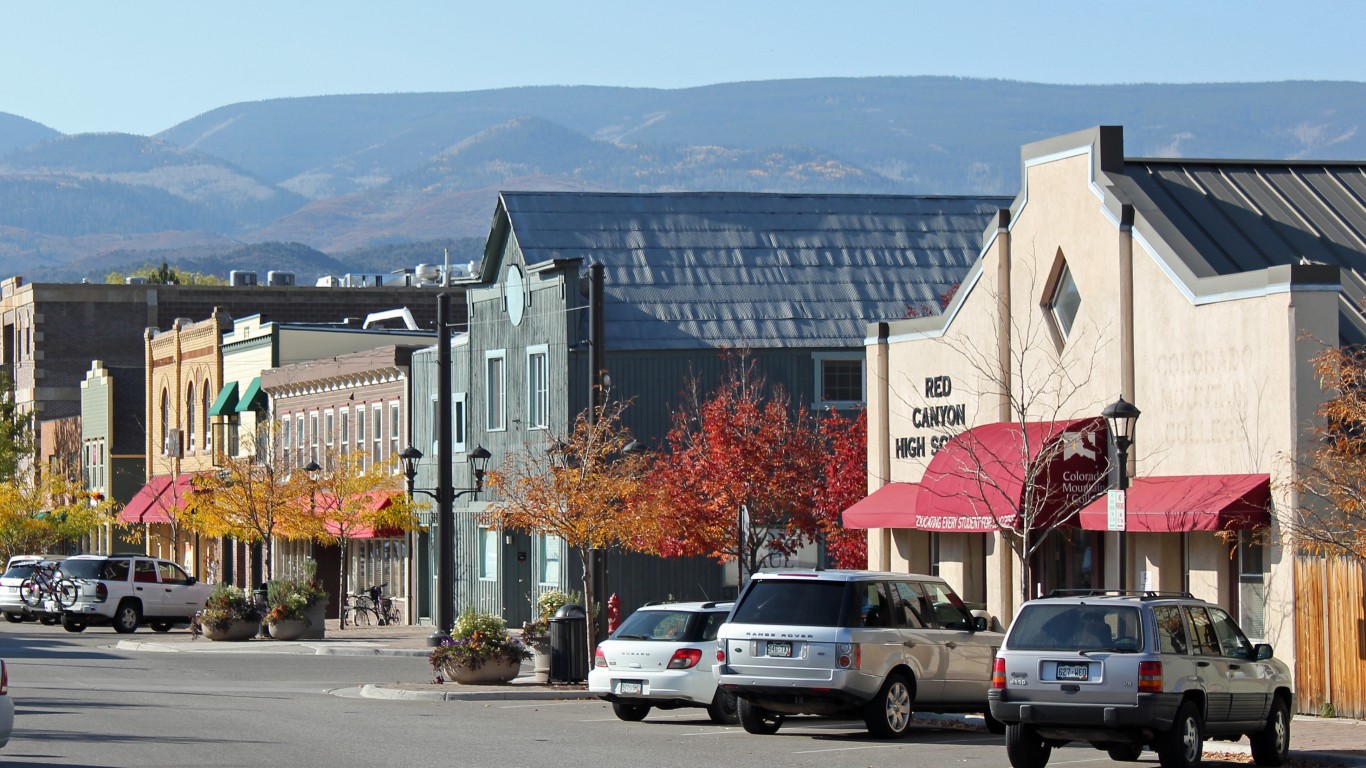
Many of the measures most commonly used to assess a given country’s level of development are strictly economic. They include indicators such as gross domestic product, GDP growth, and GDP per capita. While useful, these measures are also narrow in scope and reveal little about a country’s development or development potential.
To address these shortcomings and provide a more comprehensive measure, the United Nations Development Programme created the Human Development Index. The HDI estimates a country’s development using three dimensions – health, assessed by life expectancy at birth; education, assessed by mean years of schooling; and standard of living, assessed by gross national income per capita. And in the United States, these measures are moving in the wrong direction. (Here is a look at the poorest town in every state.)
According to the Centers for Disease Control and Prevention, average life expectancy at birth in the United States fell by 2.7 years from 2019 to 2021 and now stands at 76.1 years – the lowest it has been since 1996. Additionally, the Brookings Institute recently reported that overall undergraduate enrollment fell by 15% from 2010 to 2021 and has continued to decline in the years since. Meanwhile, the number of Americans living below the poverty line climbed by 7.9% in 2021, the largest single-year increase since the Great Recession of 2008 and 2009.
But while the U.S. as a whole is backsliding, there are parts of the country that stand out for exceptionally high levels of human development.
Using an index inspired by the HDI, 24/7 Wall St. identified the best U.S. counties to live in. Over 3,000 counties and county equivalents were ranked based on a combination of three measures – average life expectancy at birth, the share of adults with a bachelor’s degree, and the poverty rate. To avoid clustering, only one county per metropolitan statistical area was included.
The 40 counties and county equivalents on this list are spread across the country, including five in the Northeast, nine in the Midwest, 11 in the South, and 15 in the West. In each, the share of adults with a bachelor’s degree or higher exceeds the 33.7% national bachelor’s degree attainment rate and life expectancy at birth is at least 2.5 years longer than the national average. Additionally, only two of these places have a higher poverty rate than the 12.6% national rate.
While these three key measures are independent, they are also closely correlated. Americans with a bachelor’s degree are less likely to face serious financial hardship and more likely to have healthier lifestyles and improved health outcomes. Additionally, poverty is associated with negative health outcomes and increased risk of premature mortality. (Here is a look at America’s healthiest cities.)
Click here to see the best counties to live in.
Click here to see our detailed methodology.

40. Oconee County, Georgia
> Poverty rate: 4.7% (#3,101 of 3,142 counties)
> Adults with a bachelor’s degree: 51.6% (#58 of 3,142 counties)
> Life expectancy at birth: 81.6 years (#160 of 3,142 counties)
> Median household income: $106,165 (#47 of 3,142 counties)
> County seat: Watkinsville
[in-text-ad]

39. Wake County, North Carolina
> Poverty rate: 8.5% (#2,688 of 3,142 counties)
> Adults with a bachelor’s degree: 54.7% (#41 of 3,142 counties)
> Life expectancy at birth: 81.8 years (#133 of 3,142 counties)
> Median household income: $88,471 (#152 of 3,142 counties)
> County seat: Raleigh

38. Leelanau County, Michigan
> Poverty rate: 6.4% (#2,974 of 3,142 counties)
> Adults with a bachelor’s degree: 47.3% (#98 of 3,142 counties)
> Life expectancy at birth: 82.6 years (#58 of 3,142 counties)
> Median household income: $72,709 (#426 of 3,142 counties)
> County seat: Suttons Bay

37. Fort Bend County, Texas
> Poverty rate: 7.2% (#2,893 of 3,142 counties)
> Adults with a bachelor’s degree: 48.1% (#91 of 3,142 counties)
> Life expectancy at birth: 82.6 years (#57 of 3,142 counties)
> Median household income: $102,590 (#55 of 3,142 counties)
> County seat: Richmond
[in-text-ad-2]

36. Nantucket County, Massachusetts
> Poverty rate: 6.0% (#3,014 of 3,142 counties)
> Adults with a bachelor’s degree: 50.7% (#66 of 3,142 counties)
> Life expectancy at birth: 82.1 years (#95 of 3,142 counties)
> Median household income: $116,571 (#21 of 3,142 counties)
> County seat: Nantucket
35. Gunnison County, Colorado
> Poverty rate: 13.0% (#1,691 of 3,142 counties)
> Adults with a bachelor’s degree: 56.7% (#29 of 3,142 counties)
> Life expectancy at birth: 82.5 years (#66 of 3,142 counties)
> Median household income: $63,341 (#906 of 3,142 counties)
> County seat: Gunnison
[in-text-ad]

34. Chester County, Pennsylvania
> Poverty rate: 6.1% (#3,010 of 3,142 counties)
> Adults with a bachelor’s degree: 55.2% (#39 of 3,142 counties)
> Life expectancy at birth: 81.5 years (#162 of 3,142 counties)
> Median household income: $109,969 (#38 of 3,142 counties)
> County seat: West Chester

33. King County, Washington
> Poverty rate: 8.4% (#2,699 of 3,142 counties)
> Adults with a bachelor’s degree: 54.0% (#46 of 3,142 counties)
> Life expectancy at birth: 82.1 years (#89 of 3,142 counties)
> Median household income: $106,326 (#46 of 3,142 counties)
> County seat: Seattle
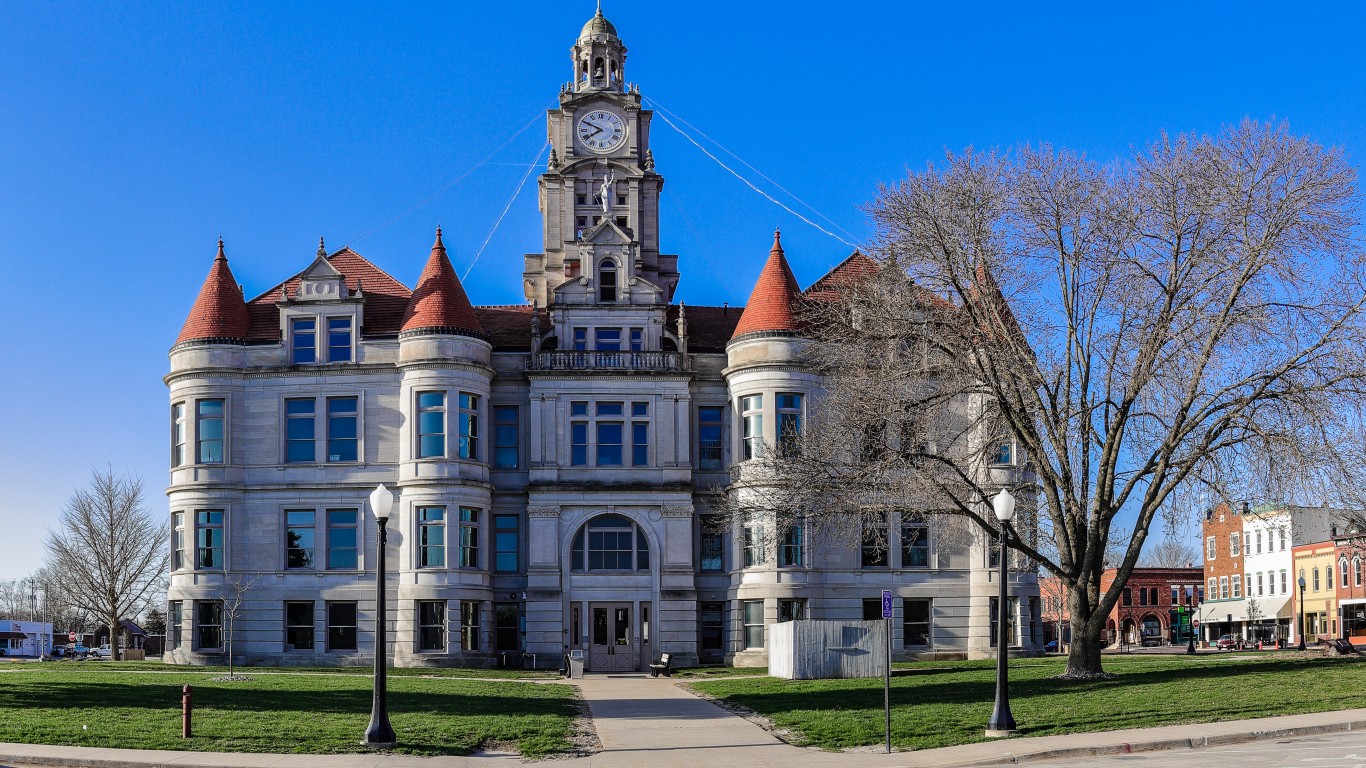
32. Dallas County, Iowa
> Poverty rate: 5.7% (#3,034 of 3,142 counties)
> Adults with a bachelor’s degree: 50.4% (#73 of 3,142 counties)
> Life expectancy at birth: 82.3 years (#77 of 3,142 counties)
> Median household income: $93,492 (#111 of 3,142 counties)
> County seat: Adel
[in-text-ad-2]
31. Ozaukee County, Wisconsin
> Poverty rate: 4.0% (#3,123 of 3,142 counties)
> Adults with a bachelor’s degree: 50.4% (#71 of 3,142 counties)
> Life expectancy at birth: 82.0 years (#106 of 3,142 counties)
> Median household income: $86,915 (#168 of 3,142 counties)
> County seat: Port Washington

30. Lincoln County, South Dakota
> Poverty rate: 4.7% (#3,099 of 3,142 counties)
> Adults with a bachelor’s degree: 41.3% (#193 of 3,142 counties)
> Life expectancy at birth: 83.6 years (#30 of 3,142 counties)
> Median household income: $87,560 (#161 of 3,142 counties)
> County seat: Canton
[in-text-ad]

29. Fairfield County, Connecticut
> Poverty rate: 9.2% (#2,569 of 3,142 counties)
> Adults with a bachelor’s degree: 49.2% (#82 of 3,142 counties)
> Life expectancy at birth: 83.2 years (#35 of 3,142 counties)
> Median household income: $101,194 (#64 of 3,142 counties)
> County seat: Bridgeport

28. Collier County, Florida
> Poverty rate: 10.6% (#2,245 of 3,142 counties)
> Adults with a bachelor’s degree: 37.9% (#272 of 3,142 counties)
> Life expectancy at birth: 85.3 years (#13 of 3,142 counties)
> Median household income: $75,543 (#348 of 3,142 counties)
> County seat: East Naples
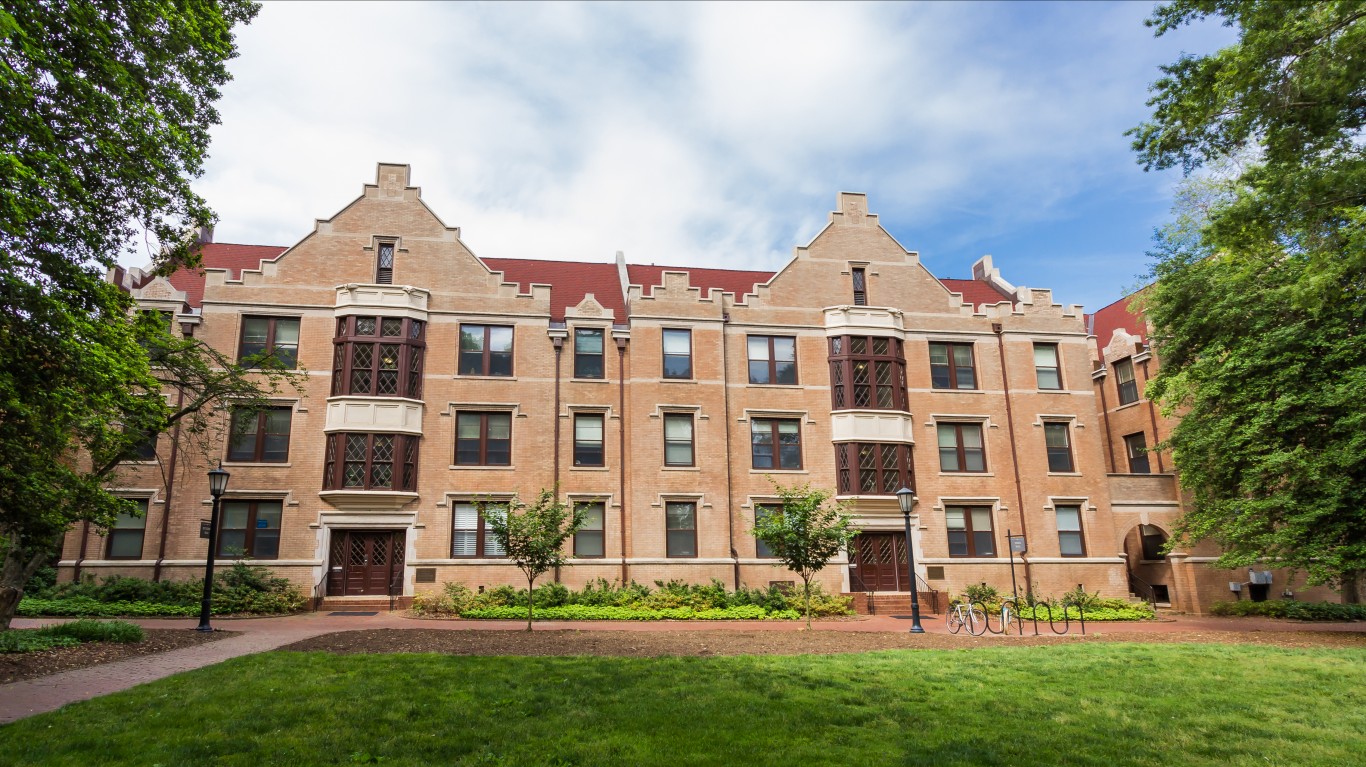
27. Orange County, North Carolina
> Poverty rate: 12.6% (#1,776 of 3,142 counties)
> Adults with a bachelor’s degree: 61.3% (#14 of 3,142 counties)
> Life expectancy at birth: 82.1 years (#94 of 3,142 counties)
> Median household income: $79,205 (#261 of 3,142 counties)
> County seat: Hillsborough
[in-text-ad-2]

26. Johnson County, Kansas
> Poverty rate: 5.1% (#3,067 of 3,142 counties)
> Adults with a bachelor’s degree: 56.3% (#30 of 3,142 counties)
> Life expectancy at birth: 81.7 years (#147 of 3,142 counties)
> Median household income: $96,059 (#88 of 3,142 counties)
> County seat: Olathe

25. DuPage County, Illinois
> Poverty rate: 6.1% (#3,004 of 3,142 counties)
> Adults with a bachelor’s degree: 50.7% (#68 of 3,142 counties)
> Life expectancy at birth: 82.7 years (#54 of 3,142 counties)
> Median household income: $100,292 (#68 of 3,142 counties)
> County seat: Wheaton
[in-text-ad]

24. Collin County, Texas
> Poverty rate: 6.5% (#2,968 of 3,142 counties)
> Adults with a bachelor’s degree: 53.4% (#48 of 3,142 counties)
> Life expectancy at birth: 82.4 years (#74 of 3,142 counties)
> Median household income: $104,327 (#53 of 3,142 counties)
> County seat: McKinney

23. Middlesex County, Massachusetts
> Poverty rate: 7.4% (#2,847 of 3,142 counties)
> Adults with a bachelor’s degree: 57.8% (#26 of 3,142 counties)
> Life expectancy at birth: 81.9 years (#113 of 3,142 counties)
> Median household income: $111,790 (#31 of 3,142 counties)
> County seat: Lowell

22. Routt County, Colorado
> Poverty rate: 8.6% (#2,664 of 3,142 counties)
> Adults with a bachelor’s degree: 50.8% (#63 of 3,142 counties)
> Life expectancy at birth: 83.3 years (#34 of 3,142 counties)
> Median household income: $83,725 (#205 of 3,142 counties)
> County seat: Steamboat Springs
[in-text-ad-2]

21. Albemarle County, Virginia
> Poverty rate: 6.9% (#2,927 of 3,142 counties)
> Adults with a bachelor’s degree: 58.9% (#22 of 3,142 counties)
> Life expectancy at birth: 81.9 years (#123 of 3,142 counties)
> Median household income: $90,568 (#133 of 3,142 counties)
> County seat: Charlottesville
20. Carver County, Minnesota
> Poverty rate: 3.8% (#3,128 of 3,142 counties)
> Adults with a bachelor’s degree: 49.7% (#77 of 3,142 counties)
> Life expectancy at birth: 82.8 years (#49 of 3,142 counties)
> Median household income: $107,890 (#43 of 3,142 counties)
> County seat: Chaska
[in-text-ad]
19. Forsyth County, Georgia
> Poverty rate: 5.3% (#3,060 of 3,142 counties)
> Adults with a bachelor’s degree: 55.9% (#34 of 3,142 counties)
> Life expectancy at birth: 82.2 years (#79 of 3,142 counties)
> Median household income: $120,999 (#16 of 3,142 counties)
> County seat: Cumming

18. Delaware County, Ohio
> Poverty rate: 4.6% (#3,104 of 3,142 counties)
> Adults with a bachelor’s degree: 57.1% (#28 of 3,142 counties)
> Life expectancy at birth: 82.1 years (#96 of 3,142 counties)
> Median household income: $116,284 (#24 of 3,142 counties)
> County seat: Delaware

17. Ouray County, Colorado
> Poverty rate: 4.4% (#3,113 of 3,142 counties)
> Adults with a bachelor’s degree: 46.2% (#112 of 3,142 counties)
> Life expectancy at birth: 84.0 years (#22 of 3,142 counties)
> Median household income: $67,228 (#658 of 3,142 counties)
> County seat: Ouray
[in-text-ad-2]

16. San Juan County, Washington
> Poverty rate: 10.9% (#2,176 of 3,142 counties)
> Adults with a bachelor’s degree: 51.3% (#59 of 3,142 counties)
> Life expectancy at birth: 84.4 years (#19 of 3,142 counties)
> Median household income: $68,577 (#590 of 3,142 counties)
> County seat: Friday Harbor

15. Hamilton County, Indiana
> Poverty rate: 4.0% (#3,124 of 3,142 counties)
> Adults with a bachelor’s degree: 60.5% (#15 of 3,142 counties)
> Life expectancy at birth: 81.9 years (#121 of 3,142 counties)
> Median household income: $104,858 (#51 of 3,142 counties)
> County seat: Noblesville
[in-text-ad]
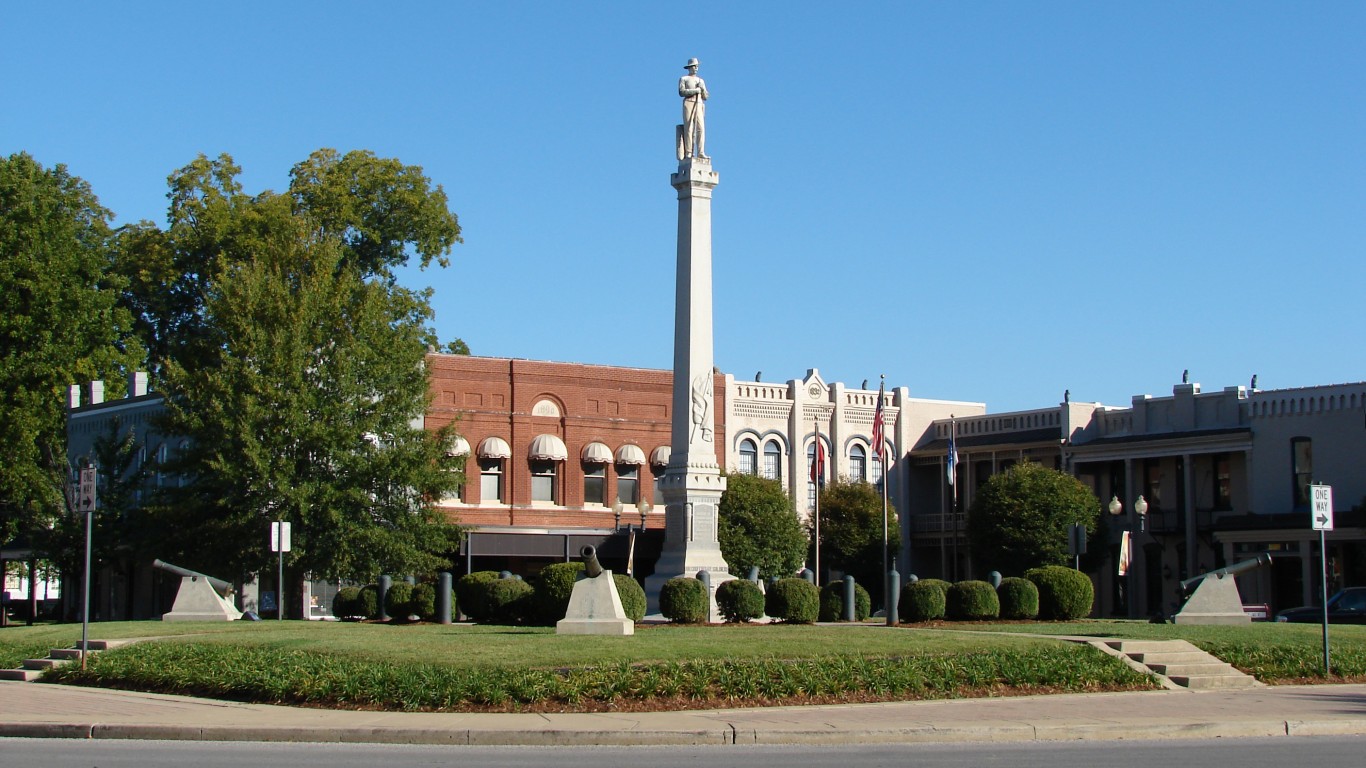
14. Williamson County, Tennessee
> Poverty rate: 3.9% (#3,126 of 3,142 counties)
> Adults with a bachelor’s degree: 61.9% (#11 of 3,142 counties)
> Life expectancy at birth: 81.7 years (#146 of 3,142 counties)
> Median household income: $116,492 (#22 of 3,142 counties)
> County seat: Franklin

13. Summit County, Utah
> Poverty rate: 5.3% (#3,061 of 3,142 counties)
> Adults with a bachelor’s degree: 55.2% (#40 of 3,142 counties)
> Life expectancy at birth: 83.6 years (#31 of 3,142 counties)
> Median household income: $116,351 (#23 of 3,142 counties)
> County seat: Coalville

12. Howard County, Maryland
> Poverty rate: 5.5% (#3,046 of 3,142 counties)
> Adults with a bachelor’s degree: 63.6% (#5 of 3,142 counties)
> Life expectancy at birth: 83.0 years (#41 of 3,142 counties)
> Median household income: $129,549 (#7 of 3,142 counties)
> County seat: Ellicott City
[in-text-ad-2]

11. Santa Clara County, California
> Poverty rate: 6.7% (#2,950 of 3,142 counties)
> Adults with a bachelor’s degree: 54.4% (#42 of 3,142 counties)
> Life expectancy at birth: 84.6 years (#17 of 3,142 counties)
> Median household income: $140,258 (#3 of 3,142 counties)
> County seat: San Jose

10. Douglas County, Colorado
> Poverty rate: 3.0% (#3,134 of 3,142 counties)
> Adults with a bachelor’s degree: 59.2% (#21 of 3,142 counties)
> Life expectancy at birth: 83.4 years (#33 of 3,142 counties)
> Median household income: $127,443 (#9 of 3,142 counties)
> County seat: Castle Rock
[in-text-ad]

9. New York County, New York
> Poverty rate: 15.6% (#1,124 of 3,142 counties)
> Adults with a bachelor’s degree: 62.6% (#9 of 3,142 counties)
> Life expectancy at birth: 85.1 years (#15 of 3,142 counties)
> Median household income: $93,956 (#104 of 3,142 counties)
> County seat: Manhattan

8. Marin County, California
> Poverty rate: 6.9% (#2,919 of 3,142 counties)
> Adults with a bachelor’s degree: 60.1% (#17 of 3,142 counties)
> Life expectancy at birth: 85.3 years (#10 of 3,142 counties)
> Median household income: $131,008 (#6 of 3,142 counties)
> County seat: San Rafael

7. Teton County, Wyoming
> Poverty rate: 7.1% (#2,896 of 3,142 counties)
> Adults with a bachelor’s degree: 57.9% (#24 of 3,142 counties)
> Life expectancy at birth: 85.9 years (#5 of 3,142 counties)
> Median household income: $94,498 (#99 of 3,142 counties)
> County seat: Jackson
[in-text-ad-2]

6. Los Alamos County, New Mexico
> Poverty rate: 4.2% (#3,120 of 3,142 counties)
> Adults with a bachelor’s degree: 68.5% (#3 of 3,142 counties)
> Life expectancy at birth: 83.9 years (#25 of 3,142 counties)
> Median household income: $123,677 (#13 of 3,142 counties)
> County seat: Los Alamos

5. San Miguel County, Colorado
> Poverty rate: 9.4% (#2,530 of 3,142 counties)
> Adults with a bachelor’s degree: 59.9% (#18 of 3,142 counties)
> Life expectancy at birth: 86.2 years (#4 of 3,142 counties)
> Median household income: $70,965 (#490 of 3,142 counties)
> County seat: Telluride
[in-text-ad]
4. Eagle County, Colorado
> Poverty rate: 9.2% (#2,567 of 3,142 counties)
> Adults with a bachelor’s degree: 50.9% (#62 of 3,142 counties)
> Life expectancy at birth: 88.5 years (#3 of 3,142 counties)
> Median household income: $91,338 (#125 of 3,142 counties)
> County seat: Eagle

3. Arlington County, Virginia
> Poverty rate: 6.5% (#2,971 of 3,142 counties)
> Adults with a bachelor’s degree: 76.3% (#2 of 3,142 counties)
> Life expectancy at birth: 85.5 years (#9 of 3,142 counties)
> Median household income: $128,145 (#8 of 3,142 counties)
> County seat: Arlington

2. Summit County, Colorado
> Poverty rate: 6.8% (#2,937 of 3,142 counties)
> Adults with a bachelor’s degree: 52.8% (#51 of 3,142 counties)
> Life expectancy at birth: 91.7 years (#1 of 3,142 counties)
> Median household income: $93,505 (#110 of 3,142 counties)
> County seat: Breckenridge
[in-text-ad-2]

1. Pitkin County, Colorado
> Poverty rate: 5.2% (#3,063 of 3,142 counties)
> Adults with a bachelor’s degree: 62.3% (#10 of 3,142 counties)
> Life expectancy at birth: 91.3 years (#2 of 3,142 counties)
> Median household income: $92,708 (#116 of 3,142 counties)
> County seat: Aspen
Methodology
To determine the best U.S. counties to live in, 24/7 Wall St. constructed an index of three measures: poverty, bachelor’s degree attainment among adults, and average life expectancy at birth. The selection of these three measures was inspired by the United Nations’ Human Development Index. Over 3,000 counties and county equivalents were ranked based on the index. To avoid clustering, only one county per metropolitan statistical area was included.
Data on the share of individuals living below the poverty line as well as the share of adults 25 and older with at least a bachelor’s degree came from the 2021 U.S. Census Bureau’s American Community Survey and are five-year estimates. Supplemental data on median household income also came from the ACS.
Data on average life expectancy at birth came from the Institute for Health Metrics and Evaluation of the University of Washington and are for 2019.
Get Ready To Retire (Sponsored)
Start by taking a quick retirement quiz from SmartAsset that will match you with up to 3 financial advisors that serve your area and beyond in 5 minutes, or less.
Each advisor has been vetted by SmartAsset and is held to a fiduciary standard to act in your best interests.
Here’s how it works:
1. Answer SmartAsset advisor match quiz
2. Review your pre-screened matches at your leisure. Check out the advisors’ profiles.
3. Speak with advisors at no cost to you. Have an introductory call on the phone or introduction in person and choose whom to work with in the future
Thank you for reading! Have some feedback for us?
Contact the 24/7 Wall St. editorial team.
 24/7 Wall St.
 24/7 Wall St.

