Special Report
This is the Least Dependable Car Brand in America
Published:
Last Updated:

The global auto industry has been through a hectic few years, struggling with supply chain issues as a result of the COVID-19 pandemic. But as those issues have finally begun to resolve, it appears that global demand for cars has begun to decline. To stay competitive in the age of the internet, where bad news and bad reviews spread like wildfire, automakers must make cars that both appeal to consumer tastes and importantly are as close to flawless as possible.
One widely-cited measure of vehicle quality is the annual U.S. Vehicle Dependability Study, produced by market research company J.D. Power. 24/7 Wall St. reviewed the findings of the 2023 edition of the study, a survey that followed the owners of 2020 edition vehicles over three years.
The study measures the number of problems per 100 vehicles reported during the previous 12 months by original owners of three-year-old vehicles. Problems fell into one of nine categories: climate, driving assistance, driving experience, exterior, features/controls/displays, infotainment, interior, powertrain, and seats. All 32 brands with data are ranked from the most reliable (those with the fewest reported problems per 100 vehicles) to the least reliable (those with the most problems per 100 vehicles). (These are the deadliest cars in America.)
Lexus, the most reliable brand, had 133 reported problems per 100 vehicles, just over half of the problems of the worst-performing car brand. Lexus is a luxury brand, but while one might make an assumption that higher-priced brands generally perform better in this survey compared to mass-market vehicles, the opposite is true. The average across the auto industry is 186 problems per 100 vehicles, or PP100. Mass-market brands had 182 PP100, while luxury brands had 205 PP100.
One explanation for the counterintuitive outcome for Luxury brands may be related to the way car manufacturers introduce cutting-edge technology. Frank Hanley, senior director of auto benchmarking at J.D. Power explained, “It is typical in the automotive industry to roll out concepts and features by putting them in premium vehicles first…” (These are America’s least reliable cars.)
Comparing the results among the automakers from year to year, brands fluctuate in the rankings. Lexus ranked sixth best last year, with Kia taking first place overall. Ram, which ranked second worst last year, with 266 PP100 compared to the 2022 industry average of 192 PP100, moved to a more respectable 17th best this year, with 189 PP100 in 2023.
The fact that some brands have improved further cements the difficult position Land Rover, this year’s least dependable car brand (273 PP100), finds itself in. Land Rover has been the worst-ranked brand every year since 2020, and was second worst in both 2019 and 2018.
Click here to see the best and worst-built cars in America.
1. Lexus
> Problems per 100 vehicles (2023): 133 (industry avg: 186)
> Problems per 100 vehicles (2022): 159 — # 6 best out of 32 (industry avg: 192)
> Parent company: Toyota Motor Corp.
[in-text-ad]
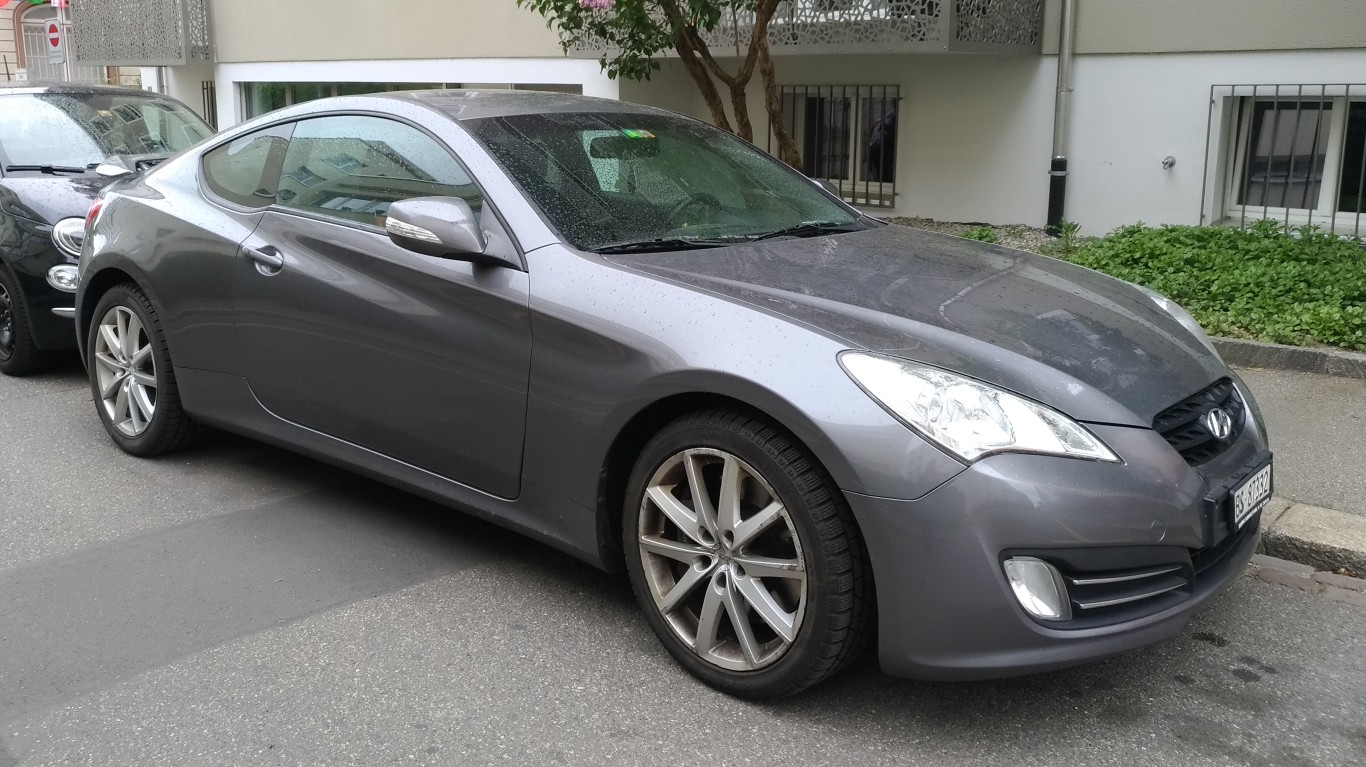
2. Genesis
> Problems per 100 vehicles (2023): 144 (industry avg: 186)
> Problems per 100 vehicles (2022): 155 — # 4 best out of 32 (industry avg: 192)
> Parent company: Hyundai Motor Group
3. Kia
> Problems per 100 vehicles (2023): 152 (industry avg: 186)
> Problems per 100 vehicles (2022): 145 — # 1 best out of 32 (industry avg: 192)
> Parent company: Hyundai Motor Group
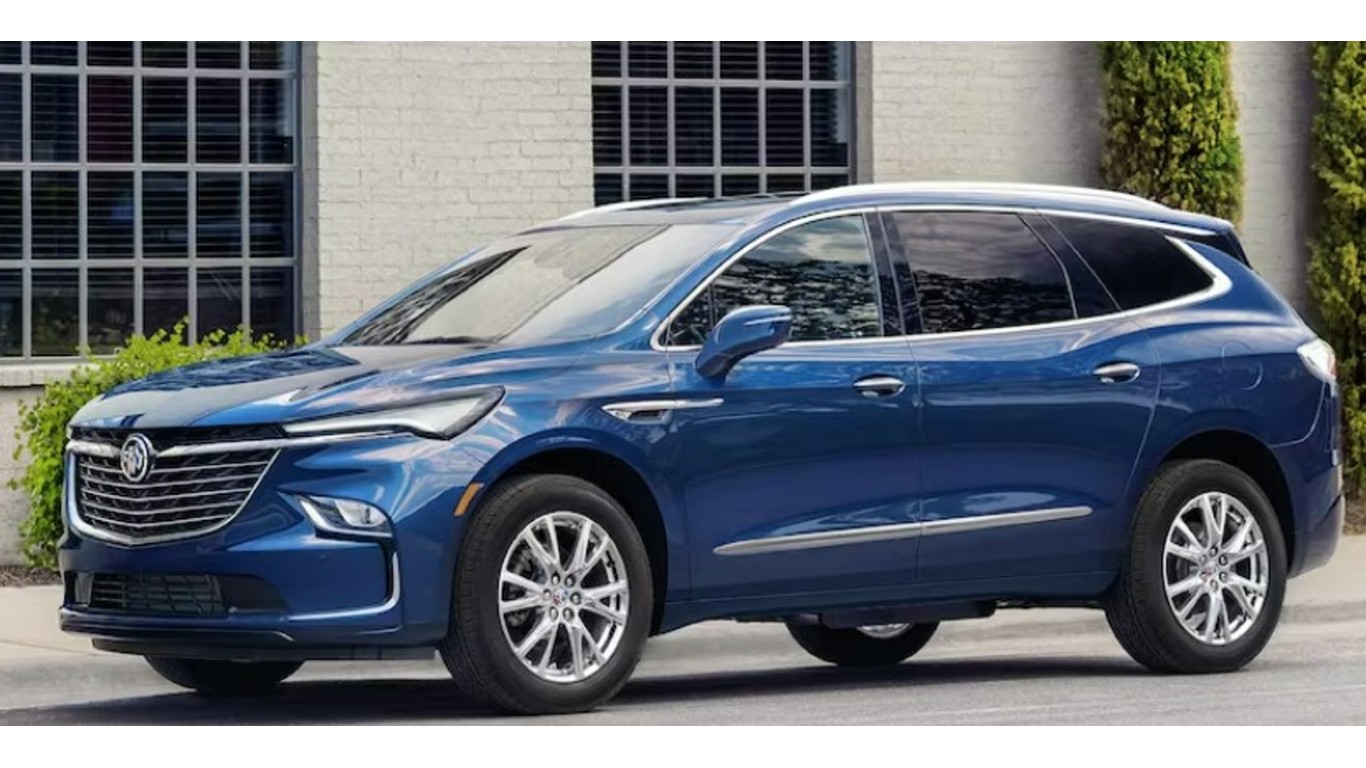
4. Buick
> Problems per 100 vehicles (2023): 159 (industry avg: 186)
> Problems per 100 vehicles (2022): 147 — # 2 best out of 32 (industry avg: 192)
> Parent company: General Motors
[in-text-ad-2]
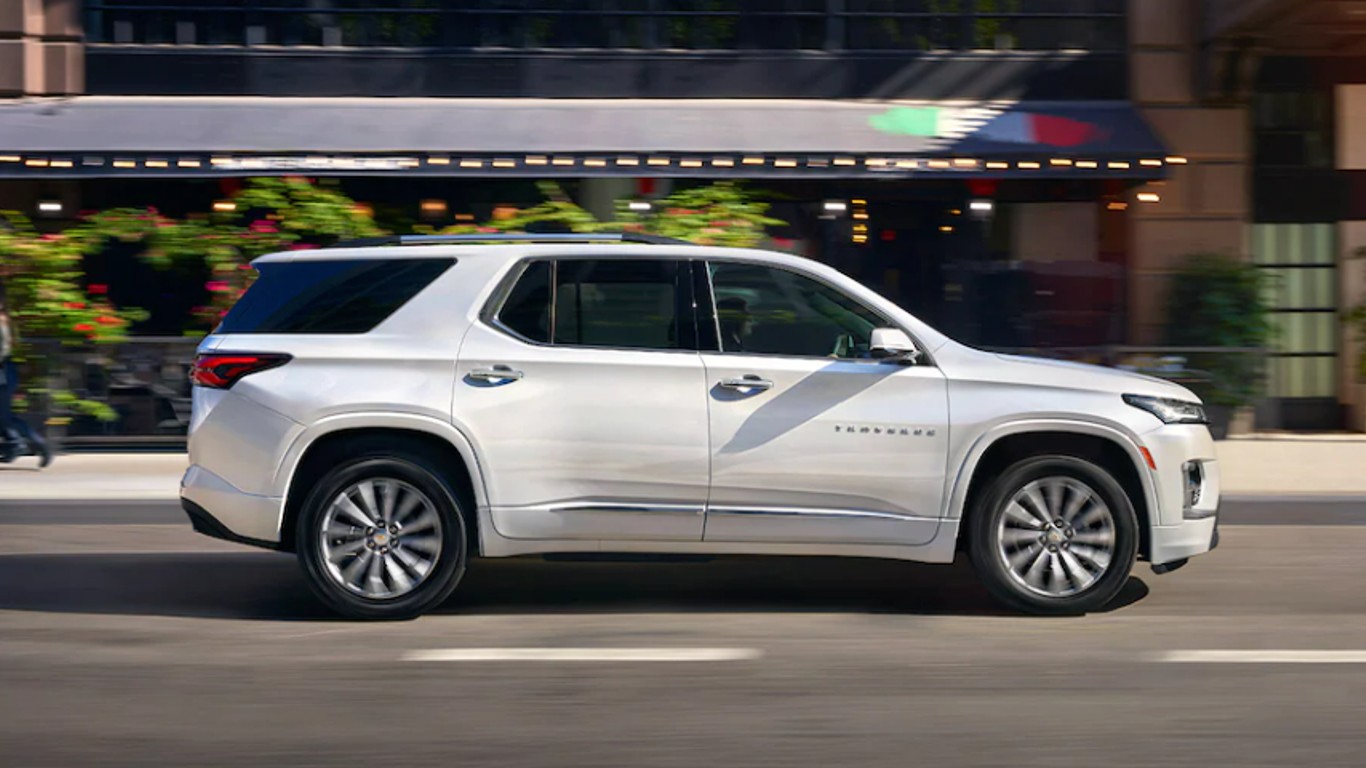
5. Chevrolet
> Problems per 100 vehicles (2023): 162 (industry avg: 186)
> Problems per 100 vehicles (2022): 171 — # 10 best out of 32 (industry avg: 192)
> Parent company: General Motors
6. Mitsubishi
> Problems per 100 vehicles (2023): 167 (industry avg: 186)
> Problems per 100 vehicles (2022): 183 — # 14 best out of 32 (industry avg: 192)
> Parent company: Renault-Nissan-Mitsubishi Alliance
[in-text-ad]
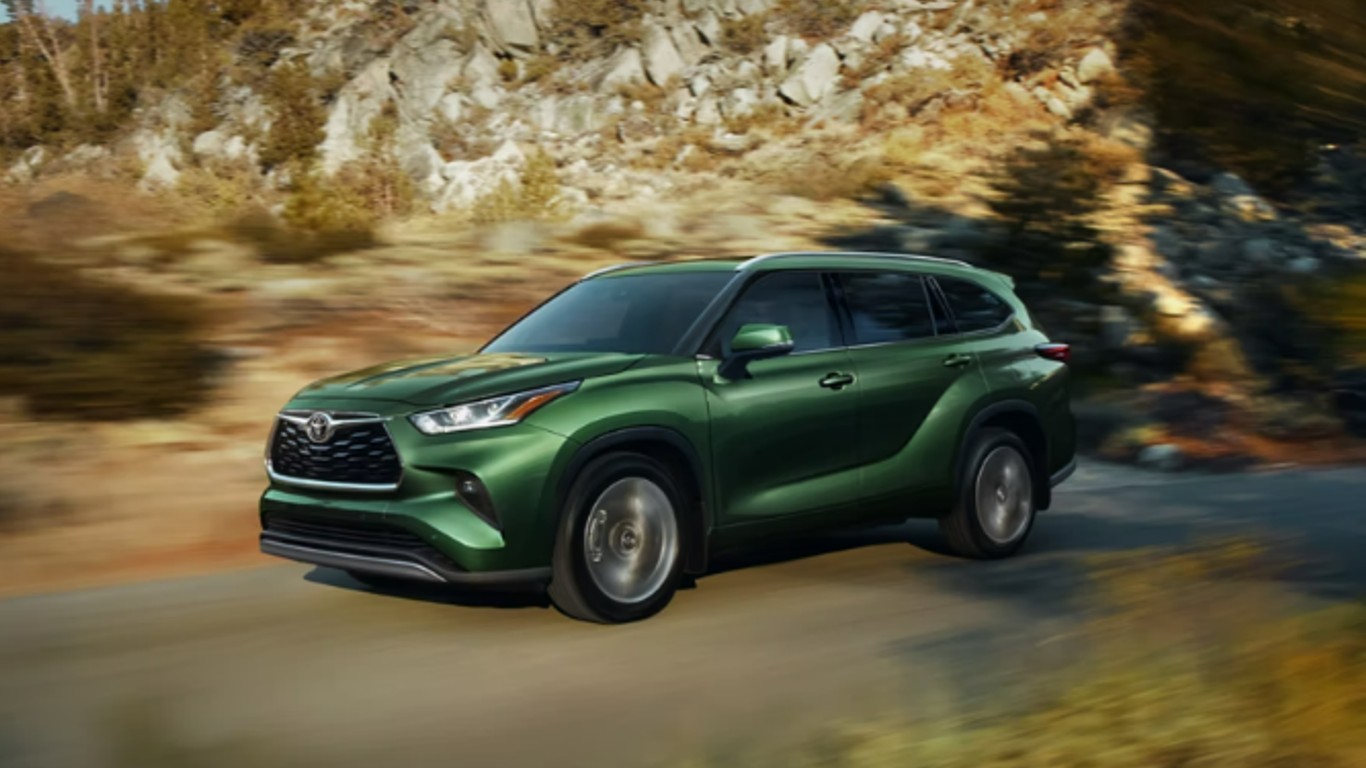
7. Toyota
> Problems per 100 vehicles (2023): 168 (industry avg: 186)
> Problems per 100 vehicles (2022): 158 — # 5 best out of 32 (industry avg: 192)
> Parent company: Toyota Motor Corp.
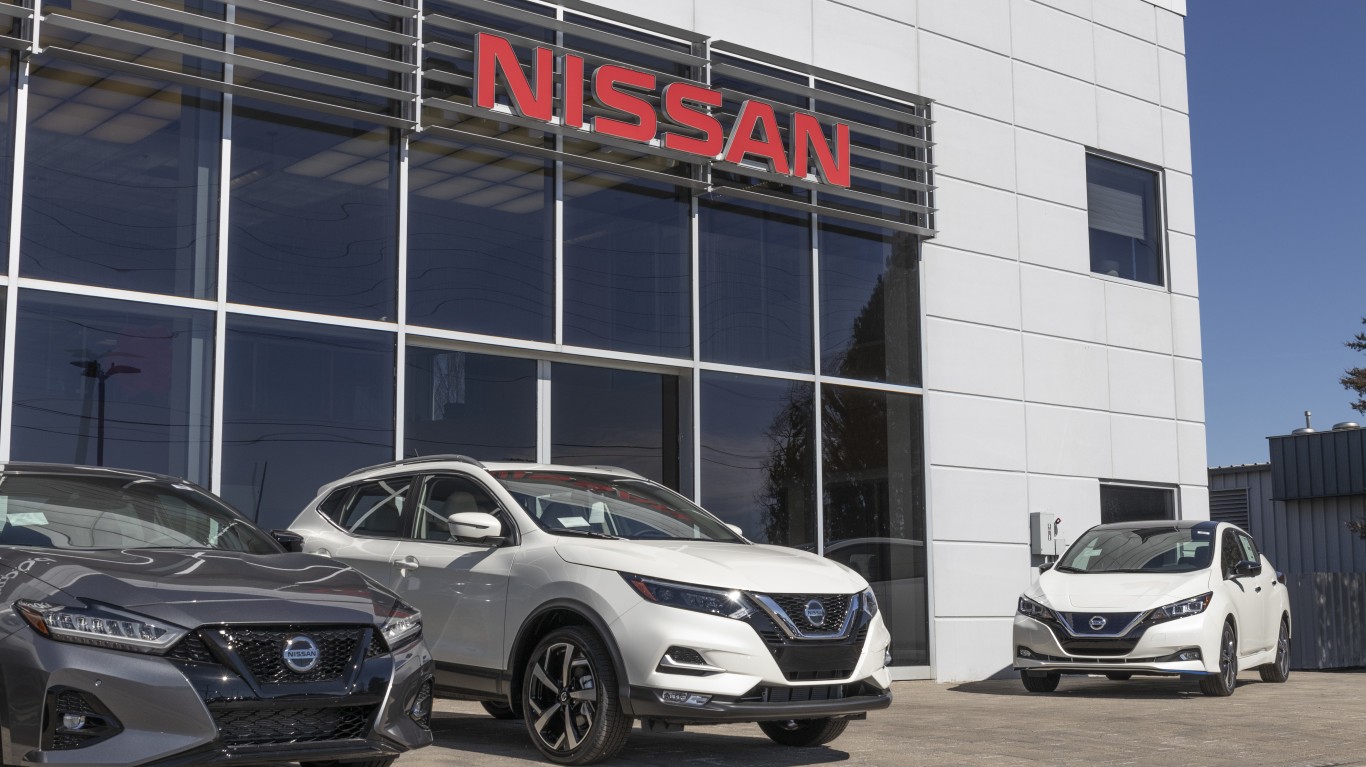
8. Nissan
> Problems per 100 vehicles (2023): 170– tied (industry avg: 186)
> Problems per 100 vehicles (2022): 205 — # 20 best out of 32 (industry avg: 192)
> Parent company: Renault-Nissan-Mitsubishi Alliance
9. MINI
> Problems per 100 vehicles (2023): 170– tied (industry avg: 186)
> Problems per 100 vehicles (2022): 173 — # 11 best out of 32 (industry avg: 192)
> Parent company: BMW Group
[in-text-ad-2]
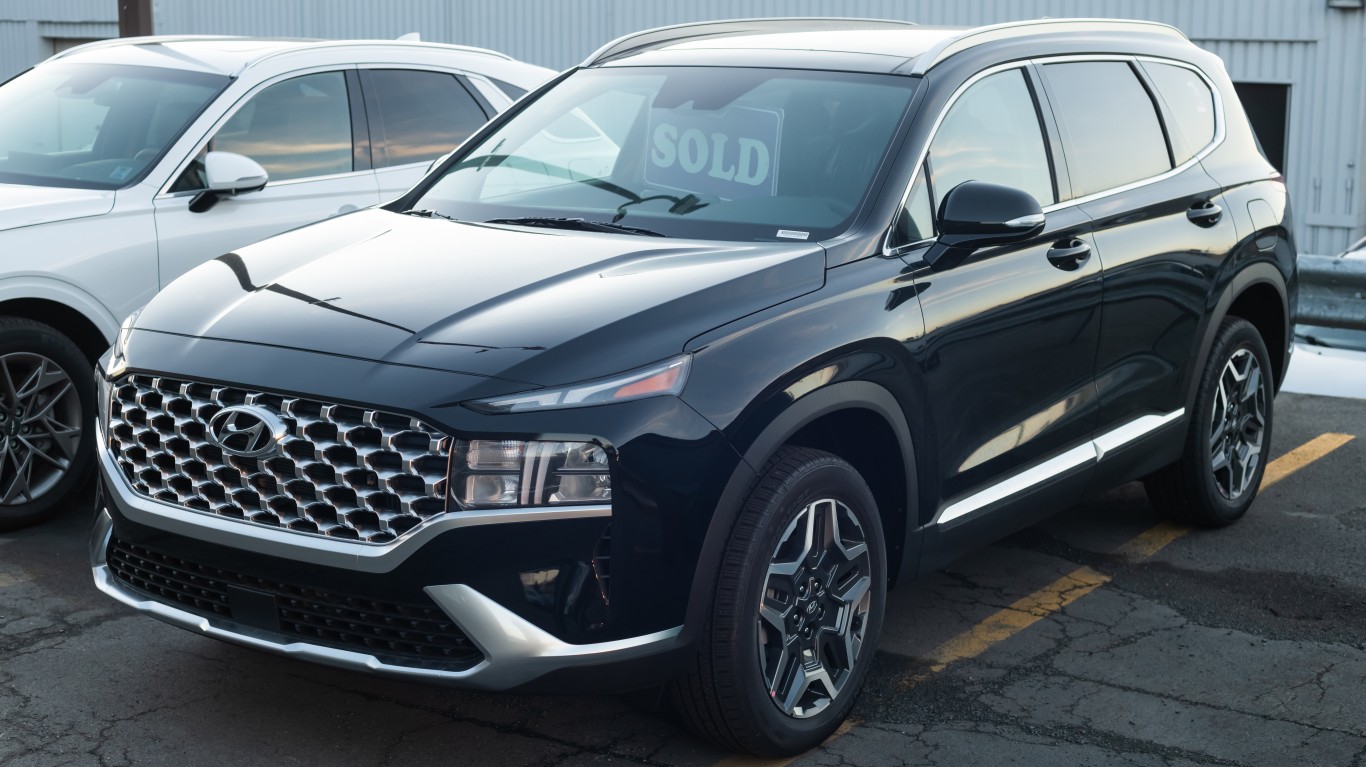
10. Hyundai
> Problems per 100 vehicles (2023): 170– tied (industry avg: 186)
> Problems per 100 vehicles (2022): 148 — # 3 best out of 32 (industry avg: 192)
> Parent company: Hyundai Motor Group
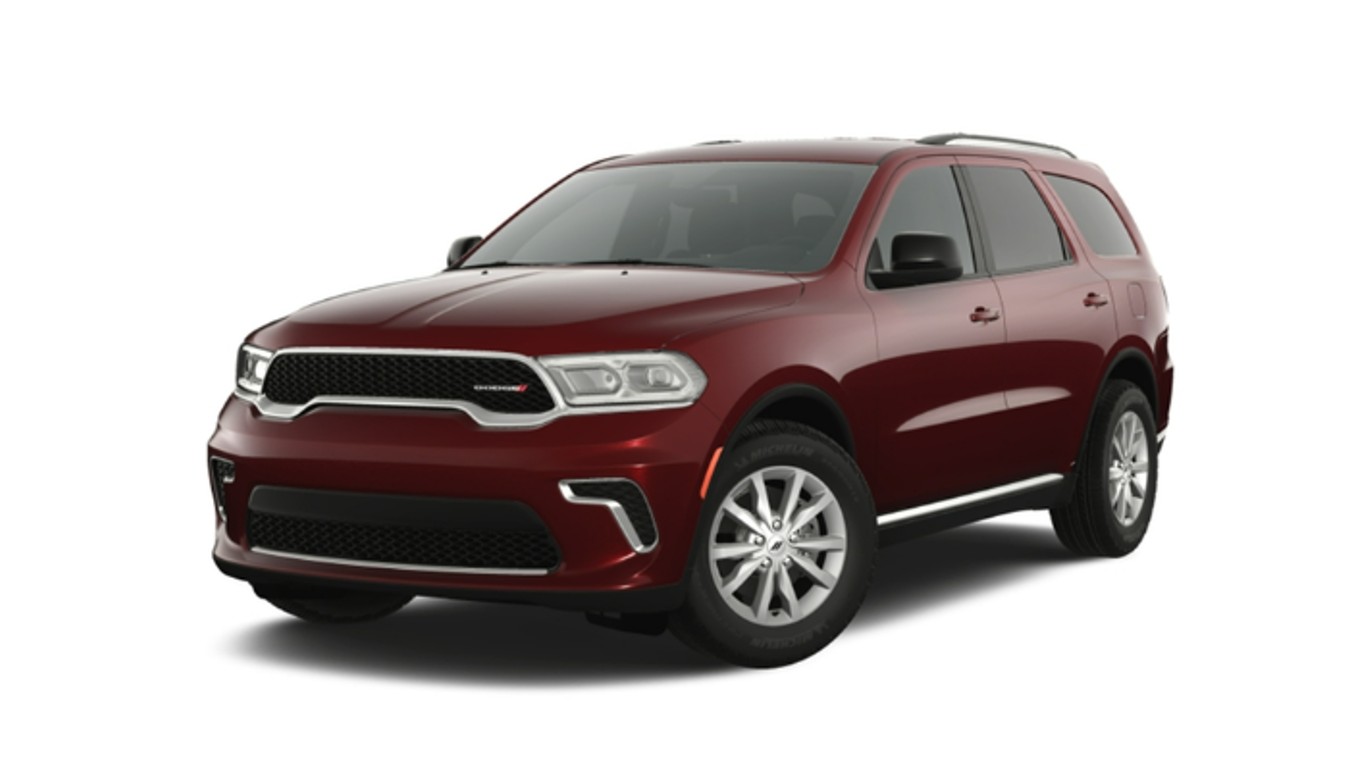
11. Dodge
> Problems per 100 vehicles (2023): 172 (industry avg: 186)
> Problems per 100 vehicles (2022): 166 — # 8 best out of 32 (industry avg: 192)
> Parent company: Stellantis
[in-text-ad]
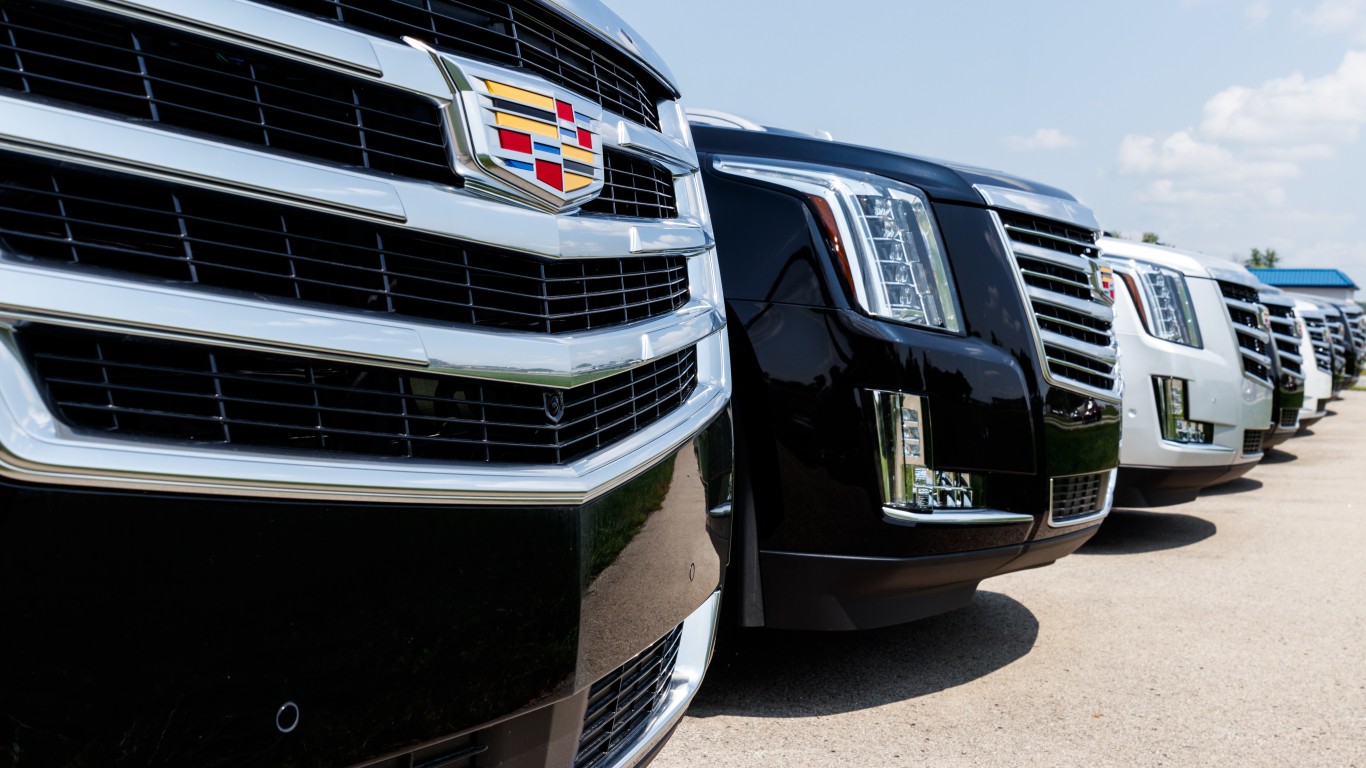
12. Cadillac
> Problems per 100 vehicles (2023): 173 (industry avg: 186)
> Problems per 100 vehicles (2022): 168 — # 9 best out of 32 (industry avg: 192)
> Parent company: General Motors
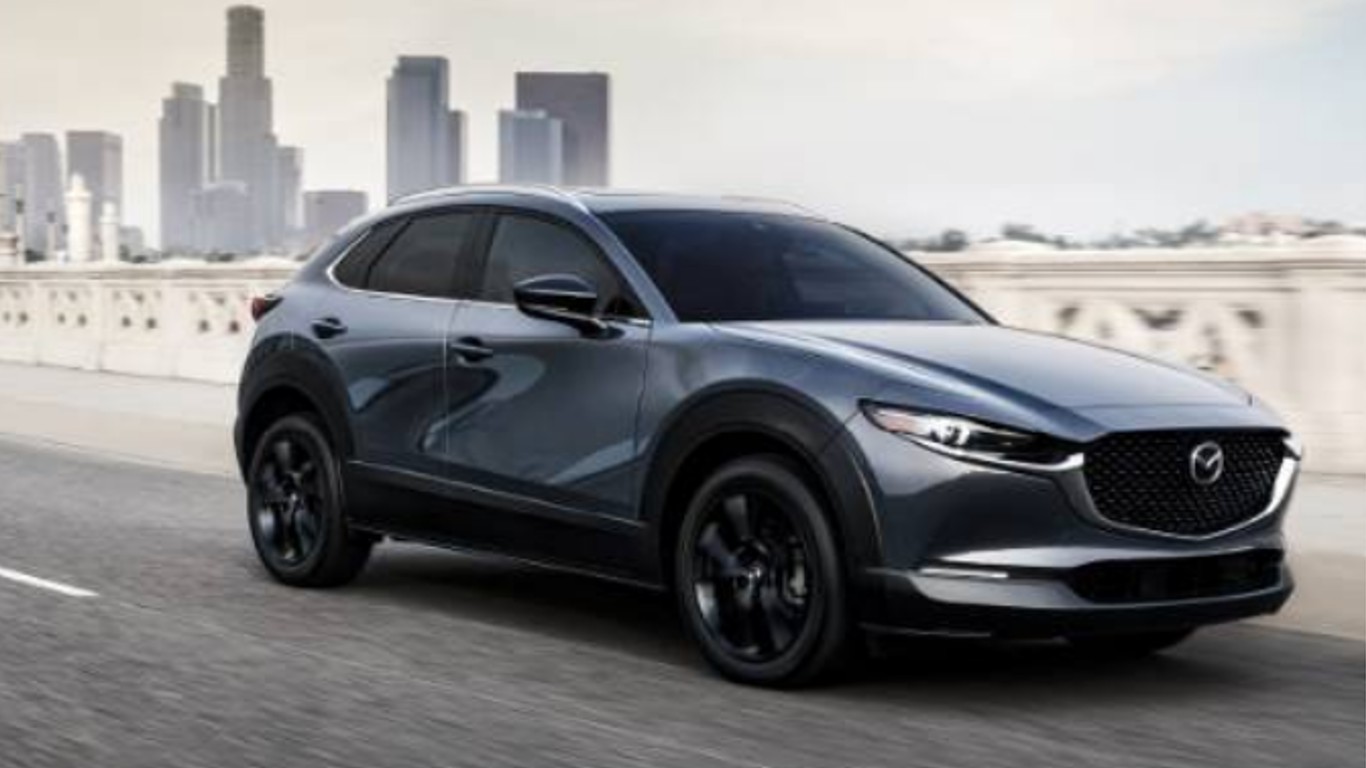
13. Mazda
> Problems per 100 vehicles (2023): 174 (industry avg: 186)
> Problems per 100 vehicles (2022): 179 — # 12 best out of 32 (industry avg: 192)
> Parent company: Mazda Motor Corp.
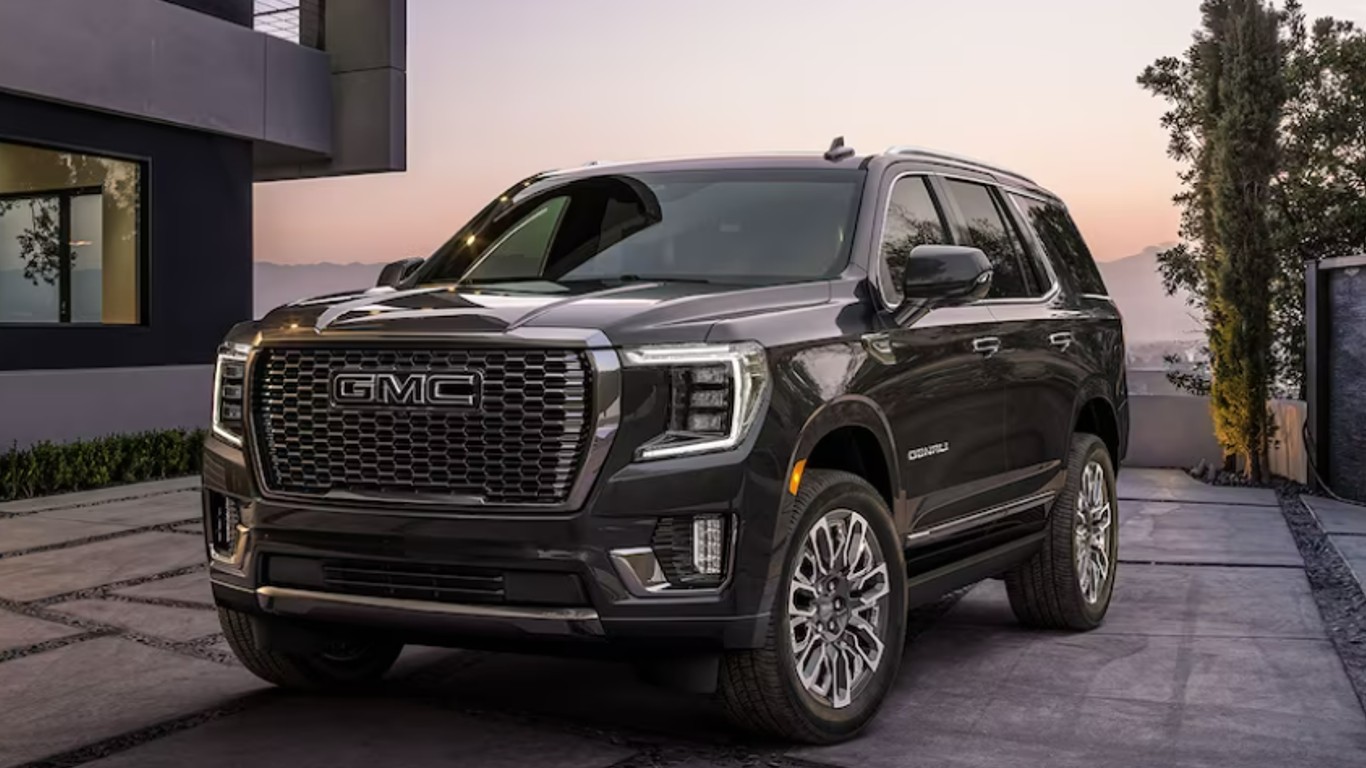
14. GMC
> Problems per 100 vehicles (2023): 175 (industry avg: 186)
> Problems per 100 vehicles (2022): 192 — # 17 best out of 32 (industry avg: 192)
> Parent company: General Motors
[in-text-ad-2]
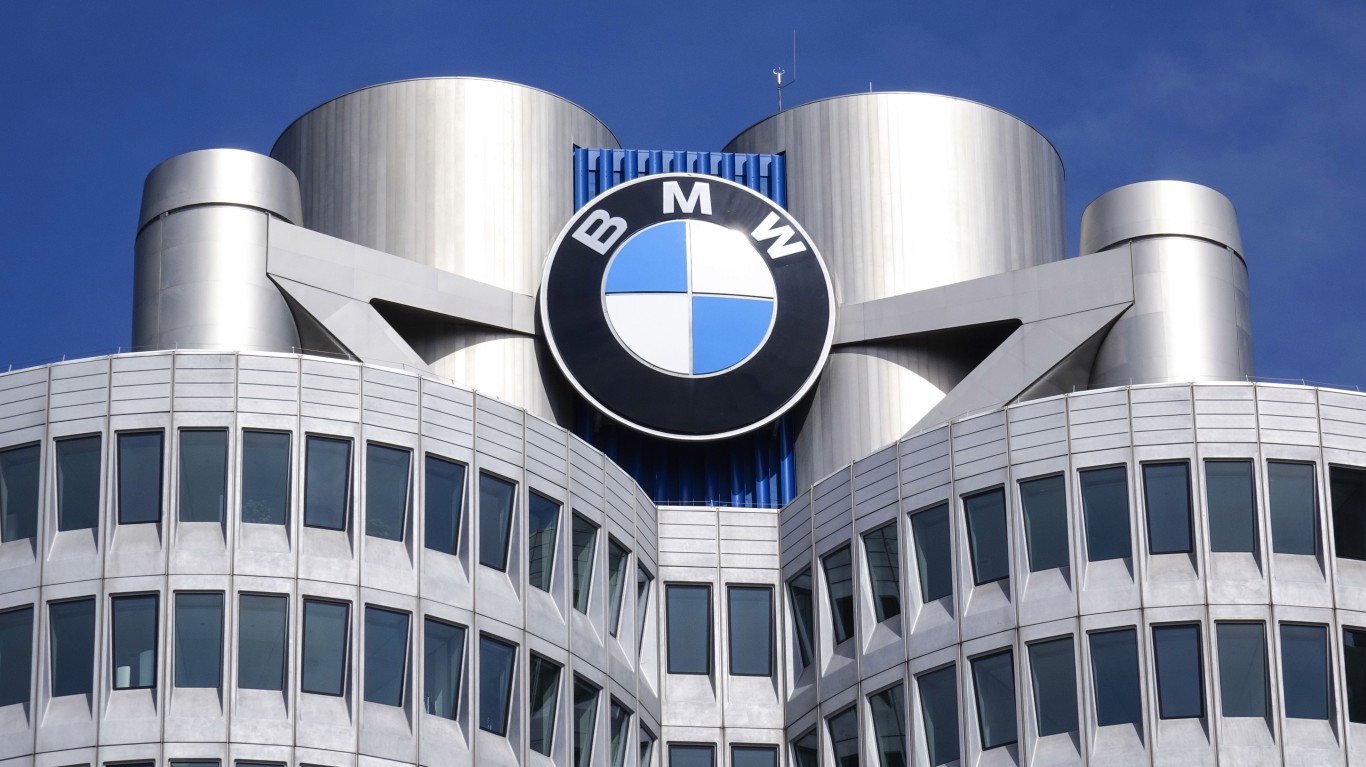
15. BMW
> Problems per 100 vehicles (2023): 184 (industry avg: 186)
> Problems per 100 vehicles (2022): 187 — # 15 best out of 32 (industry avg: 192)
> Parent company: BMW Group
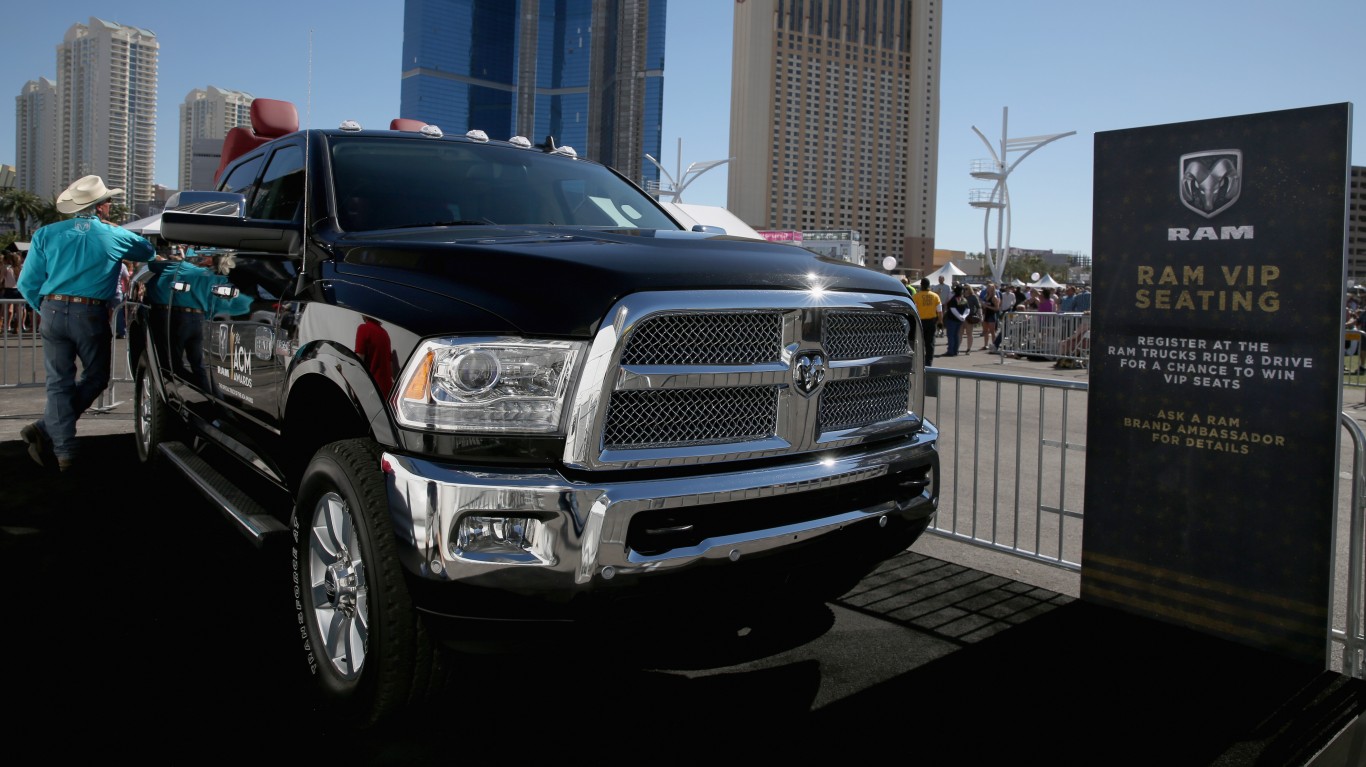
16. Ram
> Problems per 100 vehicles (2023): 189 (industry avg: 186)
> Problems per 100 vehicles (2022): 266 — # 31 best out of 32 (industry avg: 192)
> Parent company: Stellantis
[in-text-ad]
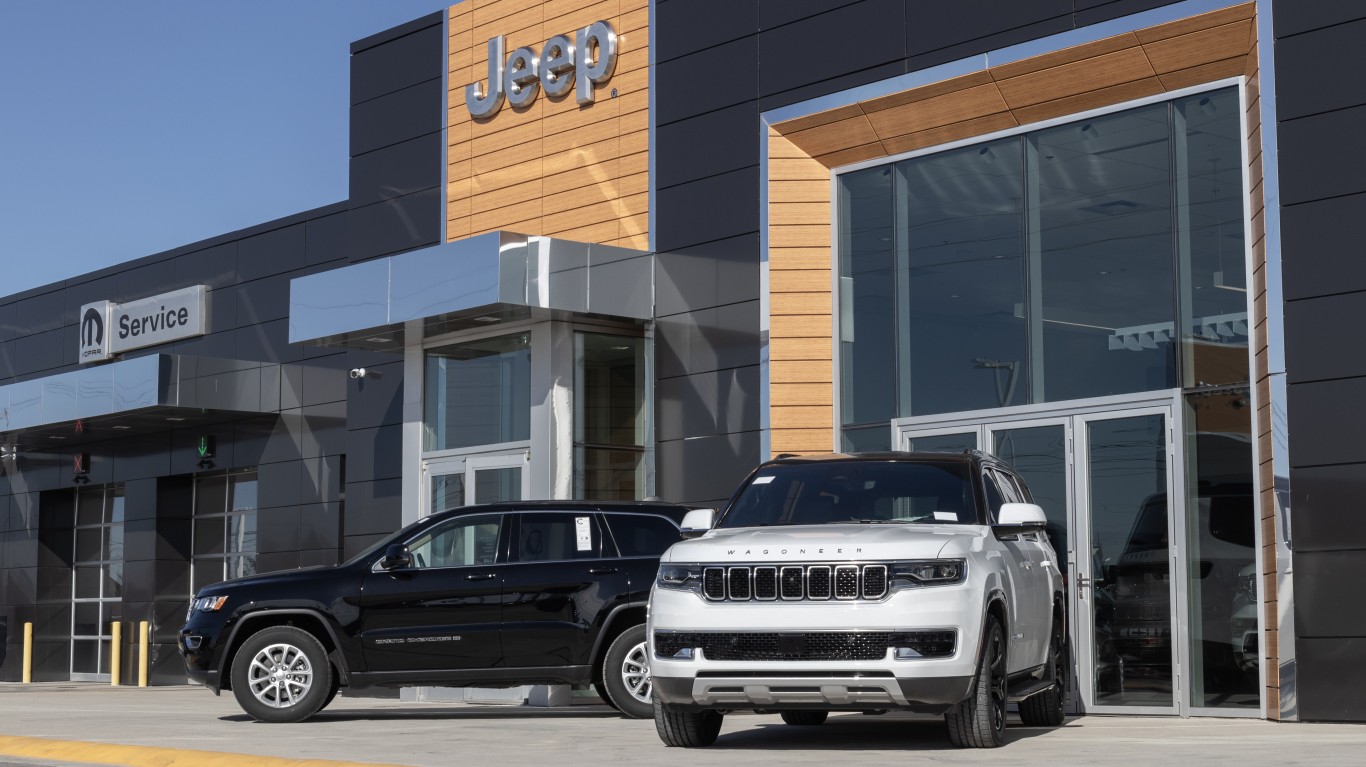
17. Jeep
> Problems per 100 vehicles (2023): 196 (industry avg: 186)
> Problems per 100 vehicles (2022): 201 — # 19 best out of 32 (industry avg: 192)
> Parent company: Stellantis

18. Honda
> Problems per 100 vehicles (2023): 205– tied (industry avg: 186)
> Problems per 100 vehicles (2022): 230 — # 24 best out of 32 (industry avg: 192)
> Parent company: Honda Motor Co.
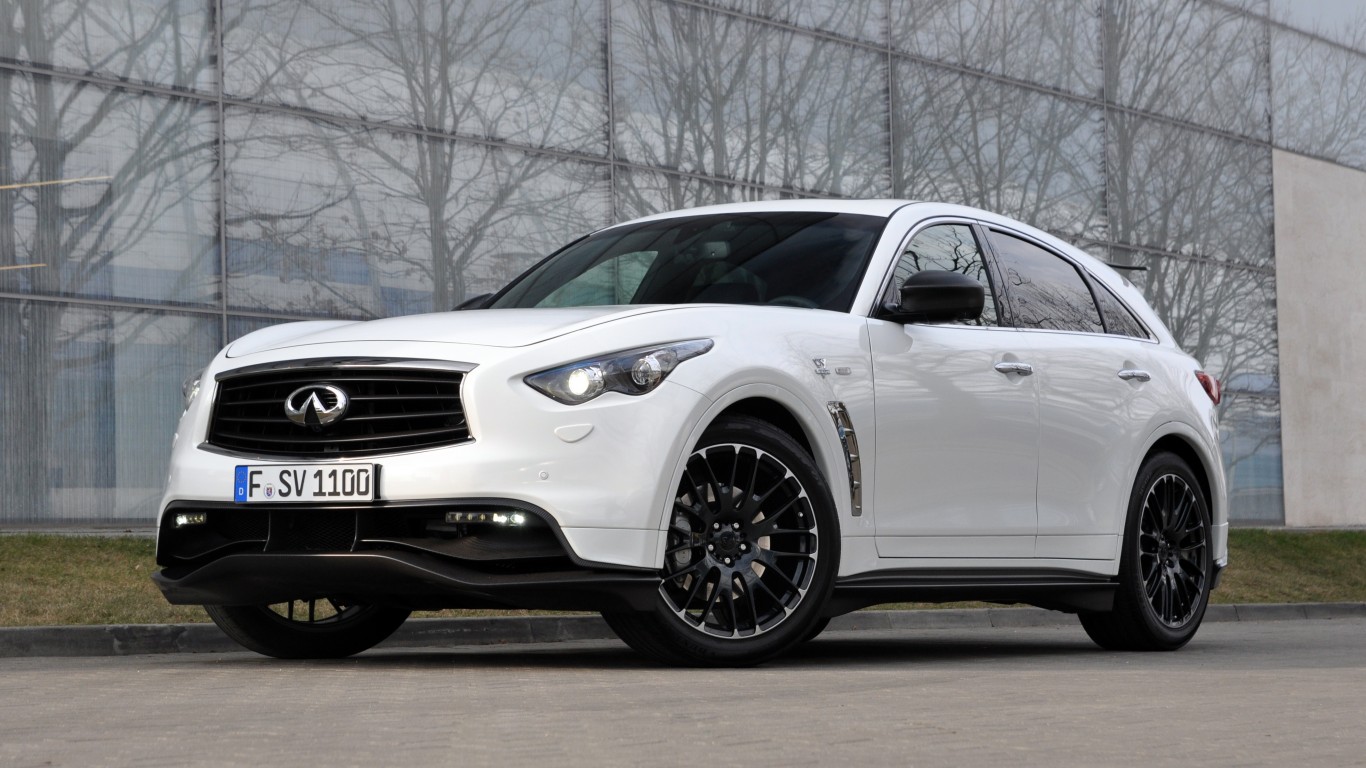
19. Infiniti
> Problems per 100 vehicles (2023): 205– tied (industry avg: 186)
> Problems per 100 vehicles (2022): 228 — # 23 best out of 32 (industry avg: 192)
> Parent company: Renault-Nissan-Mitsubishi Alliance
[in-text-ad-2]
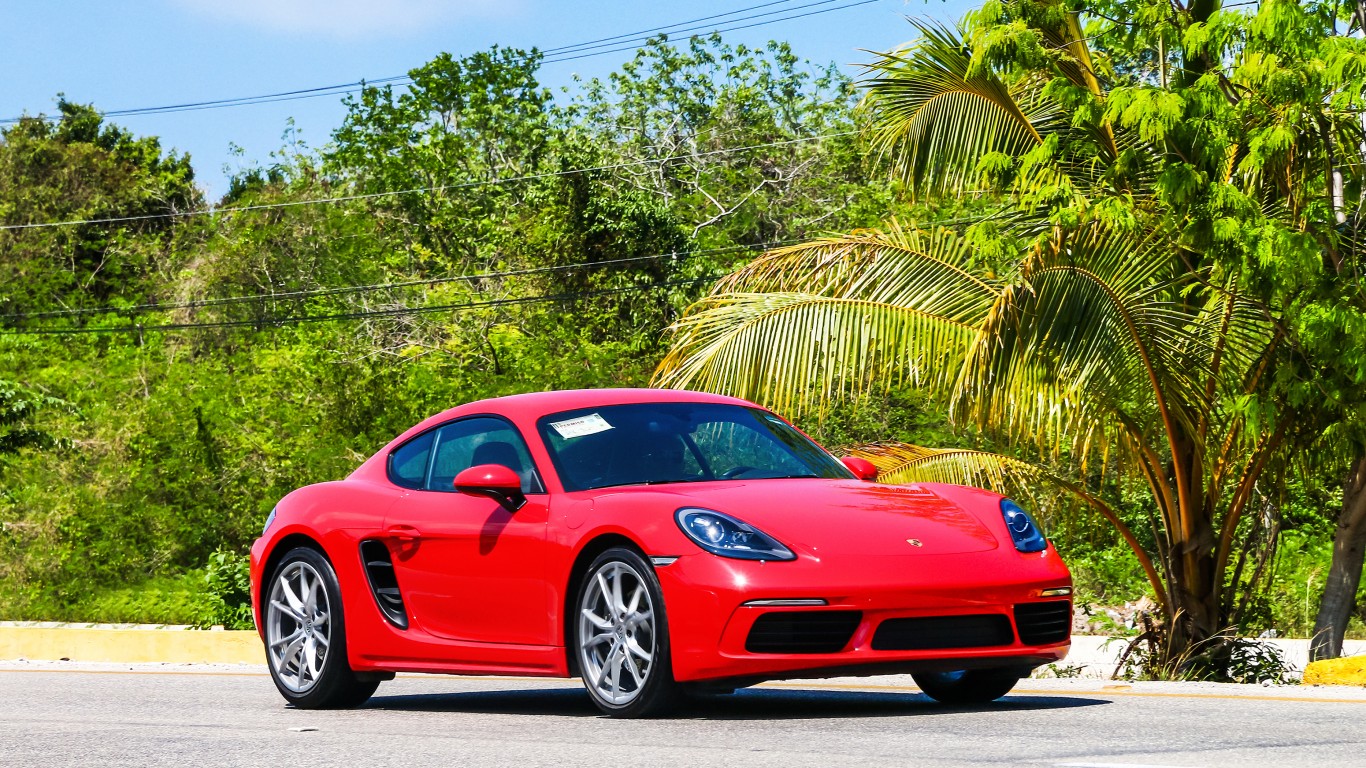
20. Porsche
> Problems per 100 vehicles (2023): 208 (industry avg: 186)
> Problems per 100 vehicles (2022): 162 — # 7 best out of 32 (industry avg: 192)
> Parent company: Volkswagen Group
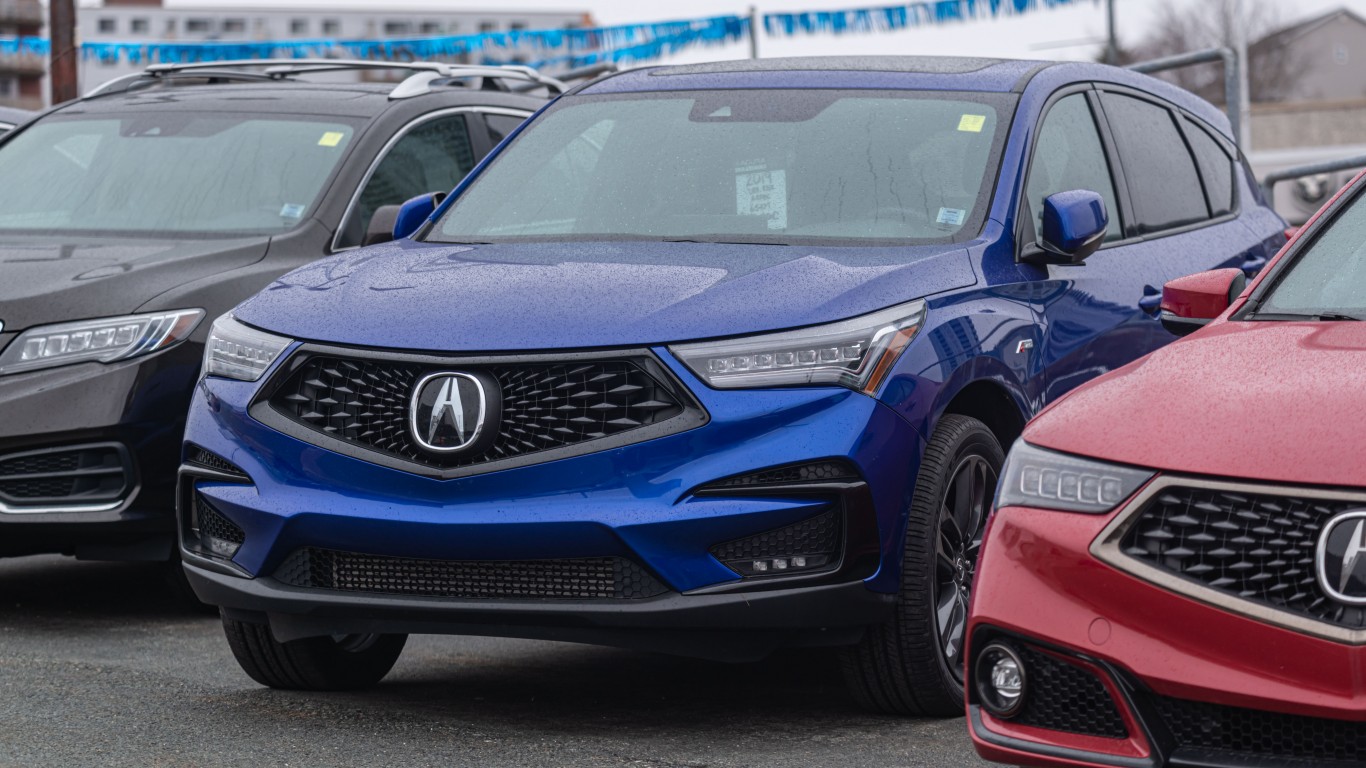
21. Acura
> Problems per 100 vehicles (2023): 211 (industry avg: 186)
> Problems per 100 vehicles (2022): 244 — # 28 best out of 32 (industry avg: 192)
> Parent company: Honda Motor Company
[in-text-ad]
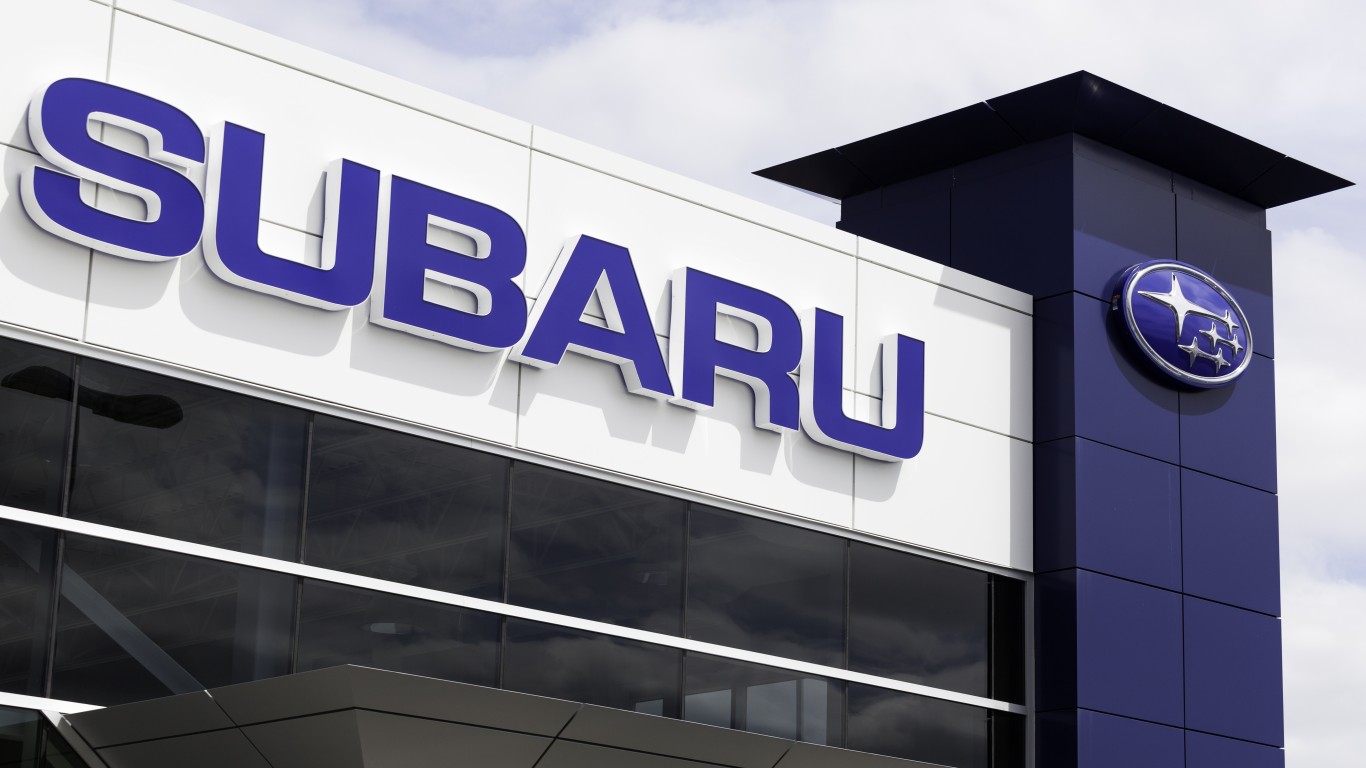
22. Subaru
> Problems per 100 vehicles (2023): 214 (industry avg: 186)
> Problems per 100 vehicles (2022): 226 — # 22 best out of 32 (industry avg: 192)
> Parent company: Subaru Corp.
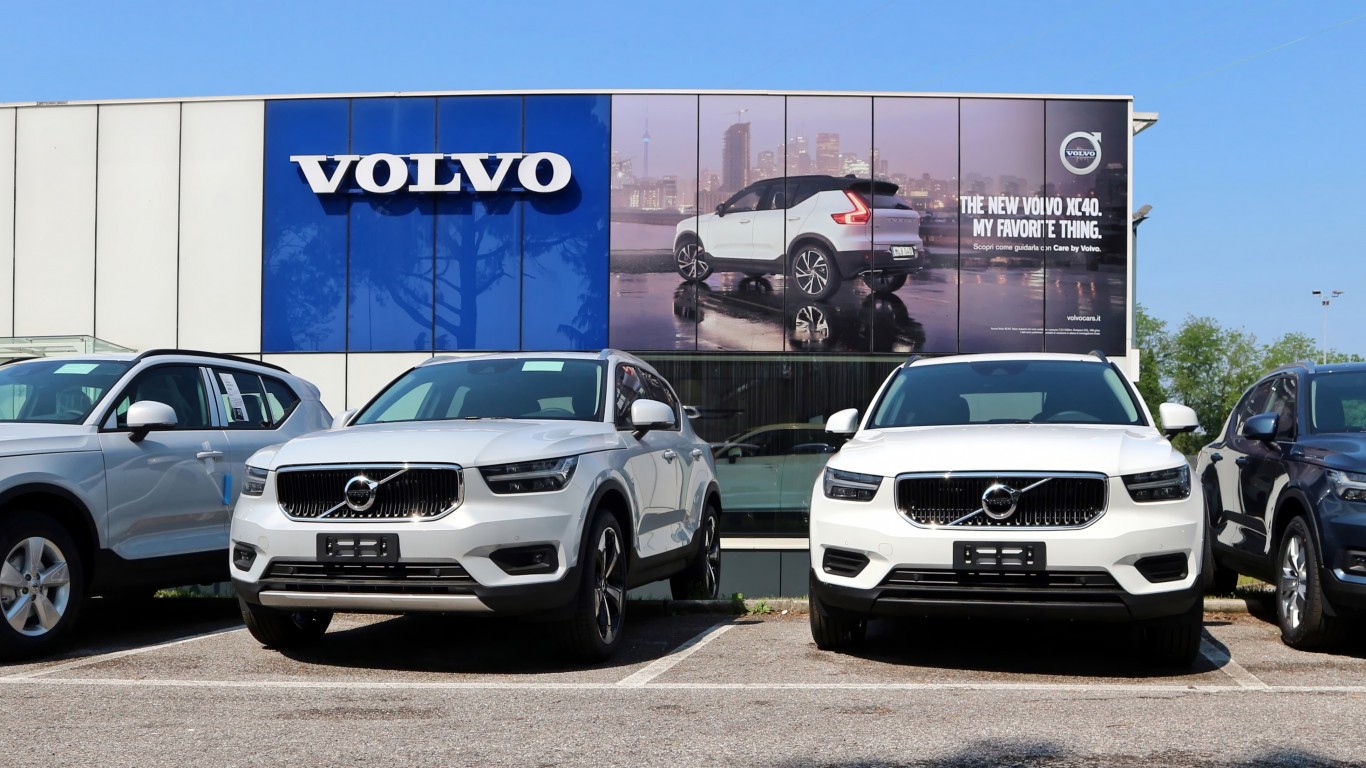
23. Volvo
> Problems per 100 vehicles (2023): 215 (industry avg: 186)
> Problems per 100 vehicles (2022): 256 — # 30 best out of 32 (industry avg: 192)
> Parent company: Zhejiang Geely Holding Group
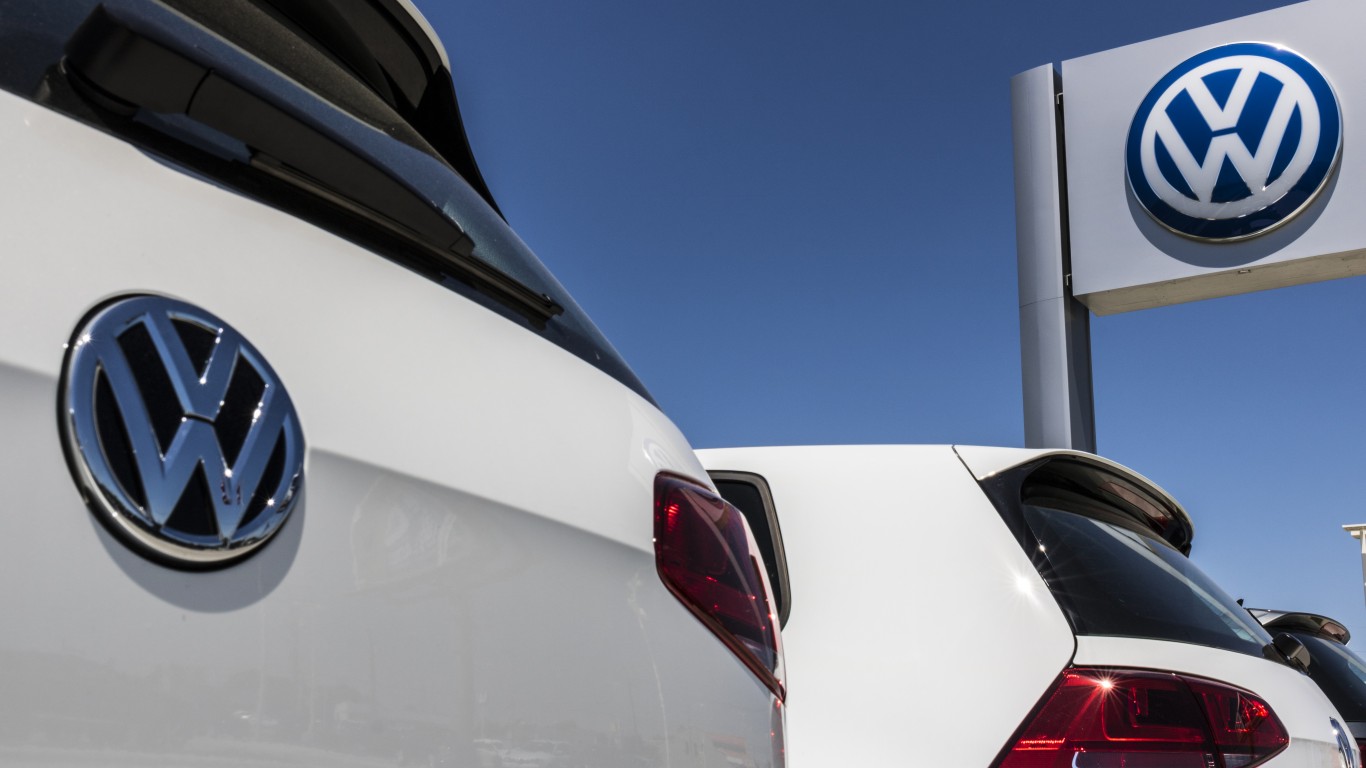
24. Volkswagen
> Problems per 100 vehicles (2023): 216 (industry avg: 186)
> Problems per 100 vehicles (2022): 217 — # 21 best out of 32 (industry avg: 192)
> Parent company: Volkswagen AG.
[in-text-ad-2]
25. Chrysler
> Problems per 100 vehicles (2023): 226 (industry avg: 186)
> Problems per 100 vehicles (2022): 240 — # 27 best out of 32 (industry avg: 192)
> Parent company: Stellantis
26. Jaguar
> Problems per 100 vehicles (2023): 229 (industry avg: 186)
> Problems per 100 vehicles (2022): 233 — # 26 best out of 32 (industry avg: 192)
> Parent company: Tata Motors
[in-text-ad]

27. Mercedes-Benz
> Problems per 100 vehicles (2023): 240 (industry avg: 186)
> Problems per 100 vehicles (2022): 195 — # 18 best out of 32 (industry avg: 192)
> Parent company: Daimler AG
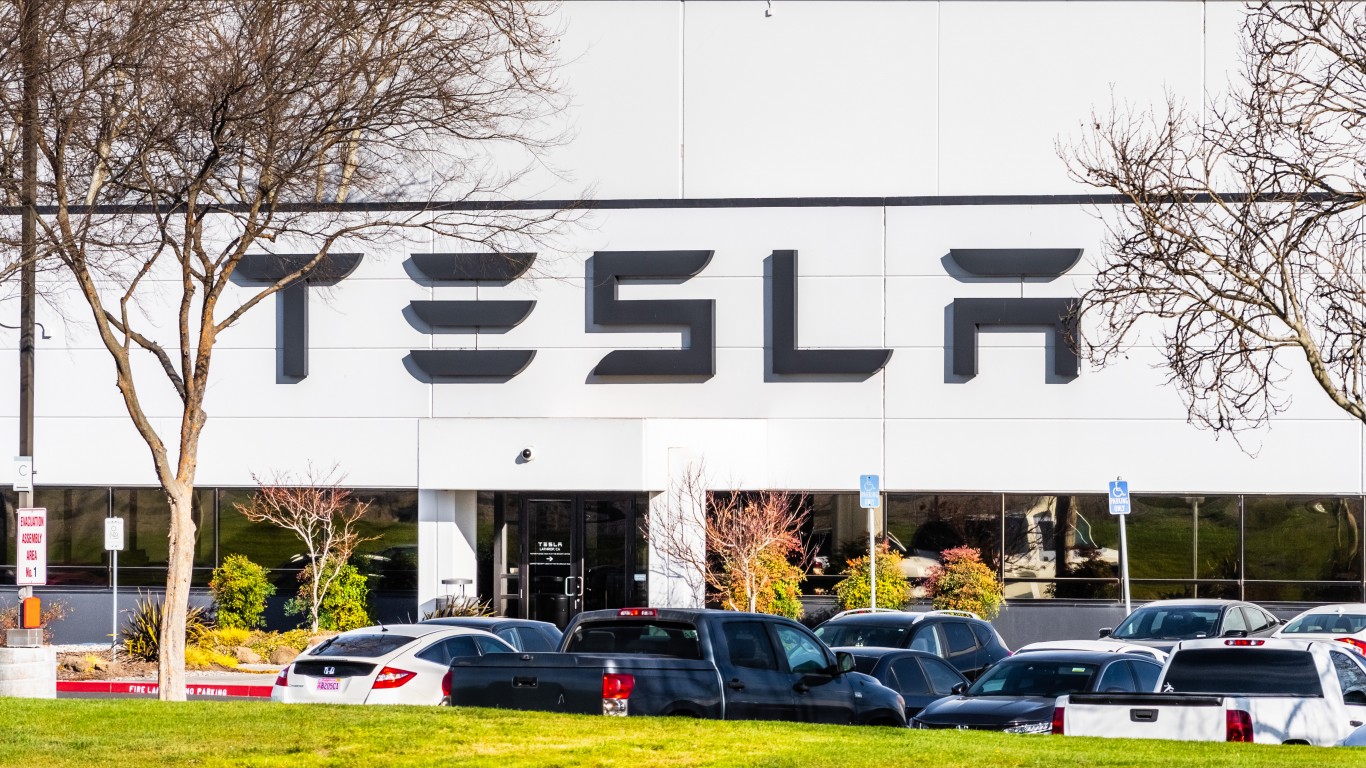
28. Tesla Inc.
> Problems per 100 vehicles (2023): 242 (industry avg: 186)
> Problems per 100 vehicles (2022): N/A
> Parent company: Tesla Inc.
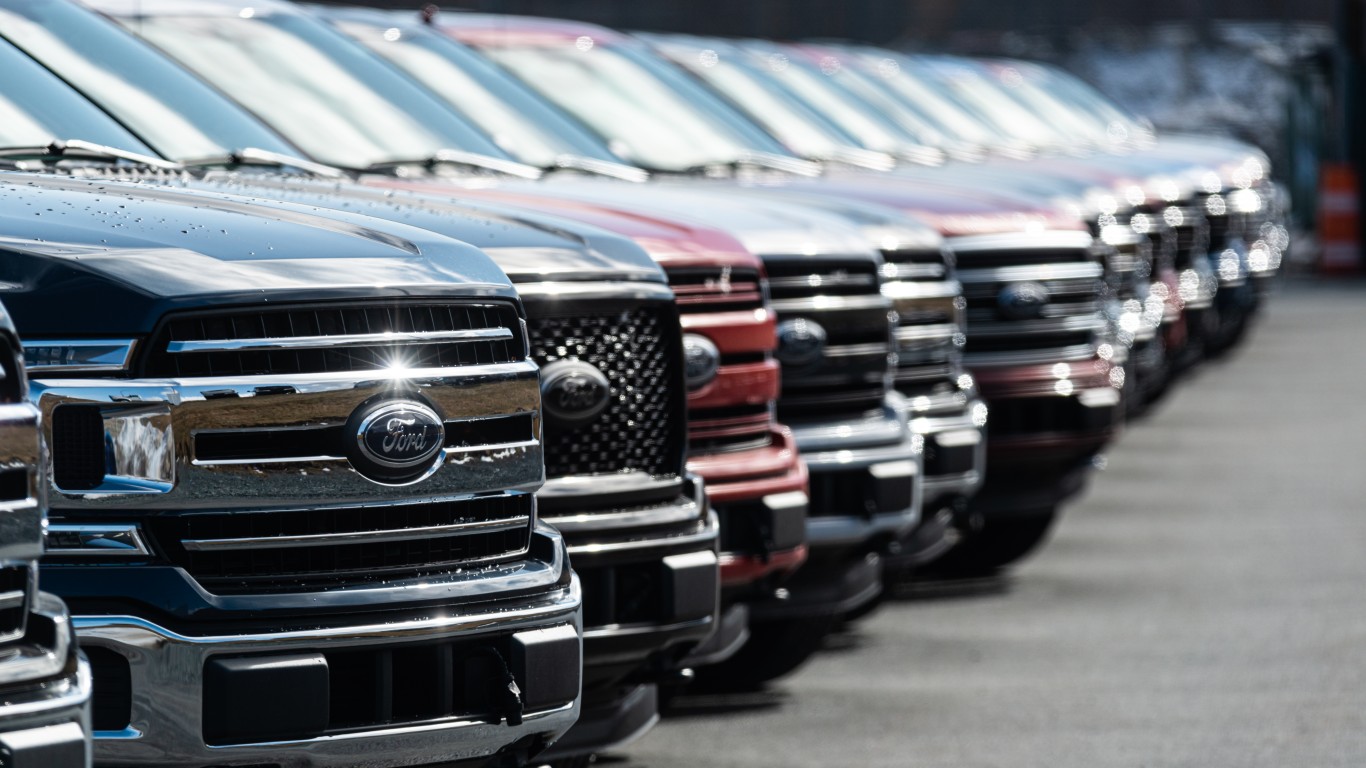
29. Ford
> Problems per 100 vehicles (2023): 249 (industry avg: 186)
> Problems per 100 vehicles (2022): 188 — # 16 best out of 32 (industry avg: 192)
> Parent company: Ford Motor Co.
[in-text-ad-2]
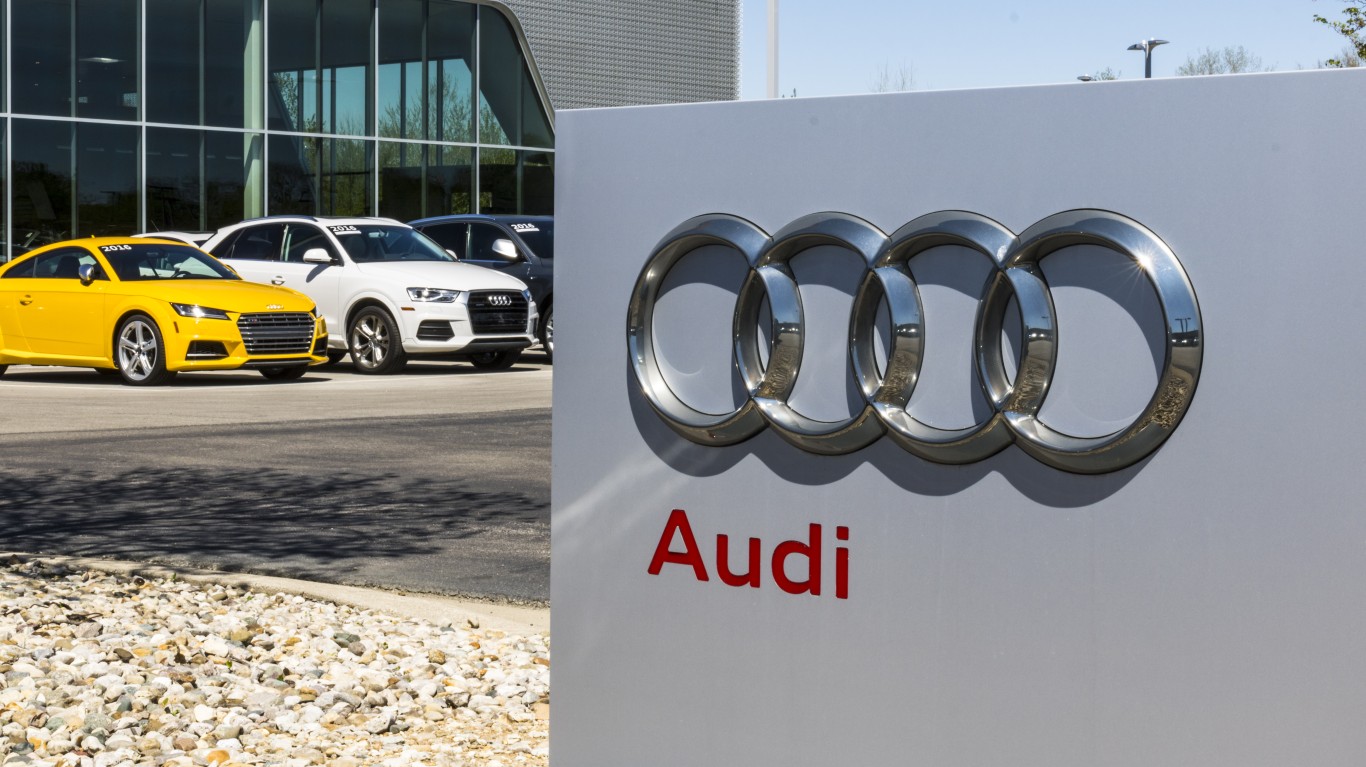
30. Audi
> Problems per 100 vehicles (2023): 252 (industry avg: 186)
> Problems per 100 vehicles (2022): 232 — # 25 best out of 32 (industry avg: 192)
> Parent company: Volkswagen Group
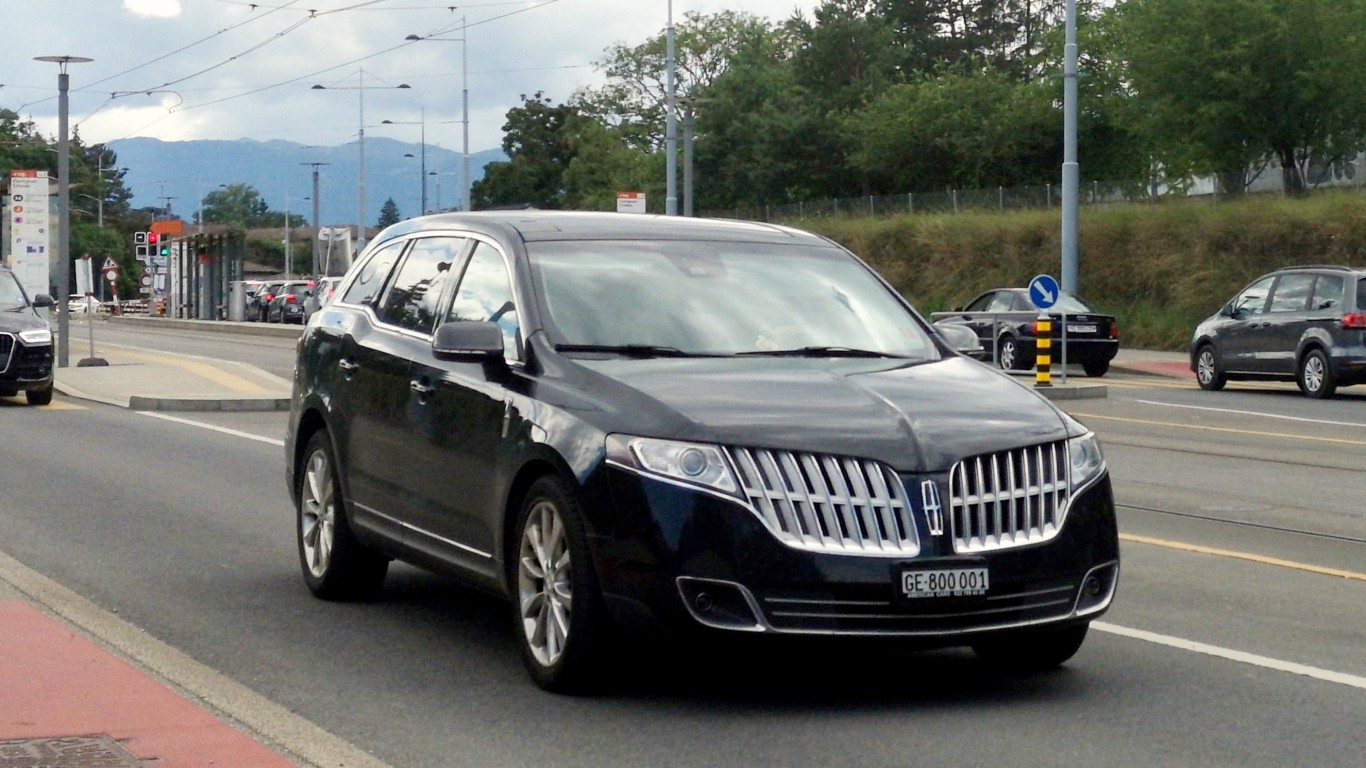
31. Lincoln
> Problems per 100 vehicles (2023): 259 (industry avg: 186)
> Problems per 100 vehicles (2022): 180 — # 13 best out of 32 (industry avg: 192)
> Parent company: Ford Motor Co.
[in-text-ad]
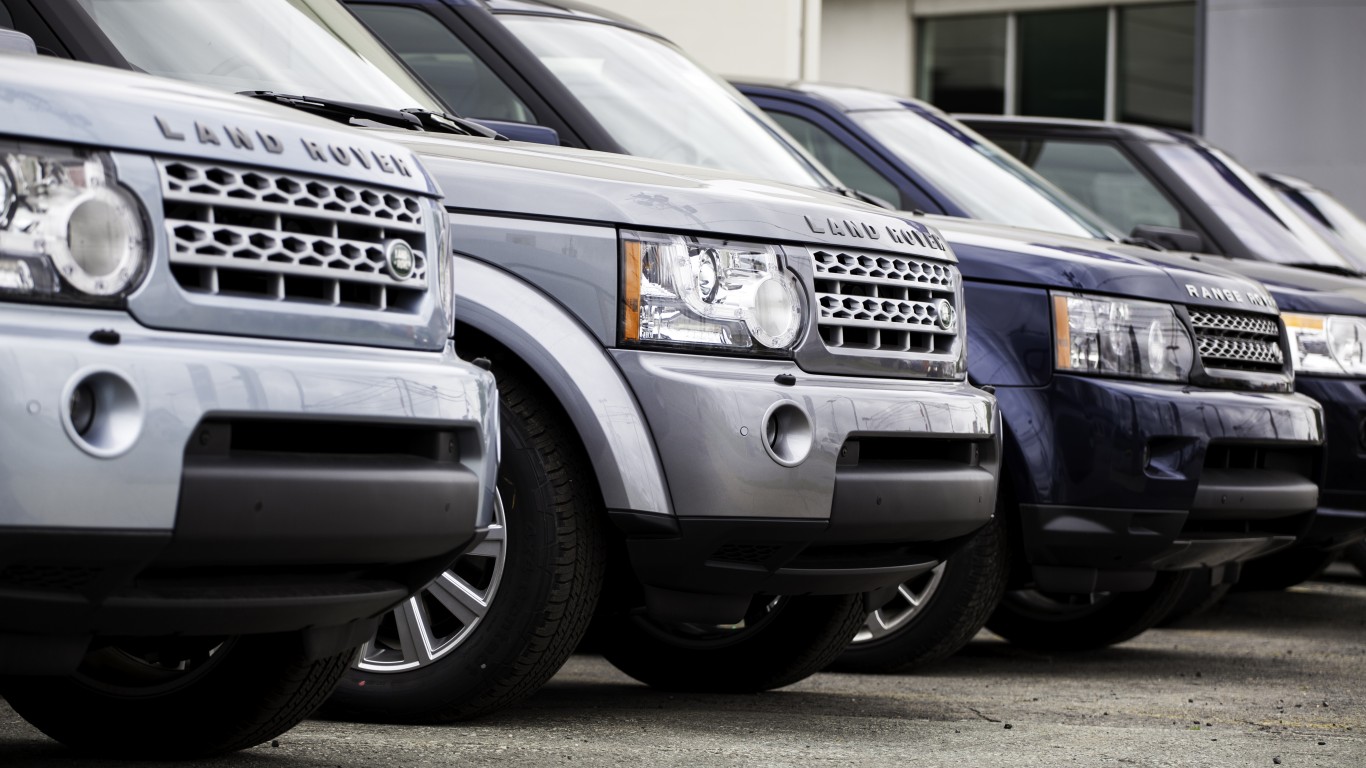
32. Land Rover
> Problems per 100 vehicles (2023): 273 (industry avg: 186)
> Problems per 100 vehicles (2022): 284 — # 32 best out of 32 (industry avg: 192)
> Parent company: Tata Motors
The thought of burdening your family with a financial disaster is most Americans’ nightmare. However, recent studies show that over 100 million Americans still don’t have proper life insurance in the event they pass away.
Life insurance can bring peace of mind – ensuring your loved ones are safeguarded against unforeseen expenses and debts. With premiums often lower than expected and a variety of plans tailored to different life stages and health conditions, securing a policy is more accessible than ever.
A quick, no-obligation quote can provide valuable insight into what’s available and what might best suit your family’s needs. Life insurance is a simple step you can take today to help secure peace of mind for your loved ones tomorrow.
Click here to learn how to get a quote in just a few minutes.
Thank you for reading! Have some feedback for us?
Contact the 24/7 Wall St. editorial team.