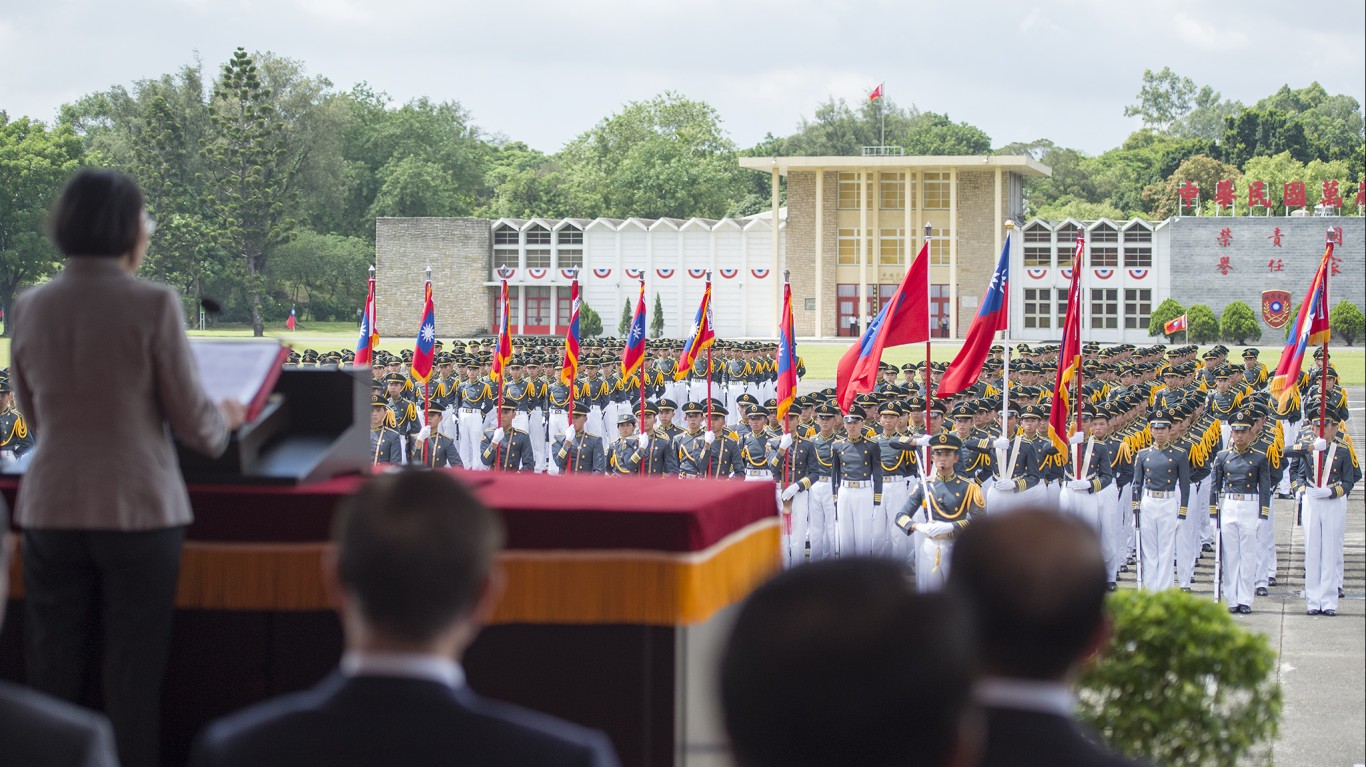
The United States is by far the world’s largest military hardware market, making up 40% of global arms exports from 2018 to 2022, up from 33% in the previous five-year period. The U.S. exported weapons to 103 states in that period of time, with nearly half of these weapons going to Saudi Arabia, Japan, Australia, Qatar, and South Korea, according to data from the Stockholm International Peace Research Institute.
Russia, the world’s second-largest arms exporter, has become a global pariah for its February 2014 annexation of Crimea and its ongoing invasion of Ukraine that began eight years later. Subsequently, Russian arms exports fell by 31% in 2018-2022 while they increased in four of the top 10 arms exporters: the U.S., France, Italy, and South Korea. (However, this is the country with the most nuclear weapons.)
A report in March from the Wall Street Journal, citing military analysts, said Western sanctions, the need to conserve arms for its war in Ukraine, and the reputational damage from battlefield performance, for the sharp decline in Russian arms exports. Notably, the turrets of Russian T-class tanks have a tendency to violently blow off the chassis when ammunition inside is ignited by an anti-tank projectile, instantly killing the three-man crew, a phenomenon known as the “jack-in-the-box” flaw in the tanks’ design.
But Russia is still a major arms exporter. Nearly 55% of India’s arms imports come from there as do more than 74% of Vietnam’s arms imports. Russia’s fighter jets, air defense systems, helicopters, tanks, armored personnel carriers, infantry fighting vehicles, and small arms are also major inputs to militaries in Algeria, Vietnam, and Egypt.
To find the 15 countries importing the most arms from Russia, 24/7 Wall St. reviewed data from SIPRI. Countries were ranked based on their arms imports from Russia as a share of Russia’s total arms exports from 2013 to 2022. All data is from the SIPRI Arms Transfers Database and Military Expenditure Database.
Among the 15 top importers of Russian arms, some countries account considerably more than others. For example, about 3.5% of all Russian arms exports from 2013 to 2022 went to Iraq. China was the destination for about 16% of those exports. India, by far, buys the most arms from Russia, with nearly 33% of Russian weapons exports going to India. (See also, 17 countries with skyrocketing weapons imports.)
Seven of these 15 countries spent more than the global average of 2.2% of gross domestic product on their total military spending in 2022 (or the latest year available), led by 4.8% for Algeria. Two other countries devoted more than 4% of their GDP on their militaries: Syria and Azerbaijan.
Three countries – Iran, Syria, and Belarus – imported almost all of their arms from Russia. Other countries heavily reliant on Russian arms include Kazakhstan and Venezuela. Eleven of these 15 countries sourced more than half of their arms imports from the former Soviet Union.
Here are the countries importing the most Russian arms.
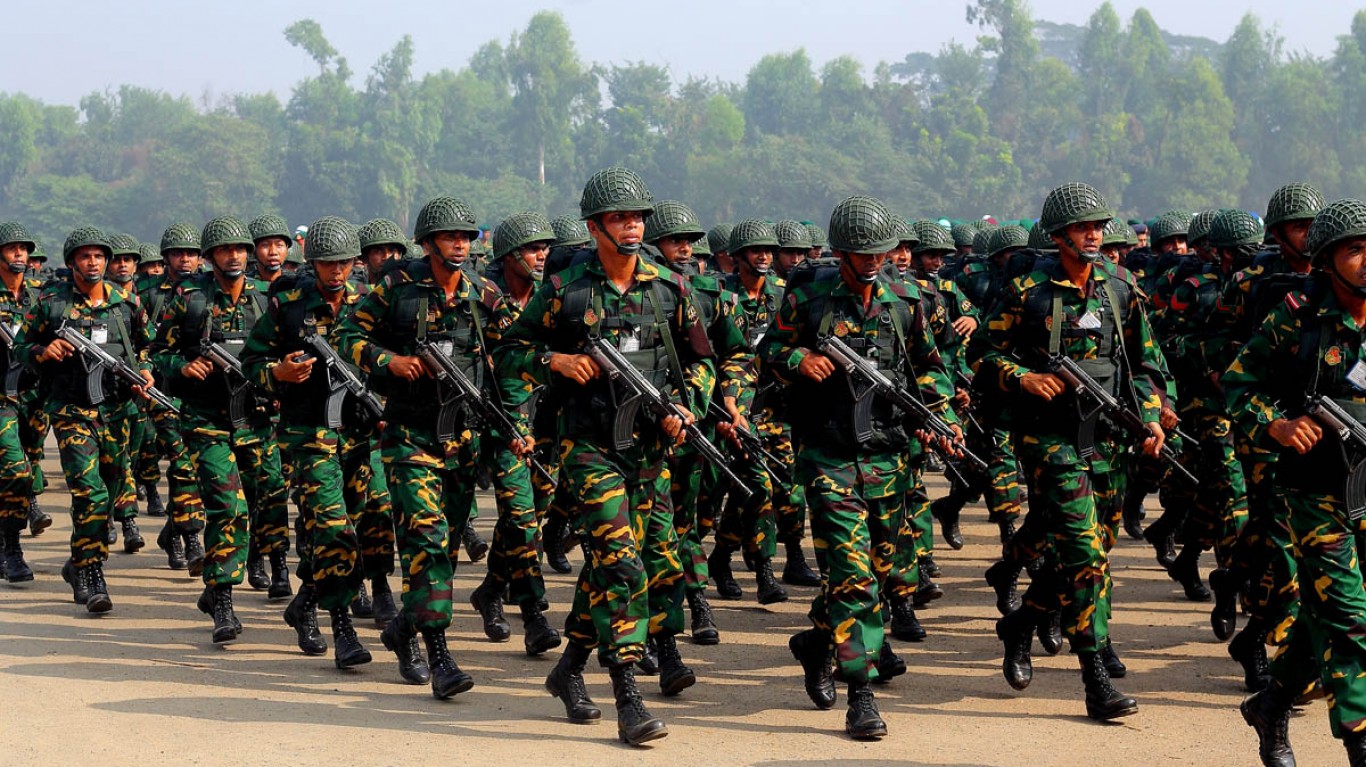
15. Bangladesh
> Bangladesh’s share of Russia’s total arms exports, 2013-2022: 0.74%
> Russian imports as share of Bangladesh’s total arms imports, 2013-2022: 11.8%
> Top arms suppliers, 2013-2022: China, Russia, United States
> Military spending, 2022, current USD: $4.81 billion (1.13% of GDP)
[in-text-ad]

14. Iran
> Iran’s share of Russia’s total arms exports, 2013-2022: 0.80%
> Russian imports as share of Iran’s total arms imports, 2013-2022: 94.0%
> Top arms suppliers, 2013-2022: Russia, China
> Military spending, 2022, current USD: $6.85 billion (2.59% of GDP)
13. Angola
> Angola’s share of Russia’s total arms exports, 2013-2022: 0.92%
> Russian imports as share of Angola’s total arms imports, 2013-2022: 56.9%
> Top arms suppliers, 2013-2022: Russia, Belarus, China
> Military spending, 2022, current USD: $1.62 billion (1.33% of GDP)

12. Myanmar
> Myanmar’s share of Russia’s total arms exports, 2013-2022: 1.11%
> Russian imports as share of Myanmar’s total arms imports, 2013-2022: 28.1%
> Top arms suppliers, 2013-2022: China, Russia, India
> Military spending, 2022, current USD: $1.86 billion (3.05% of GDP)
[in-text-ad-2]
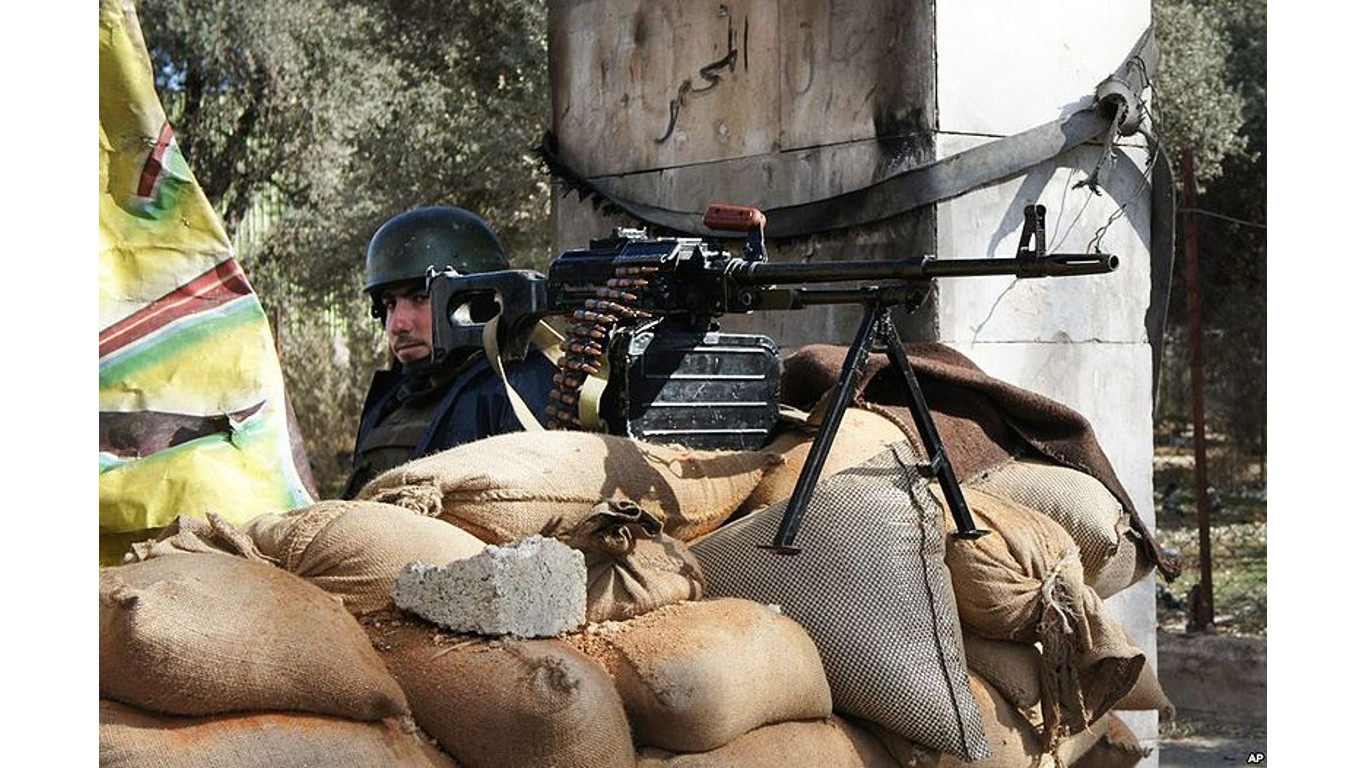
11. Syria
> Syria’s share of Russia’s total arms exports, 2013-2022: 1.61%
> Russian imports as share of Syria’s total arms imports, 2013-2022: 95.7%
> Top arms suppliers, 2013-2022: Russia, Iran, China
> Military spending, 2010, current USD: $2.35 billion (4.06% of GDP)
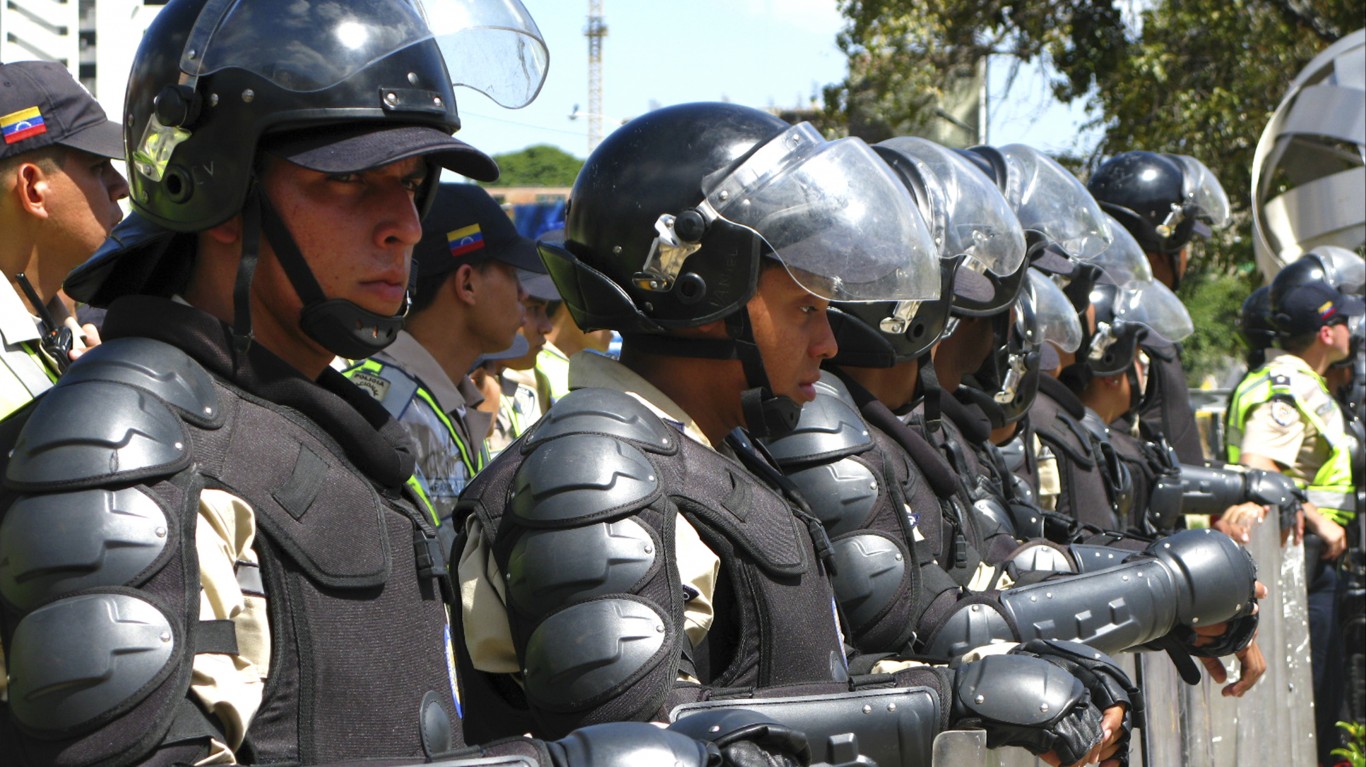
10. Venezuela
> Venezuela’s share of Russia’s total arms exports, 2013-2022: 1.75%
> Russian imports as share of Venezuela’s total arms imports, 2013-2022: 64.5%
> Top arms suppliers, 2013-2022: Russia, China, Netherlands
> Military spending, 2022, current USD: $0.00 billion (0.65% of GDP)
[in-text-ad]
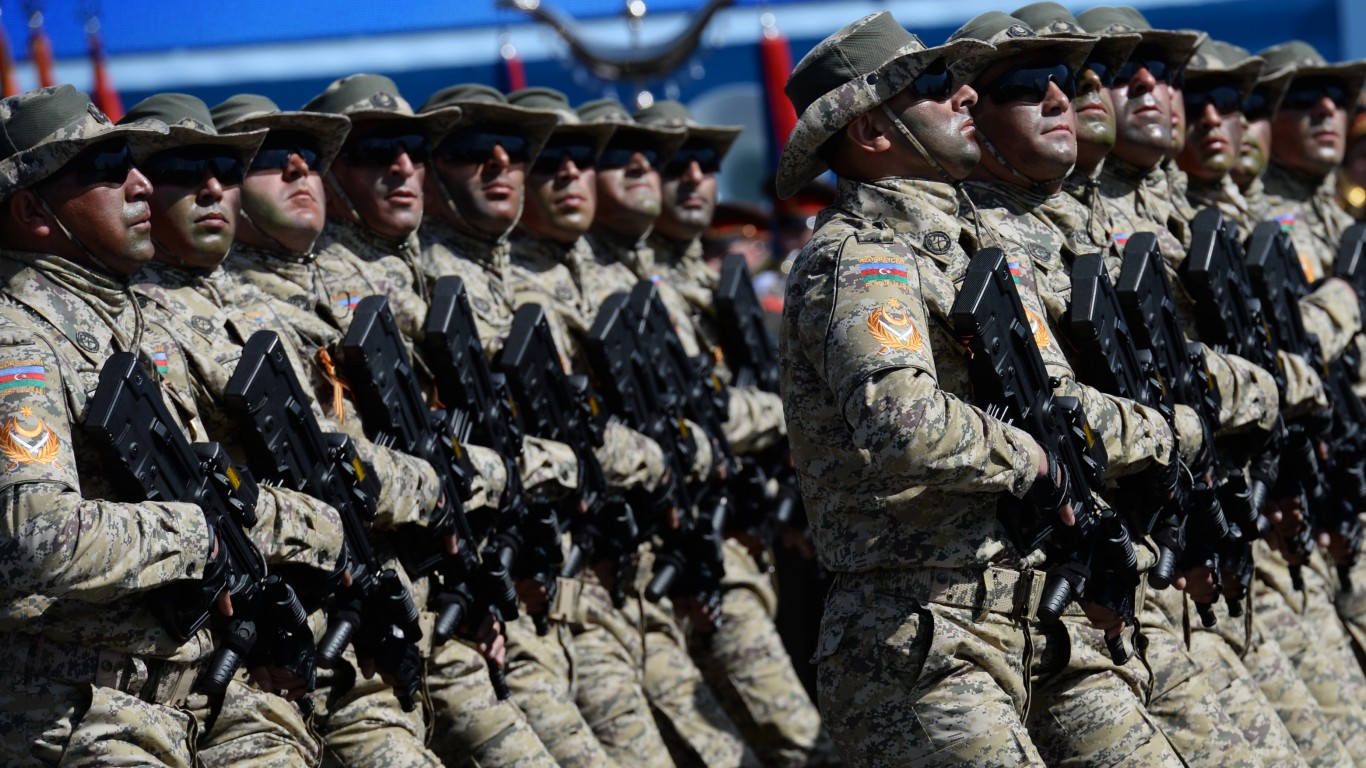
9. Azerbaijan
> Azerbaijan’s share of Russia’s total arms exports, 2013-2022: 2.25%
> Russian imports as share of Azerbaijan’s total arms imports, 2013-2022: 52.6%
> Top arms suppliers, 2013-2022: Russia, Israel, Belarus
> Military spending, 2022, current USD: $2.99 billion (4.55% of GDP)
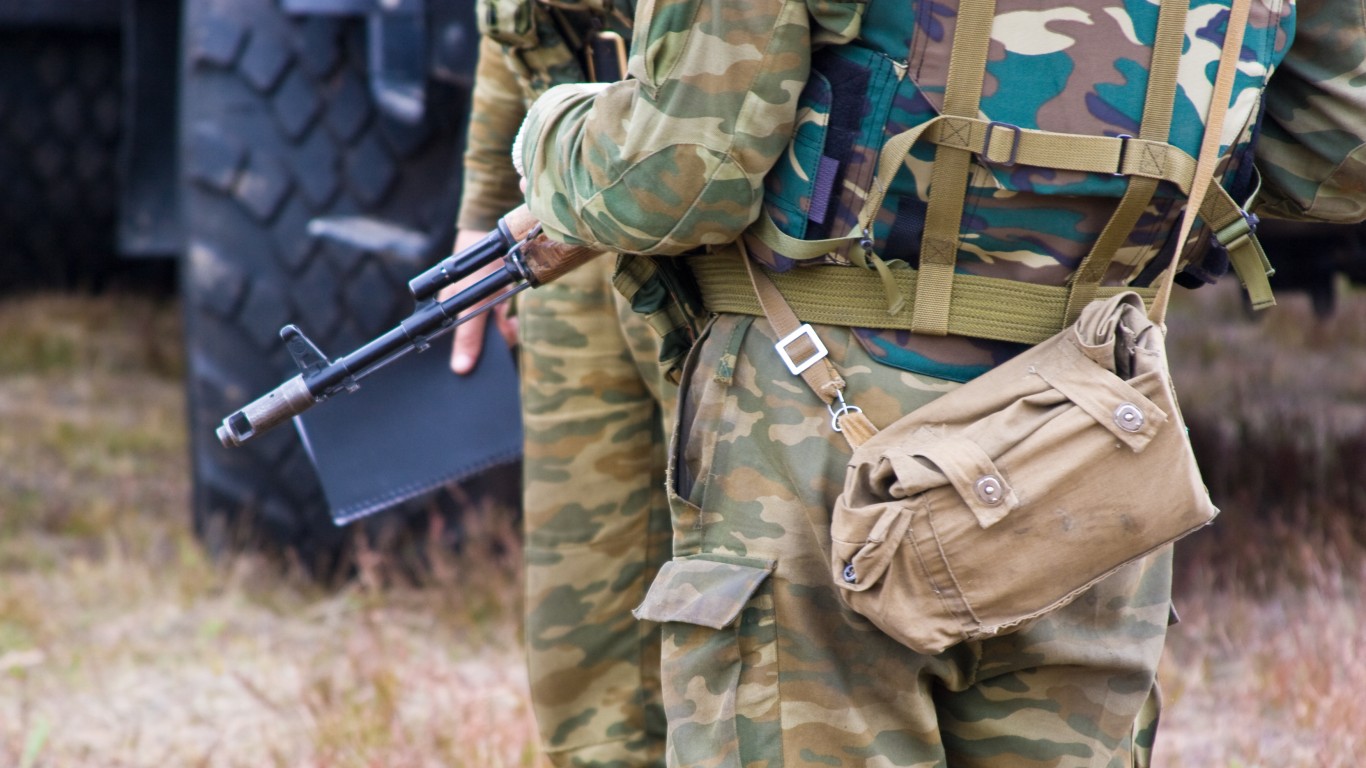
8. Belarus
> Belarus’s share of Russia’s total arms exports, 2013-2022: 2.32%
> Russian imports as share of Belarus’s total arms imports, 2013-2022: 99.0%
> Top arms suppliers, 2013-2022: Russia, Ukraine, China
> Military spending, 2022, current USD: $0.82 billion (1.20% of GDP)
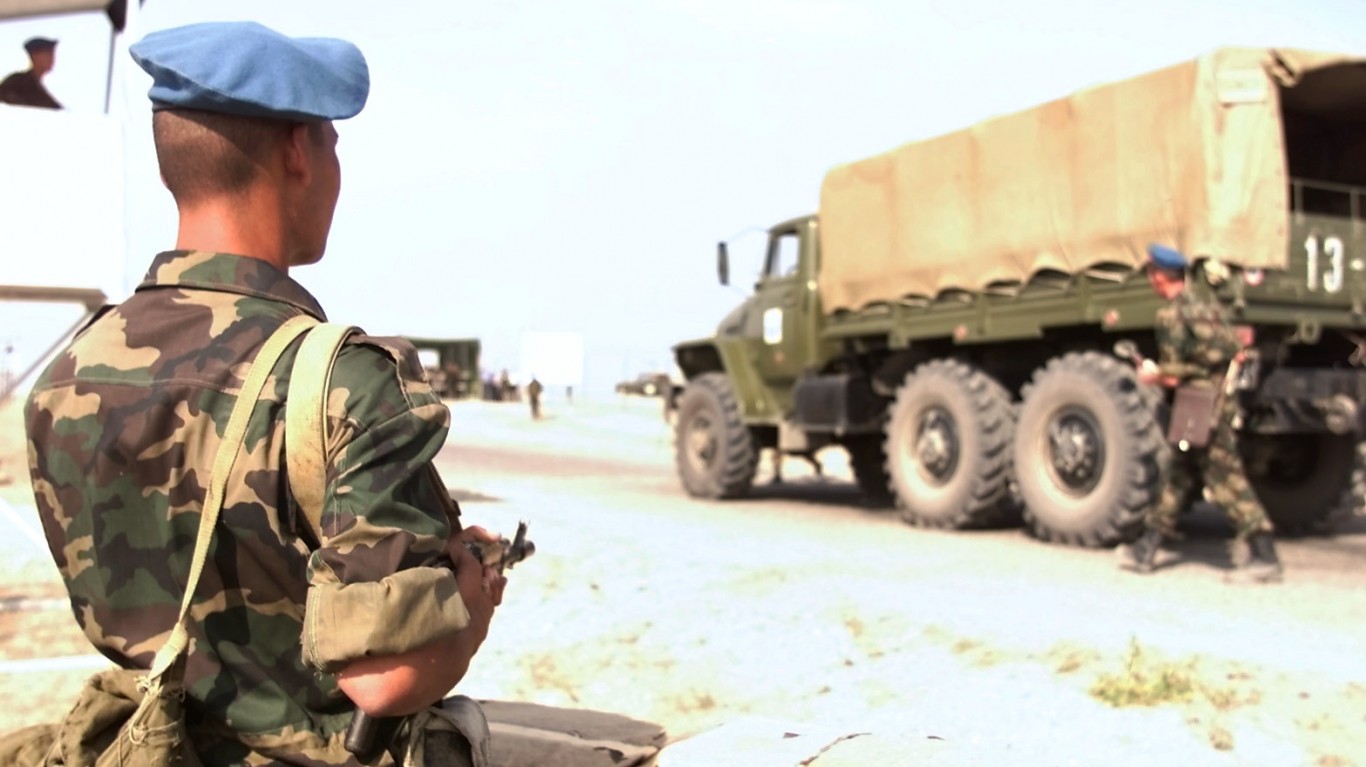
7. Kazakhstan
> Kazakhstan’s share of Russia’s total arms exports, 2013-2022: 3.15%
> Russian imports as share of Kazakhstan’s total arms imports, 2013-2022: 85.0%
> Top arms suppliers, 2013-2022: Russia, Spain, Ukraine
> Military spending, 2022, current USD: $1.13 billion (0.51% of GDP)
[in-text-ad-2]
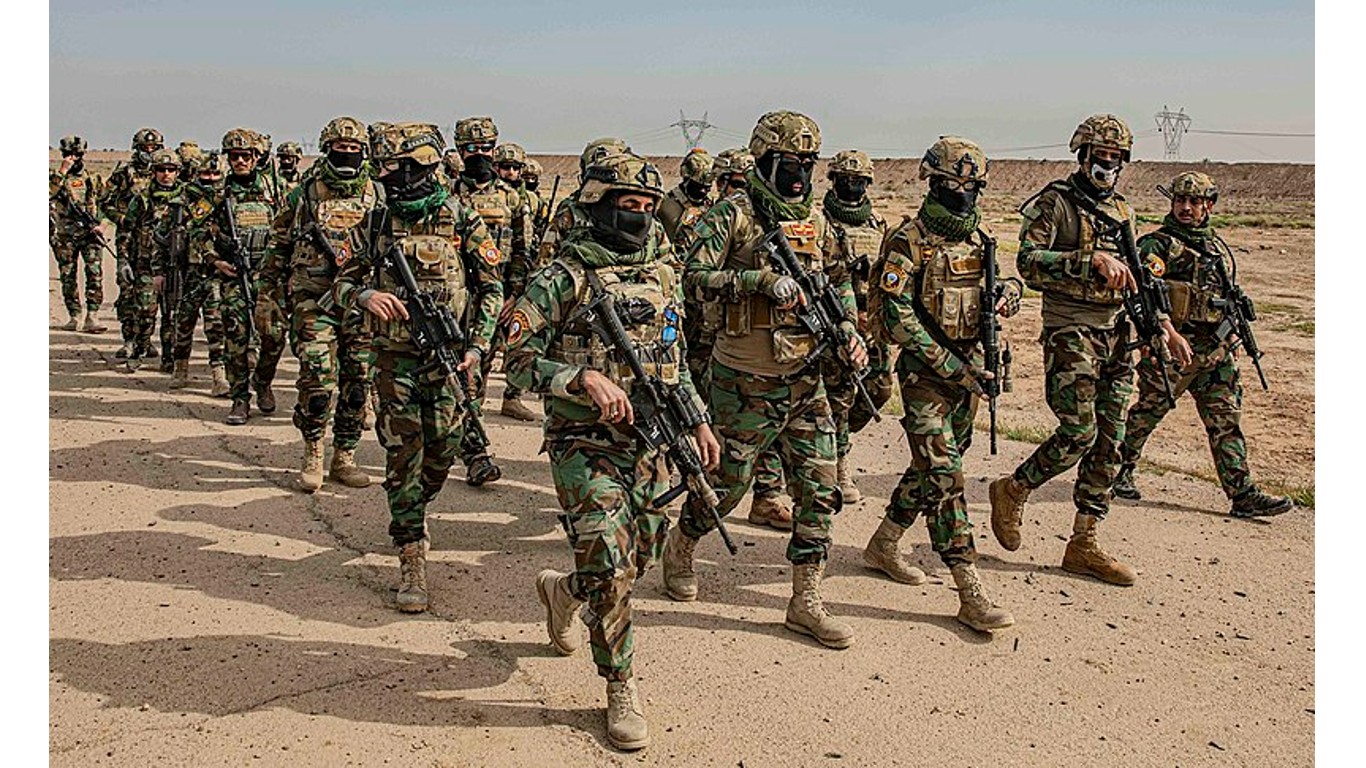
6. Iraq
> Iraq’s share of Russia’s total arms exports, 2013-2022: 3.54%
> Russian imports as share of Iraq’s total arms imports, 2013-2022: 32.8%
> Top arms suppliers, 2013-2022: United States, Russia, South Korea
> Military spending, 2022, current USD: $4.68 billion (1.67% of GDP)
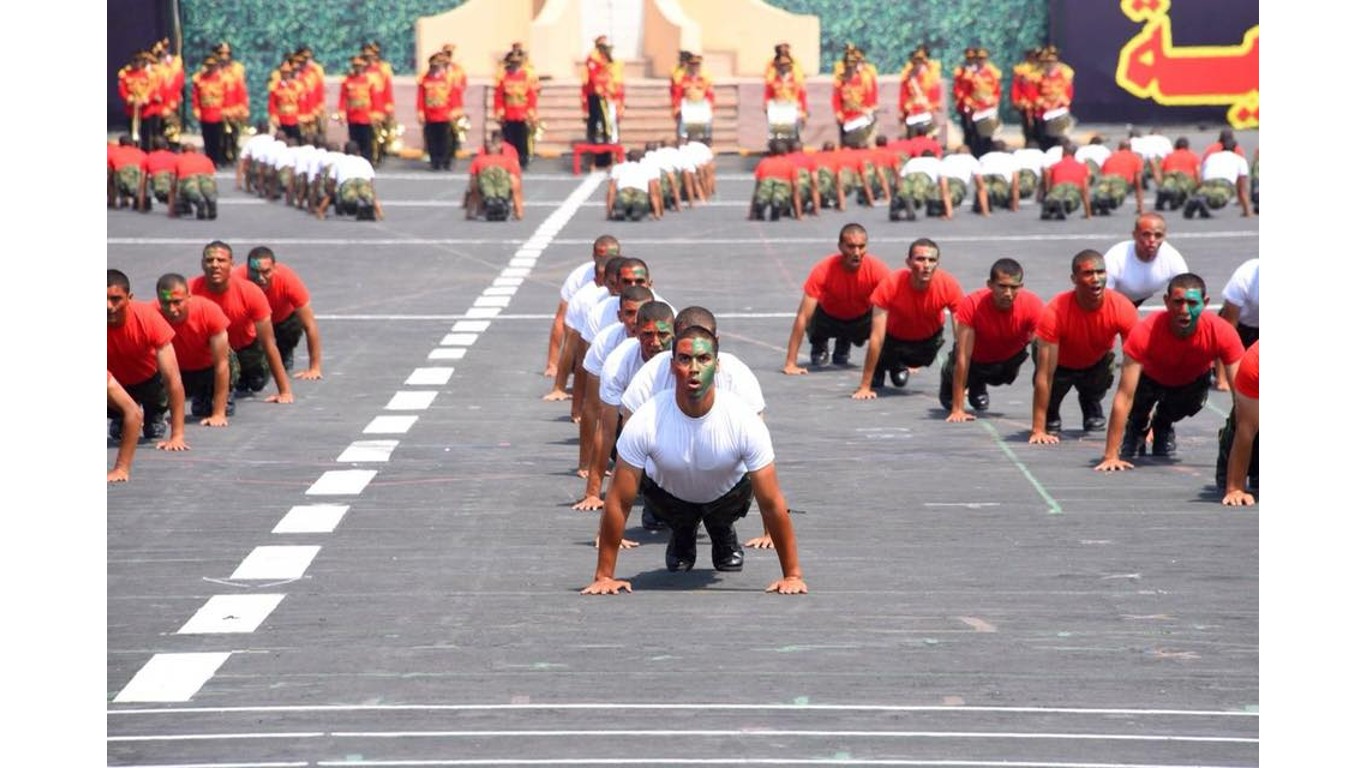
5. Egypt
> Egypt’s share of Russia’s total arms exports, 2013-2022: 6.42%
> Russian imports as share of Egypt’s total arms imports, 2013-2022: 27.6%
> Top arms suppliers, 2013-2022: France, Russia, United States
> Military spending, 2022, current USD: $4.65 billion (1.06% of GDP)
[in-text-ad]
4. Viet Nam
> Viet Nam’s share of Russia’s total arms exports, 2013-2022: 7.10%
> Russian imports as share of Viet Nam’s total arms imports, 2013-2022: 74.1%
> Top arms suppliers, 2013-2022: Russia, Israel, Belarus
> Military spending, 2018, current USD: $5.50 billion (2.28% of GDP)
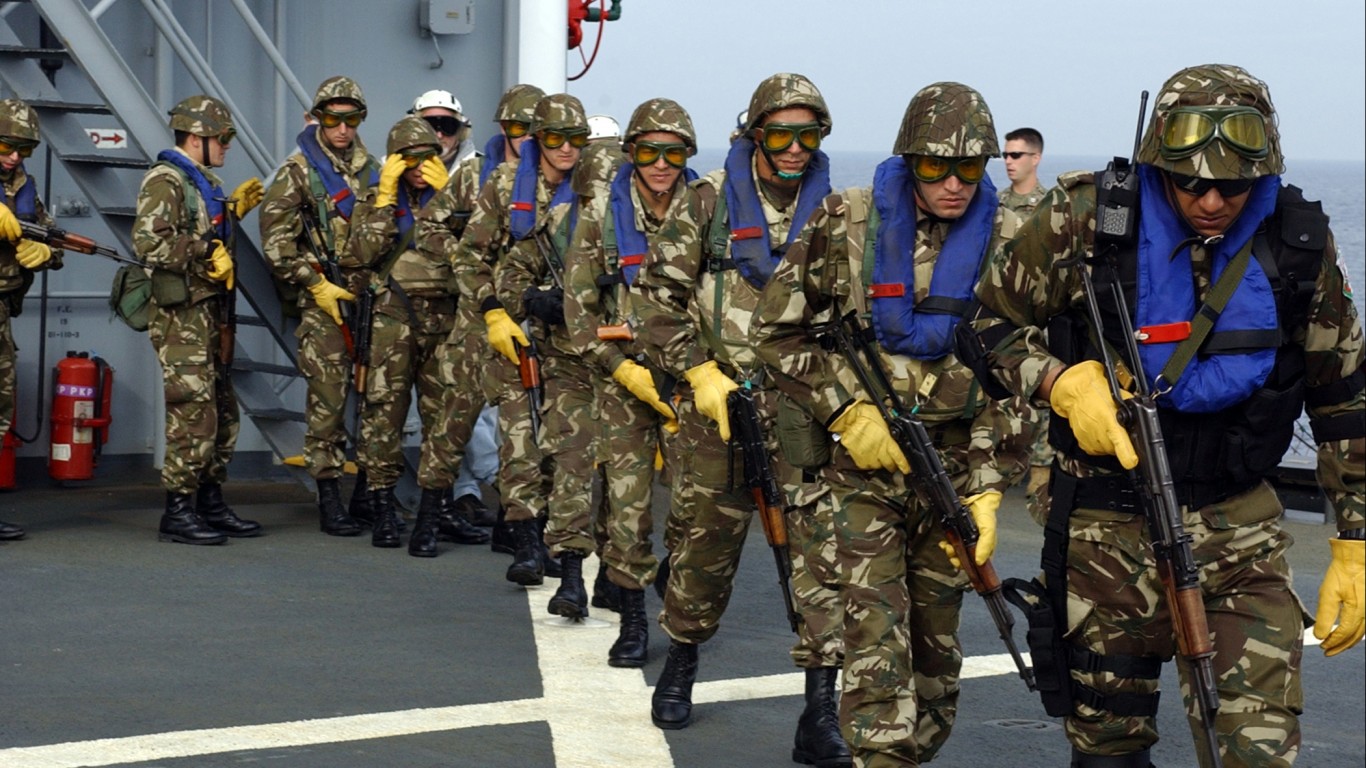
3. Algeria
> Algeria’s share of Russia’s total arms exports, 2013-2022: 10.21%
> Russian imports as share of Algeria’s total arms imports, 2013-2022: 65.5%
> Top arms suppliers, 2013-2022: Russia, China, Germany
> Military spending, 2022, current USD: $9.15 billion (4.78% of GDP)
2. China
> China’s share of Russia’s total arms exports, 2013-2022: 16.30%
> Russian imports as share of China’s total arms imports, 2013-2022: 72.2%
> Top arms suppliers, 2013-2022: Russia, France, Ukraine
> Military spending, 2022, current USD: $291.96 billion (1.60% of GDP)
[in-text-ad-2]
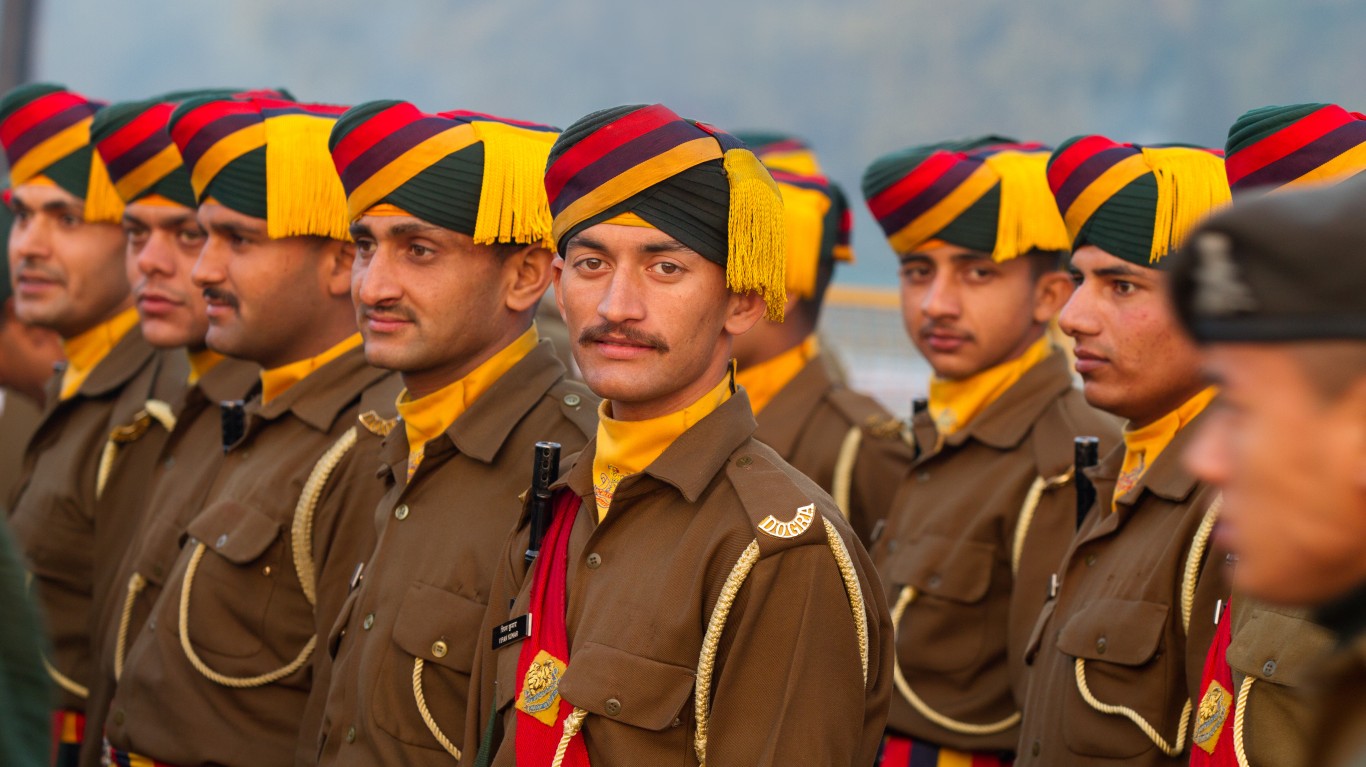
1. India
> India’s share of Russia’s total arms exports, 2013-2022: 32.84%
> Russian imports as share of India’s total arms imports, 2013-2022: 54.9%
> Top arms suppliers, 2013-2022: Russia, France, United States
> Military spending, 2022, current USD: $81.36 billion (2.43% of GDP)
Get Ready To Retire (Sponsored)
Start by taking a quick retirement quiz from SmartAsset that will match you with up to 3 financial advisors that serve your area and beyond in 5 minutes, or less.
Each advisor has been vetted by SmartAsset and is held to a fiduciary standard to act in your best interests.
Here’s how it works:
1. Answer SmartAsset advisor match quiz
2. Review your pre-screened matches at your leisure. Check out the advisors’ profiles.
3. Speak with advisors at no cost to you. Have an introductory call on the phone or introduction in person and choose whom to work with in the future
Thank you for reading! Have some feedback for us?
Contact the 24/7 Wall St. editorial team.
 24/7 Wall St.
 24/7 Wall St.
 24/7 Wall St.