
The impact of the coronavirus pandemic on the U.S. educational system was significant, causing many primary, secondary, and high school students to fall behind.
According to the latest National Assessment of Educational Progress, which regularly assesses student performance in different subjects, average reading test scores among 13-year-olds declined by 4 points on the NAEP’s long-term trends scale in the fall of the 2022-23 school year compared to the same semester in 2020. Average mathematics scores fell by 9 points in that same period of time — to the lowest in decades.
For every assessment the NAEP has released in 2022 and 2023, average scores have either declined or showed no improvement compared to previous assessments. Specifically, eighth-grade and 12th grade reading and mathematics, and eighth-grade U.S. history and civics were lower compared to 2020.
“Unfinished learning continues to weigh on students across all grades and subjects,” Denise Forte, president and CEO of The Education Trust, a nonprofit advocacy organization, told National Public Radio in June.
The test score data also found significant racial, ethnic, and gender disparities. For example, math scores fell by 13 points last fall among Black students compared to their white counterparts, representing the persistent, ongoing race and class disparities in the U.S. educational system. Girls’ math scores fell by more than boys’ compared to the 2020 assessment.
Primary and secondary school education is the foundation for academic success, but states vary greatly in the quality of their education systems. To determine the states with the best and worst schools, 24/7 Wall St. developed an index of 10 factors measuring academic performance, resources, and equality. Measures include factors such as student-teacher ratios, average Scholastic Aptitude Tests results used for college admissions, and the number of students who take Advanced Placement exams.
According to the College Board, the median average SAT score among the 50 states is 1113. While the average score in eight states — including high-population states Florida and Illinois — is less than 1000, it is above 1200 in 13 states, including Tennessee and Kentucky (No. 9 on the list). A perfect SAT score is 1600. (These are the states where students score the highest on the SAT.)
Seven of the 10 most-populated states have student-teacher ratios above the median of about 15 students per teacher. Arizona (No. 46) has the highest ratio at nearly 24 students per teacher, while California has the second most crowded classrooms at 23 students per teacher. Vermont has the lowest ratio at about 11 students per teacher. Among the top 10 most-populated states, New York (No. 4) has the smallest average classroom size of between 12 and 13 students – though New York City’s ratio is about double the statewide average.
The average annual salary for elementary and secondary public school teachers ranges from $47,162 in Mississippi to $92,222 in New York. High school graduation rates start at 82% in Nevada up to nearly 92% in Connecticut. No data on graduation rates were available from Texas, Illinois, and Washington state. (Also see: the 50 best public high schools in America.)
The state with the best school system, Massachusetts, has the highest number of Advanced Placement exams, at 709 exams per 1,000 students, nearly double the median for all 50 states.
Here are the states with the best and worst school systems.
Click here to see our detailed methodology.

50. New Mexico
> Pupil-teacher ratio: 15.2:1 (21st highest)
> Avg. SAT score: 976/1600 (5th lowest)
> Avg. annual teacher pay: $54,272 (14th lowest)
> High school graduation rate: 77.0% (6th lowest)
> AP exam rate: 245 per 1,000 upperclassmen (14th lowest)
[in-text-ad]

49. Oklahoma
> Pupil-teacher ratio: 16.2:1 (16th highest)
> Avg. SAT score: 951/1600 (2nd lowest)
> Avg. annual teacher pay: $54,804 (17th lowest)
> High school graduation rate: 79.6% (7th lowest)
> AP exam rate: 200 per 1,000 upperclassmen (6th lowest)

48. Alaska
> Pupil-teacher ratio: 17.6:1 (10th highest)
> Avg. SAT score: 1110/1600 (25th lowest)
> Avg. annual teacher pay: $73,722 (9th highest)
> High school graduation rate: 75.7% (4th lowest)
> AP exam rate: 173 per 1,000 upperclassmen (the lowest)

47. Texas
> Pupil-teacher ratio: 15.1:1 (22nd highest)
> Avg. SAT score: 1001/1600 (10th lowest)
> Avg. annual teacher pay: $58,887 (25th highest)
> High school graduation rate: N/A
> AP exam rate: 495 per 1,000 upperclassmen (12th highest)
[in-text-ad-2]

46. Arizona
> Pupil-teacher ratio: 23.6:1 (the highest)
> Avg. SAT score: 1159/1600 (18th highest)
> Avg. annual teacher pay: $54,580 (16th lowest)
> High school graduation rate: 76.9% (5th lowest)
> AP exam rate: 268 per 1,000 upperclassmen (16th lowest)

45. Washington
> Pupil-teacher ratio: 18.4:1 (7th highest)
> Avg. SAT score: 1096/1600 (24th lowest)
> Avg. annual teacher pay: $81,586 (4th highest)
> High school graduation rate: N/A
> AP exam rate: 282 per 1,000 upperclassmen (19th lowest)
[in-text-ad]

44. South Dakota
> Pupil-teacher ratio: 14.1:1 (18th lowest)
> Avg. SAT score: 1219/1600 (8th highest)
> Avg. annual teacher pay: $49,761 (2nd lowest)
> High school graduation rate: 81.6% (11th lowest)
> AP exam rate: 212 per 1,000 upperclassmen (8th lowest)
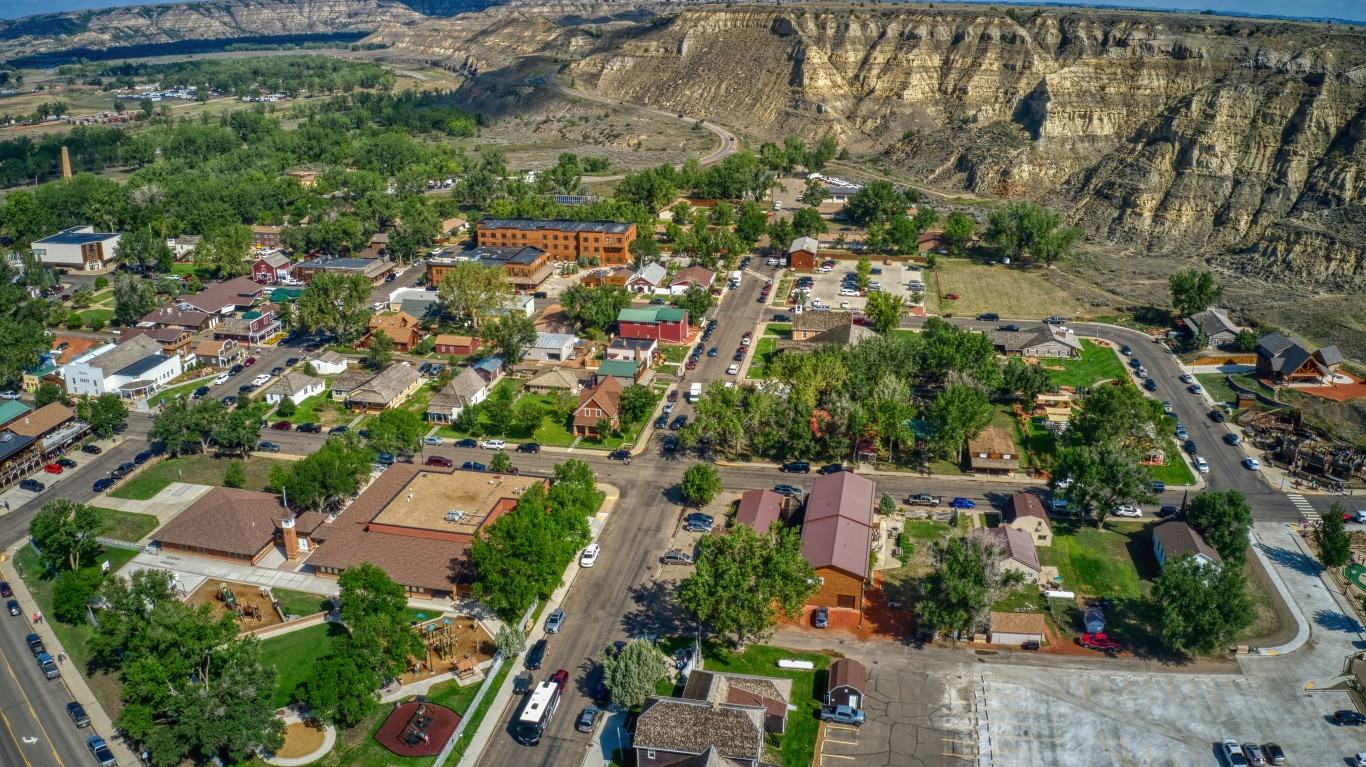
43. North Dakota
> Pupil-teacher ratio: 12.5:1 (7th lowest)
> Avg. SAT score: 1212/1600 (10th highest)
> Avg. annual teacher pay: $55,769 (19th lowest)
> High school graduation rate: 82.4% (14th lowest)
> AP exam rate: 234 per 1,000 upperclassmen (12th lowest)

42. Oregon
> Pupil-teacher ratio: 20.2:1 (4th highest)
> Avg. SAT score: 1143/1600 (20th highest)
> Avg. annual teacher pay: $69,671 (12th highest)
> High school graduation rate: 83.4% (16th lowest)
> AP exam rate: 198 per 1,000 upperclassmen (5th lowest)
[in-text-ad-2]
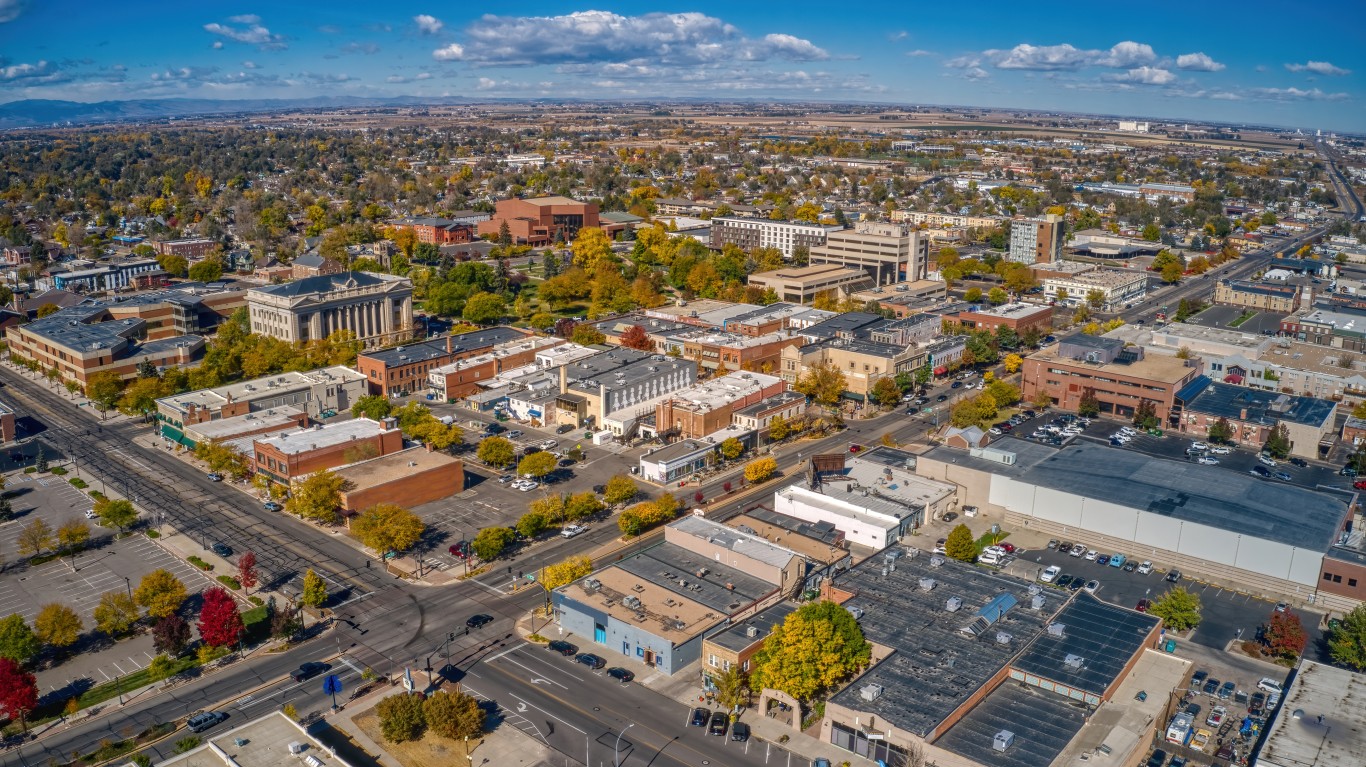
41. Colorado
> Pupil-teacher ratio: 16.9:1 (14th highest)
> Avg. SAT score: 1021/1600 (11th lowest)
> Avg. annual teacher pay: $58,481 (23rd lowest)
> High school graduation rate: 81.1% (10th lowest)
> AP exam rate: 447 per 1,000 upperclassmen (18th highest)

40. Idaho
> Pupil-teacher ratio: 18.1:1 (8th highest)
> Avg. SAT score: 986/1600 (8th lowest)
> Avg. annual teacher pay: $54,232 (13th lowest)
> High school graduation rate: 80.8% (9th lowest)
> AP exam rate: 228 per 1,000 upperclassmen (10th lowest)
[in-text-ad]

39. West Virginia
> Pupil-teacher ratio: 14.0:1 (16th lowest)
> Avg. SAT score: 938/1600 (the lowest)
> Avg. annual teacher pay: $50,315 (3rd lowest)
> High school graduation rate: 91.5% (2nd highest)
> AP exam rate: 229 per 1,000 upperclassmen (11th lowest)

38. Louisiana
> Pupil-teacher ratio: 18.4:1 (6th highest)
> Avg. SAT score: 1171/1600 (17th highest)
> Avg. annual teacher pay: $52,376 (5th lowest)
> High school graduation rate: 83.5% (17th lowest)
> AP exam rate: 272 per 1,000 upperclassmen (17th lowest)
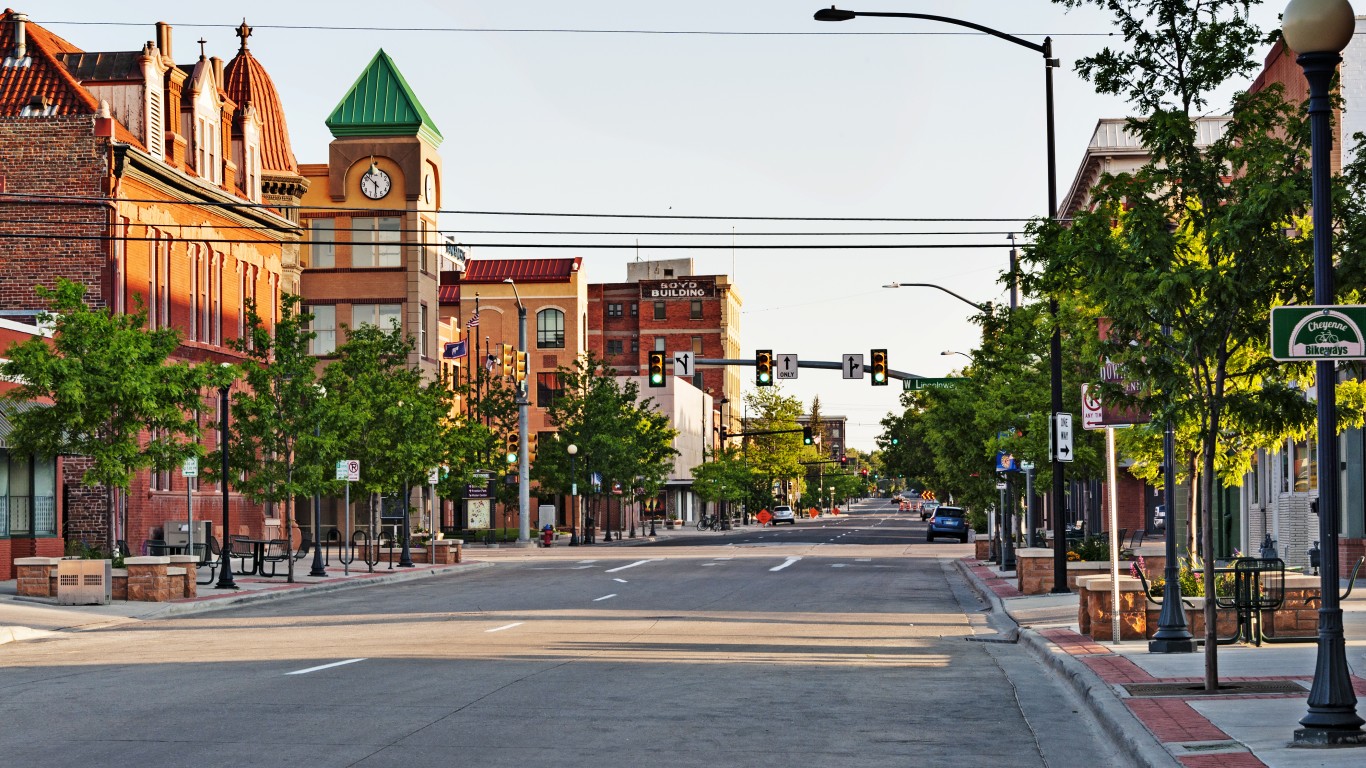
37. Wyoming
> Pupil-teacher ratio: 12.8:1 (9th lowest)
> Avg. SAT score: 1244/1600 (2nd highest)
> Avg. annual teacher pay: $60,820 (21st highest)
> High school graduation rate: 80.4% (8th lowest)
> AP exam rate: 202 per 1,000 upperclassmen (7th lowest)
[in-text-ad-2]
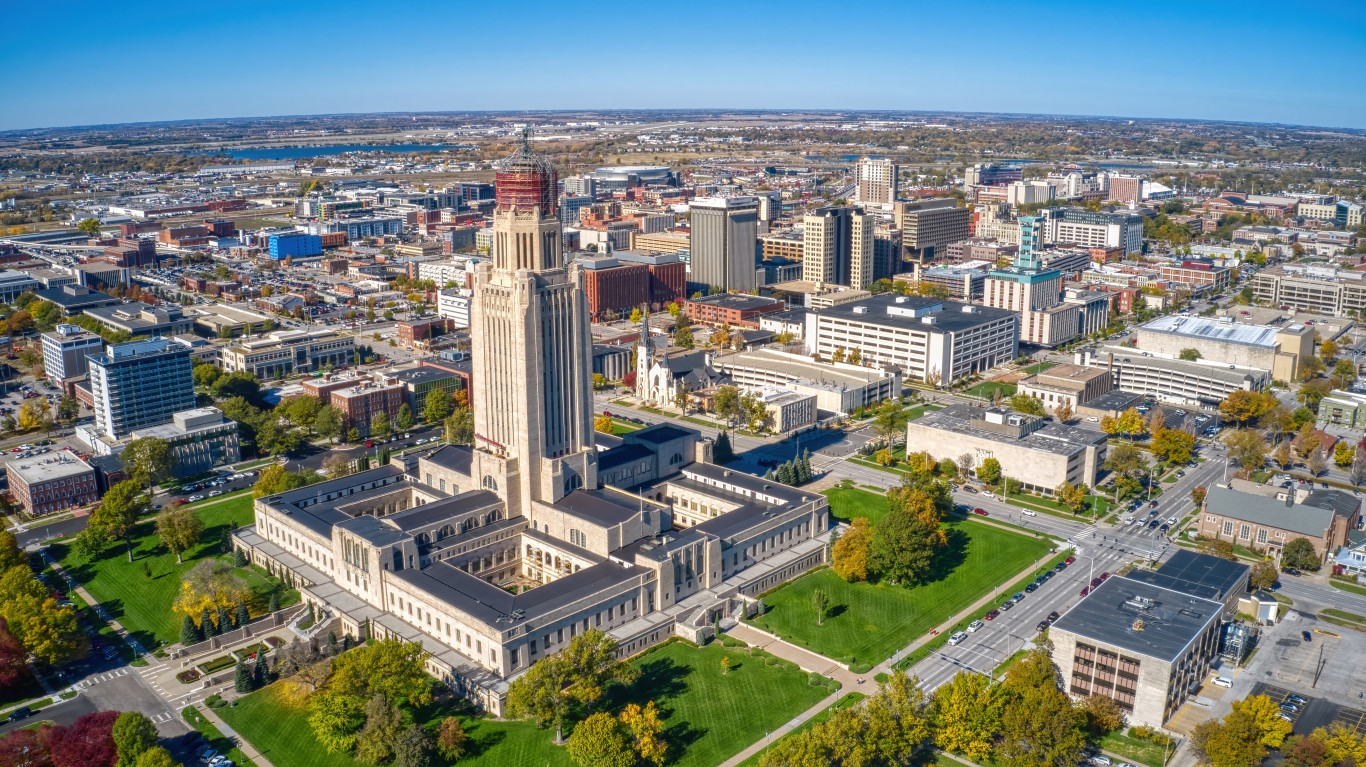
36. Nebraska
> Pupil-teacher ratio: 13.7:1 (14th lowest)
> Avg. SAT score: 1222/1600 (7th highest)
> Avg. annual teacher pay: $57,420 (21st lowest)
> High school graduation rate: 84.1% (19th lowest)
> AP exam rate: 221 per 1,000 upperclassmen (9th lowest)

35. South Carolina
> Pupil-teacher ratio: 14.7:1 (23rd lowest)
> Avg. SAT score: 1030/1600 (13th lowest)
> Avg. annual teacher pay: $53,393 (8th lowest)
> High school graduation rate: 84.4% (20th lowest)
> AP exam rate: 370 per 1,000 upperclassmen (24th highest)
[in-text-ad]

34. Michigan
> Pupil-teacher ratio: 17.6:1 (11th highest)
> Avg. SAT score: 1000/1600 (9th lowest)
> Avg. annual teacher pay: $65,198 (16th highest)
> High school graduation rate: 85.5% (25th lowest)
> AP exam rate: 351 per 1,000 upperclassmen (24th lowest)

33. Illinois
> Pupil-teacher ratio: 14.6:1 (22nd lowest)
> Avg. SAT score: 981/1600 (6th lowest)
> Avg. annual teacher pay: $72,301 (10th highest)
> High school graduation rate: N/A
> AP exam rate: 539 per 1,000 upperclassmen (10th highest)
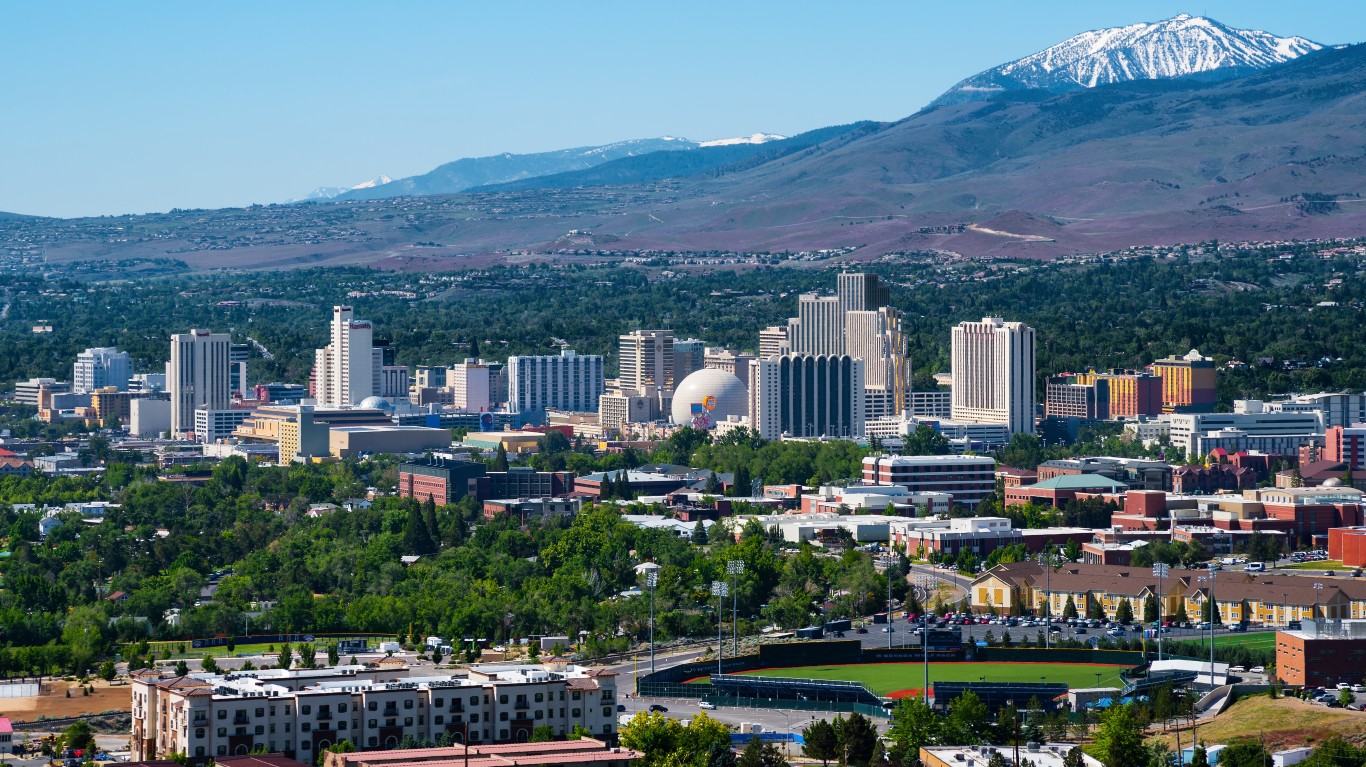
32. Nevada
> Pupil-teacher ratio: 19.5:1 (5th highest)
> Avg. SAT score: 1172/1600 (16th highest)
> Avg. annual teacher pay: $57,804 (22nd lowest)
> High school graduation rate: 82.1% (13th lowest)
> AP exam rate: 337 per 1,000 upperclassmen (22nd lowest)
[in-text-ad-2]

31. Ohio
> Pupil-teacher ratio: 15.9:1 (18th highest)
> Avg. SAT score: 1053/1600 (15th lowest)
> Avg. annual teacher pay: $63,153 (17th highest)
> High school graduation rate: 84.8% (22nd lowest)
> AP exam rate: 426 per 1,000 upperclassmen (20th highest)

30. Mississippi
> Pupil-teacher ratio: 14.8:1 (24th lowest)
> Avg. SAT score: 1226/1600 (5th highest)
> Avg. annual teacher pay: $47,162 (the lowest)
> High school graduation rate: 87.6% (19th highest)
> AP exam rate: 188 per 1,000 upperclassmen (4th lowest)
[in-text-ad]

29. Delaware
> Pupil-teacher ratio: 14.4:1 (20th lowest)
> Avg. SAT score: 968/1600 (3rd lowest)
> Avg. annual teacher pay: $65,647 (15th highest)
> High school graduation rate: 88.8% (13th highest)
> AP exam rate: 488 per 1,000 upperclassmen (15th highest)

28. Alabama
> Pupil-teacher ratio: 17.7:1 (9th highest)
> Avg. SAT score: 1146/1600 (19th highest)
> Avg. annual teacher pay: $55,834 (20th lowest)
> High school graduation rate: 90.1% (6th highest)
> AP exam rate: 404 per 1,000 upperclassmen (21st highest)

27. Rhode Island
> Pupil-teacher ratio: 13.4:1 (12th lowest)
> Avg. SAT score: 971/1600 (4th lowest)
> Avg. annual teacher pay: $76,852 (7th highest)
> High school graduation rate: 85.8% (25th highest)
> AP exam rate: 489 per 1,000 upperclassmen (14th highest)
[in-text-ad-2]
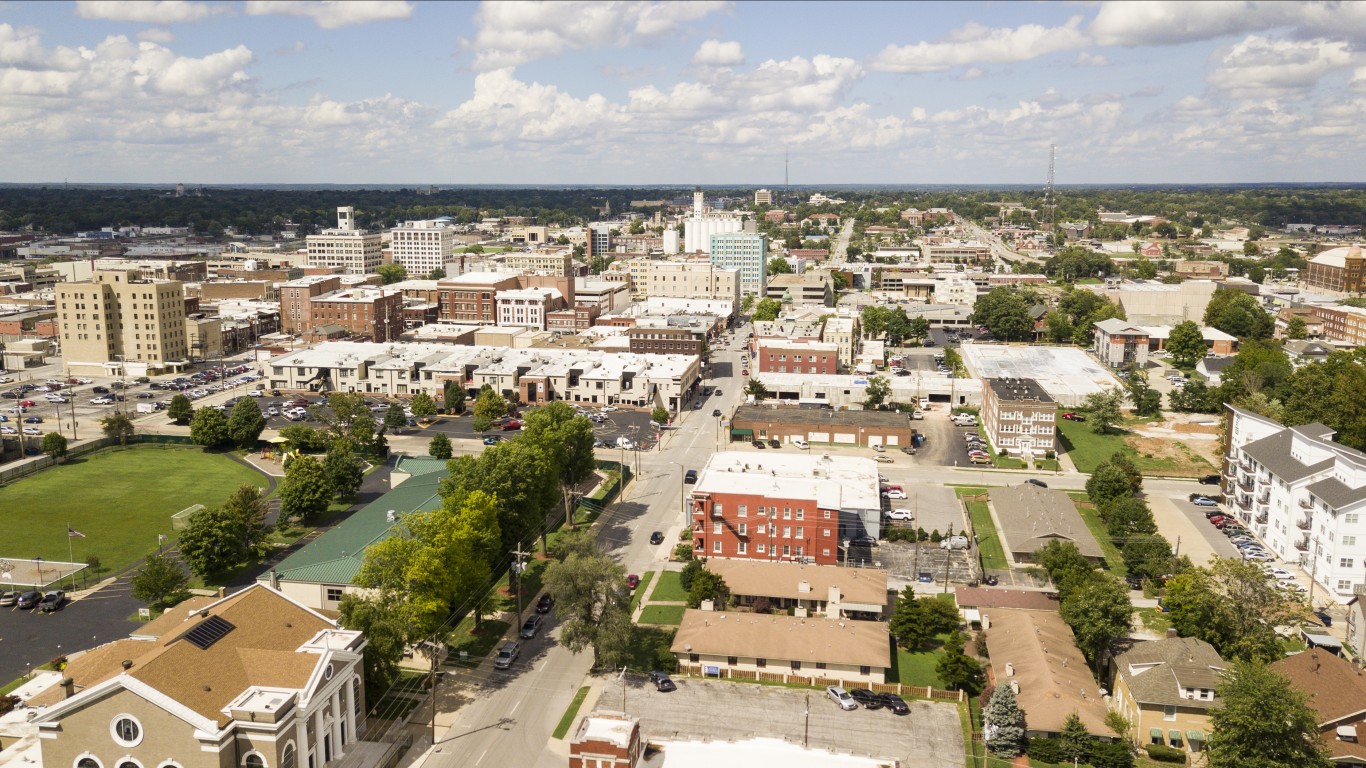
26. Missouri
> Pupil-teacher ratio: 13.2:1 (11th lowest)
> Avg. SAT score: 1200/1600 (12th highest)
> Avg. annual teacher pay: $52,481 (6th lowest)
> High school graduation rate: 89.5% (10th highest)
> AP exam rate: 262 per 1,000 upperclassmen (15th lowest)
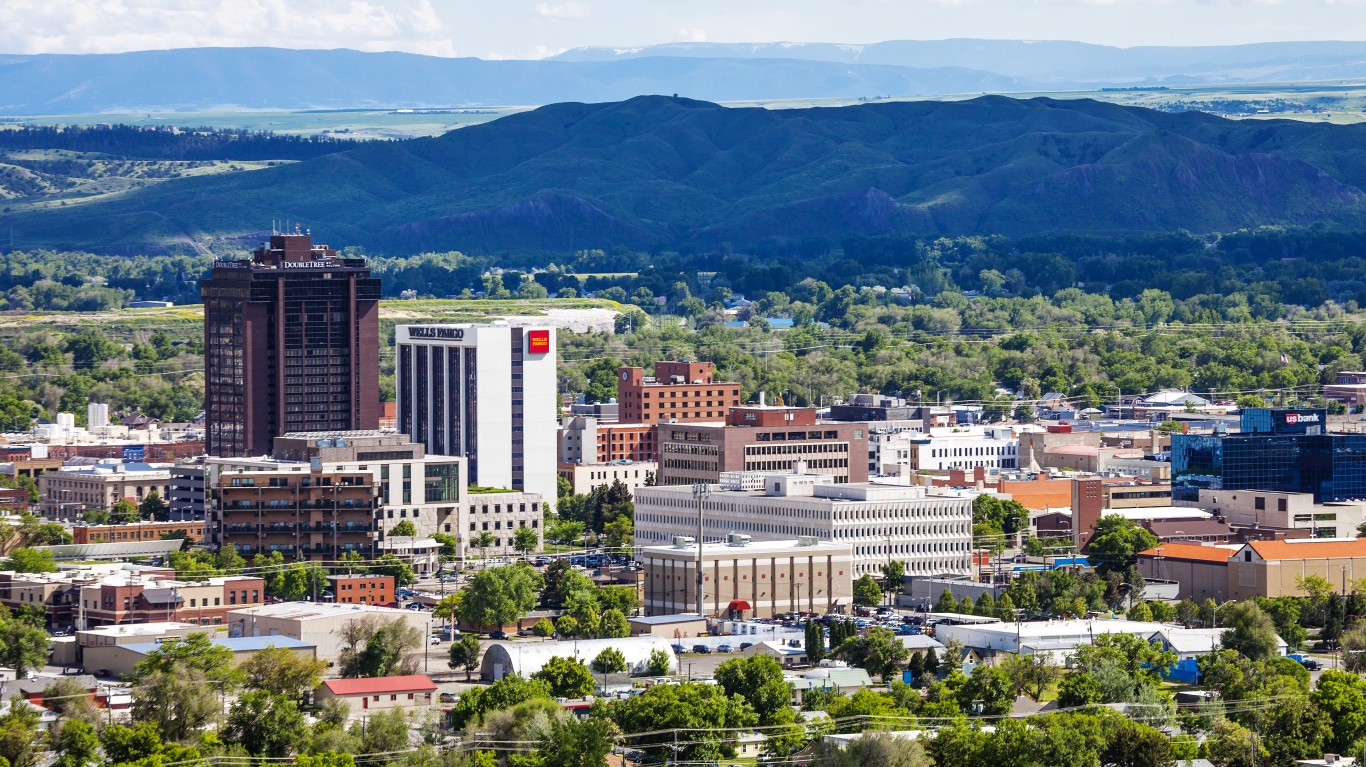
25. Montana
> Pupil-teacher ratio: 14.0:1 (17th lowest)
> Avg. SAT score: 1206/1600 (11th highest)
> Avg. annual teacher pay: $53,628 (10th lowest)
> High school graduation rate: 82.1% (12th lowest)
> AP exam rate: 245 per 1,000 upperclassmen (14th lowest)
[in-text-ad]

24. Florida
> Pupil-teacher ratio: 17.2:1 (12th highest)
> Avg. SAT score: 983/1600 (7th lowest)
> Avg. annual teacher pay: $51,230 (4th lowest)
> High school graduation rate: 89.8% (8th highest)
> AP exam rate: 609 per 1,000 upperclassmen (5th highest)

23. California
> Pupil-teacher ratio: 23.0:1 (2nd highest)
> Avg. SAT score: 1115/1600 (25th highest)
> Avg. annual teacher pay: $87,275 (3rd highest)
> High school graduation rate: 84.5% (21st lowest)
> AP exam rate: 570 per 1,000 upperclassmen (8th highest)

22. Minnesota
> Pupil-teacher ratio: 16.1:1 (17th highest)
> Avg. SAT score: 1225/1600 (6th highest)
> Avg. annual teacher pay: $68,491 (13th highest)
> High school graduation rate: 83.5% (18th lowest)
> AP exam rate: 315 per 1,000 upperclassmen (21st lowest)
[in-text-ad-2]

21. North Carolina
> Pupil-teacher ratio: 15.5:1 (20th highest)
> Avg. SAT score: 1136/1600 (21st highest)
> Avg. annual teacher pay: $53,644 (11th lowest)
> High school graduation rate: 86.6% (21st highest)
> AP exam rate: 513 per 1,000 upperclassmen (11th highest)

20. Maine
> Pupil-teacher ratio: 12.2:1 (4th lowest)
> Avg. SAT score: 1081/1600 (21st lowest)
> Avg. annual teacher pay: $58,757 (25th lowest)
> High school graduation rate: 86.0% (23rd highest)
> AP exam rate: 353 per 1,000 upperclassmen (25th lowest)
[in-text-ad]

19. Kansas
> Pupil-teacher ratio: 13.6:1 (13th lowest)
> Avg. SAT score: 1238/1600 (3rd highest)
> Avg. annual teacher pay: $54,815 (18th lowest)
> High school graduation rate: 86.5% (22nd highest)
> AP exam rate: 175 per 1,000 upperclassmen (2nd lowest)

18. Georgia
> Pupil-teacher ratio: 15.0:1 (23rd highest)
> Avg. SAT score: 1060/1600 (16th lowest)
> Avg. annual teacher pay: $61,249 (20th highest)
> High school graduation rate: 84.9% (23rd lowest)
> AP exam rate: 460 per 1,000 upperclassmen (16th highest)

17. New Hampshire
> Pupil-teacher ratio: 12.1:1 (3rd lowest)
> Avg. SAT score: 1050/1600 (14th lowest)
> Avg. annual teacher pay: $62,783 (19th highest)
> High school graduation rate: 87.7% (18th highest)
> AP exam rate: 350 per 1,000 upperclassmen (23rd lowest)
[in-text-ad-2]

16. Vermont
> Pupil-teacher ratio: 10.8:1 (the lowest)
> Avg. SAT score: 1095/1600 (23rd lowest)
> Avg. annual teacher pay: $62,866 (18th highest)
> High school graduation rate: 82.6% (15th lowest)
> AP exam rate: 384 per 1,000 upperclassmen (23rd highest)

15. Utah
> Pupil-teacher ratio: 22.6:1 (3rd highest)
> Avg. SAT score: 1233/1600 (4th highest)
> Avg. annual teacher pay: $58,619 (24th lowest)
> High school graduation rate: 88.2% (15th highest)
> AP exam rate: 282 per 1,000 upperclassmen (19th lowest)
[in-text-ad]

14. Iowa
> Pupil-teacher ratio: 14.5:1 (21st lowest)
> Avg. SAT score: 1196/1600 (14th highest)
> Avg. annual teacher pay: $59,262 (24th highest)
> High school graduation rate: 90.0% (7th highest)
> AP exam rate: 188 per 1,000 upperclassmen (4th lowest)

13. Indiana
> Pupil-teacher ratio: 17.0:1 (13th highest)
> Avg. SAT score: 1073/1600 (18th lowest)
> Avg. annual teacher pay: $54,126 (12th lowest)
> High school graduation rate: 90.5% (5th highest)
> AP exam rate: 439 per 1,000 upperclassmen (19th highest)

12. Tennessee
> Pupil-teacher ratio: 15.7:1 (19th highest)
> Avg. SAT score: 1200/1600 (12th highest)
> Avg. annual teacher pay: $53,619 (9th lowest)
> High school graduation rate: 89.8% (9th highest)
> AP exam rate: 358 per 1,000 upperclassmen (25th highest)
[in-text-ad-2]

11. Hawaii
> Pupil-teacher ratio: 14.8:1 (25th highest)
> Avg. SAT score: 1124/1600 (23rd highest)
> Avg. annual teacher pay: $67,000 (14th highest)
> High school graduation rate: 86.0% (24th highest)
> AP exam rate: 542 per 1,000 upperclassmen (9th highest)

10. Maryland
> Pupil-teacher ratio: 14.8:1 (25th lowest)
> Avg. SAT score: 1075/1600 (19th lowest)
> Avg. annual teacher pay: $75,766 (8th highest)
> High school graduation rate: 86.8% (20th highest)
> AP exam rate: 591 per 1,000 upperclassmen (6th highest)
[in-text-ad]

9. Kentucky
> Pupil-teacher ratio: 16.4:1 (15th highest)
> Avg. SAT score: 1219/1600 (8th highest)
> Avg. annual teacher pay: $54,574 (15th lowest)
> High school graduation rate: 90.9% (4th highest)
> AP exam rate: 298 per 1,000 upperclassmen (20th lowest)

8. Arkansas
> Pupil-teacher ratio: 12.9:1 (10th lowest)
> Avg. SAT score: 1191/1600 (15th highest)
> Avg. annual teacher pay: $52,486 (7th lowest)
> High school graduation rate: 88.2% (16th highest)
> AP exam rate: 493 per 1,000 upperclassmen (13th highest)

7. Pennsylvania
> Pupil-teacher ratio: 13.9:1 (15th lowest)
> Avg. SAT score: 1091/1600 (22nd lowest)
> Avg. annual teacher pay: $72,248 (11th highest)
> High school graduation rate: 88.1% (17th highest)
> AP exam rate: 394 per 1,000 upperclassmen (22nd highest)
[in-text-ad-2]

6. Wisconsin
> Pupil-teacher ratio: 14.3:1 (19th lowest)
> Avg. SAT score: 1252/1600 (the highest)
> Avg. annual teacher pay: $60,453 (22nd highest)
> High school graduation rate: 89.0% (12th highest)
> AP exam rate: 452 per 1,000 upperclassmen (17th highest)

5. Virginia
> Pupil-teacher ratio: 14.9:1 (24th highest)
> Avg. SAT score: 1124/1600 (23rd highest)
> Avg. annual teacher pay: $59,965 (23rd highest)
> High school graduation rate: 88.7% (14th highest)
> AP exam rate: 578 per 1,000 upperclassmen (7th highest)
[in-text-ad]

4. New York
> Pupil-teacher ratio: 12.4:1 (6th lowest)
> Avg. SAT score: 1067/1600 (17th lowest)
> Avg. annual teacher pay: $92,222 (the highest)
> High school graduation rate: 85.1% (24th lowest)
> AP exam rate: 660 per 1,000 upperclassmen (4th highest)

3. Connecticut
> Pupil-teacher ratio: 12.4:1 (5th lowest)
> Avg. SAT score: 1025/1600 (12th lowest)
> Avg. annual teacher pay: $81,185 (5th highest)
> High school graduation rate: 91.6% (the highest)
> AP exam rate: 667 per 1,000 upperclassmen (3rd highest)

2. New Jersey
> Pupil-teacher ratio: 12.1:1 (2nd lowest)
> Avg. SAT score: 1079/1600 (20th lowest)
> Avg. annual teacher pay: $79,045 (6th highest)
> High school graduation rate: 91.0% (3rd highest)
> AP exam rate: 679 per 1,000 upperclassmen (2nd highest)
[in-text-ad-2]

1. Massachusetts
> Pupil-teacher ratio: 12.8:1 (8th lowest)
> Avg. SAT score: 1129/1600 (22nd highest)
> Avg. annual teacher pay: $88,903 (2nd highest)
> High school graduation rate: 89.4% (11th highest)
> AP exam rate: 709 per 1,000 upperclassmen (the highest)
Methodology
To determine the states with the best and worst schools, 24/7 Wall St. developed an index of 10 factors measuring academic performance, resources, and equality. The index consists of:
- The percentage of eighth graders who scored at or above proficient on the 2022 National Assessment of Educational Progress mathematics exam, from the National Center of Education Statistics.
- The percentage of eighth graders who scored at or above proficient on the 2022 National Assessment of Educational Progress reading exam, from the National Center of Education Statistics.
- The high school graduation rate for the 2019-2020 academic year, from the U.S. Department of Education.
- The high school graduation rate for economically disadvantaged students for the 2019-2020 academic year, from the U.S. Department of Education.
- The average SAT score among the class of 2022, from the College Board SAT Suite of Assessments.
- The difference between the average SAT score among the class of 2022 for students in the highest quintile of family income and the average SAT score among the class of 2022 for students in the lowest quintile of family income, calculated with data from the College Board SAT Suite of Assessments.
- The number of public high schools ranking among Niche’s 2023 Best Public High Schools in America list, adjusted for population, using data from the U.S. Census Bureau.
- The ratio of public elementary and secondary teachers to pupils in fall 2019, from the National Center of Education Statistics.
- Average annual pay for public elementary and secondary teachers in the 2021-2022 academic year as a percentage of average annual pay for all occupations, calculated using data from the U.S. Department of Education and Bureau of Labor Statistics’ Occupational Employment and Wage Statistics program.
- The number of AP Exams taken per 1,000 11th and 12th graders in 2021, from the College Board.
All data is for the most recent period available.
Take Charge of Your Retirement In Just A Few Minutes (Sponsor)
Retirement planning doesn’t have to feel overwhelming. The key is finding expert guidance—and SmartAsset’s made it easier than ever for you to connect with a vetted financial advisor.
Here’s how it works:
- Answer a Few Simple Questions. Tell us a bit about your goals and preferences—it only takes a few minutes!
- Get Matched with Vetted Advisors Our smart tool matches you with up to three pre-screened, vetted advisors who serve your area and are held to a fiduciary standard to act in your best interests. Click here to begin
- Choose Your Fit Review their profiles, schedule an introductory call (or meet in person), and select the advisor who feel is right for you.
Why wait? Start building the retirement you’ve always dreamed of. Click here to get started today!
Thank you for reading! Have some feedback for us?
Contact the 24/7 Wall St. editorial team.
 24/7 Wall St.
 24/7 Wall St.
 24/7 Wall St.
 24/7 Wall St.
 24/7 Wall St.
