Special Report
The 23 Cities With The Most Expensive Rent in America, Ranked

Published:

Personal finance advisors and columnists often recommend that no more than 25% to 30% of your take-home pay should go to your landlord. Based on this general rule of thumb, if your income is $40,000 a year, your monthly rent should not exceed $1,000 a month.
But Americans would be hard pressed in many U.S. cities to keep their rental costs within this ideal limit, and this is increasingly becoming a harsh reality even in mid-sized cities thanks to a nationwide housing crunch. A limited supply of rental properties disproportionately hammers lower-income renters competing for an insufficient amount of available stock.
“Affordability is particularly a critical issue for renters in markets such as Miami, Los Angeles, New Orleans, Orlando, Riverside, and San Diego,” says a report from 2022 released by two housing groups, National Apartment Association and the National Multifamily Housing Council. The report identifies how many renter households fork out 35% or more of their gross incomes to keep a roof over their heads in different U.S. cities.
To determine American Cities Where Renting is Least Affordable, 24/7 Wall St. reviewed U.S. Apartment Demand Through 2035, a 2022 report prepared by Hoyt Advisory Services and Eigen 10 Advisors for the two housing groups. Cities are ranked by their affordability rank from the report, which largely corresponds to the percentage of renter households that paid 35% or more of their gross income on rent in 2020. Only the 23 cities where at least 40% of households pay 35% or more of their income on rent are included. Population figures are from the U.S. Census Bureau 2021 American Community Survey.
These cities do not necessarily have the highest rent among metro areas of the country, but rent compared to income is high. New York and Los Angeles, long known for notoriously high rents, are on the list, along with New Orleans and Albuquerque, New Mexico, where rents are lower. Other cities where affordability is a critical issue for renters include Miami, Orlando, Riverside, and San Diego – where 45% or more of renters spend 35% or more of income on rent. (These are the states with the most unsheltered homeless people.)
Affordability issues can also be caused by a limited supply of rental properties for people in lower-income brackets. “New supply tends to focus on the upper echelon of the market which is already unaffordable to many renters,” the report says. The strong housing markets in recent years also enticed many smaller rental property owners to sell, and these properties were sometimes converted to owned properties, “thus further reducing rental stock at the low end of the market.” (Here are the best cities to rent new apartments.)
Providing relief to people paying such high shares of their incomes on rent is a complicated challenge, in part because homeowners often oppose the development of multi-family units or affordable housing near them out of fear it would drive down the value of their owned properties.
Here are America’s most expensive cities for renters.

23. Baltimore, MD
> Renter households paying at least 35% of income on rent, 2020: 40%
> Metro area population, 2021: 2,838,327
[in-text-ad]

22. Denver, CO
> Renter households paying at least 35% of income on rent, 2020: 40%
> Metro area population, 2021: 2,972,567

21. Atlanta, GA
> Renter households paying at least 35% of income on rent, 2020: 40%
> Metro area population, 2021: 6,144,970

20. San Antonio, TX
> Renter households paying at least 35% of income on rent, 2020: 40%
> Metro area population, 2021: 2,601,788
[in-text-ad-2]

19. Detroit, MI
> Renter households paying at least 35% of income on rent, 2020: 40%
> Metro area population, 2021: 4,365,205

18. Houston, TX
> Renter households paying at least 35% of income on rent, 2020: 40%
> Metro area population, 2021: 7,206,841
[in-text-ad]

17. Richmond, VA
> Renter households paying at least 35% of income on rent, 2020: 40%
> Metro area population, 2021: 1,317,525

16. Portland, OR
> Renter households paying at least 35% of income on rent, 2020: 41%
> Metro area population, 2021: 2,510,696

15. Virginia Beach, VA
> Renter households paying at least 35% of income on rent, 2020: 41%
> Metro area population, 2021: 1,806,423
[in-text-ad-2]

14. Philadelphia, PA
> Renter households paying at least 35% of income on rent, 2020: 41%
> Metro area population, 2021: 6,228,601

13. Albuquerque, NM
> Renter households paying at least 35% of income on rent, 2020: 42%
> Metro area population, 2021: 921,311
[in-text-ad]

12. Las Vegas, NV
> Renter households paying at least 35% of income on rent, 2020: 42%
> Metro area population, 2021: 2,292,476

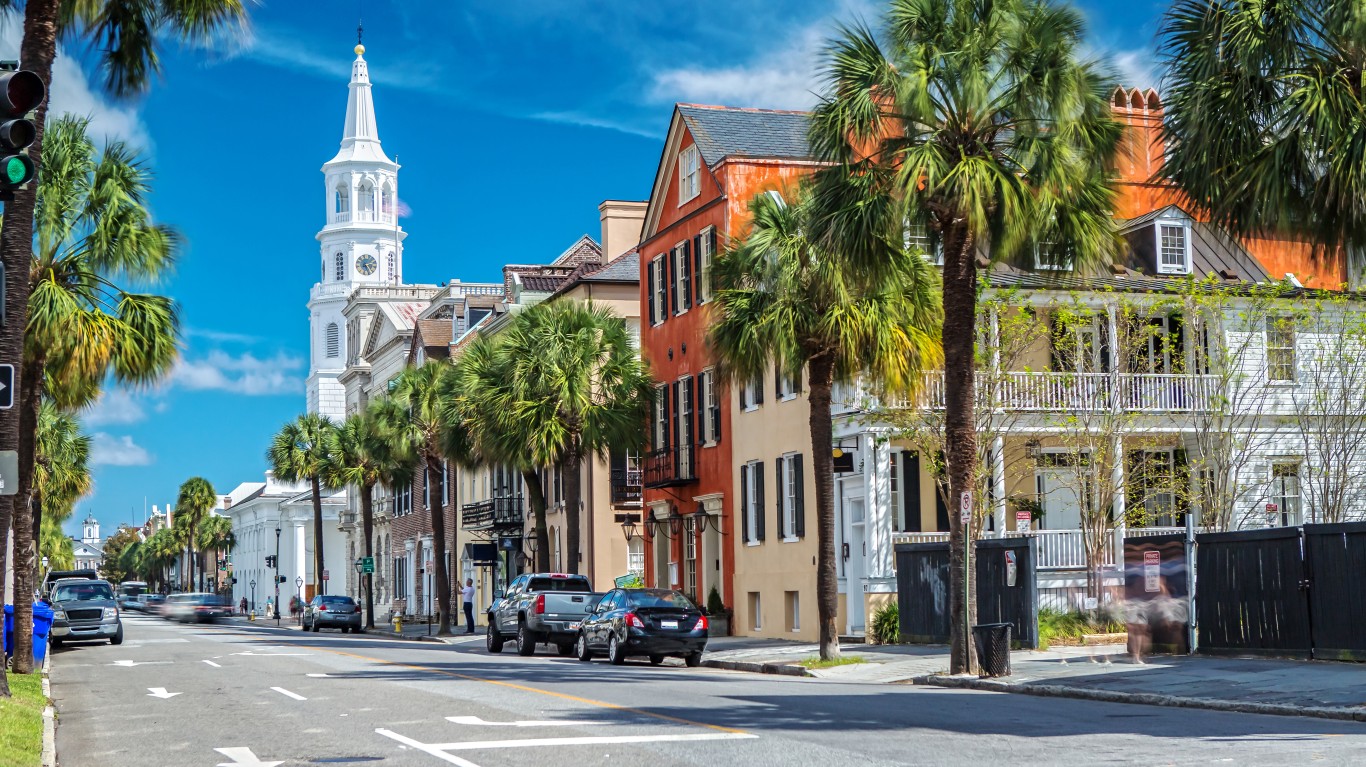
11. Charleston, SC
> Renter households paying at least 35% of income on rent, 2020: 43%
> Metro area population, 2021: 813,052

10. Memphis, TN
> Renter households paying at least 35% of income on rent, 2020: 43%
> Metro area population, 2021: 1,336,438
[in-text-ad-2]

9. New York, NY
> Renter households paying at least 35% of income on rent, 2020: 43%
> Metro area population, 2021: 19,768,458

8. Sacramento, CA
> Renter households paying at least 35% of income on rent, 2020: 44%
> Metro area population, 2021: 2,411,428
[in-text-ad]

7. Tampa, FL
> Renter households paying at least 35% of income on rent, 2020: 44%
> Metro area population, 2021: 3,219,514

6. Orlando, FL
> Renter households paying at least 35% of income on rent, 2020: 45%
> Metro area population, 2021: 2,691,925

5. New Orleans, LA
> Renter households paying at least 35% of income on rent, 2020: 47%
> Metro area population, 2021: 1,261,726
[in-text-ad-2]

4. San Diego, CA
> Renter households paying at least 35% of income on rent, 2020: 47%
> Metro area population, 2021: 3,286,069

3. Los Angeles, CA
> Renter households paying at least 35% of income on rent, 2020: 47%
> Metro area population, 2021: 12,997,353
[in-text-ad]

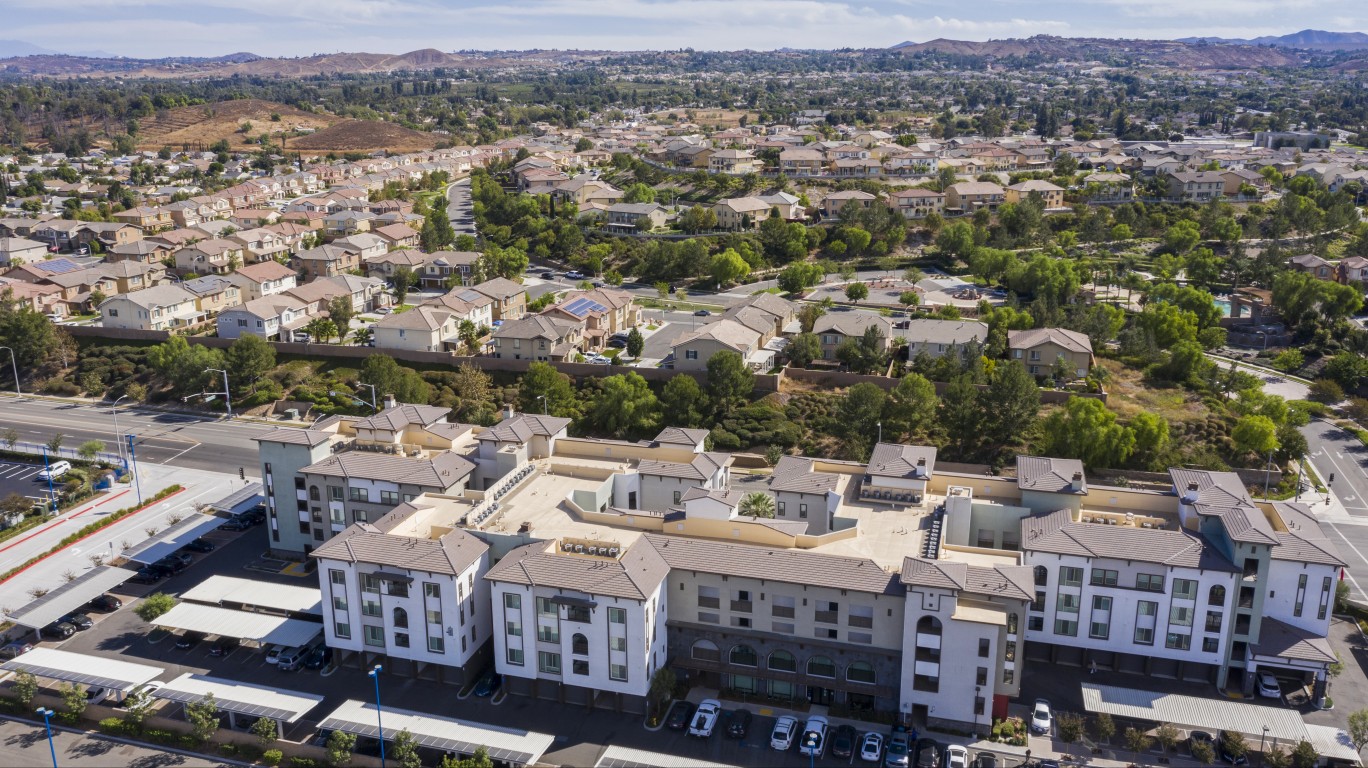
2. Riverside, CA
> Renter households paying at least 35% of income on rent, 2020: 48%
> Metro area population, 2021: 4,653,105

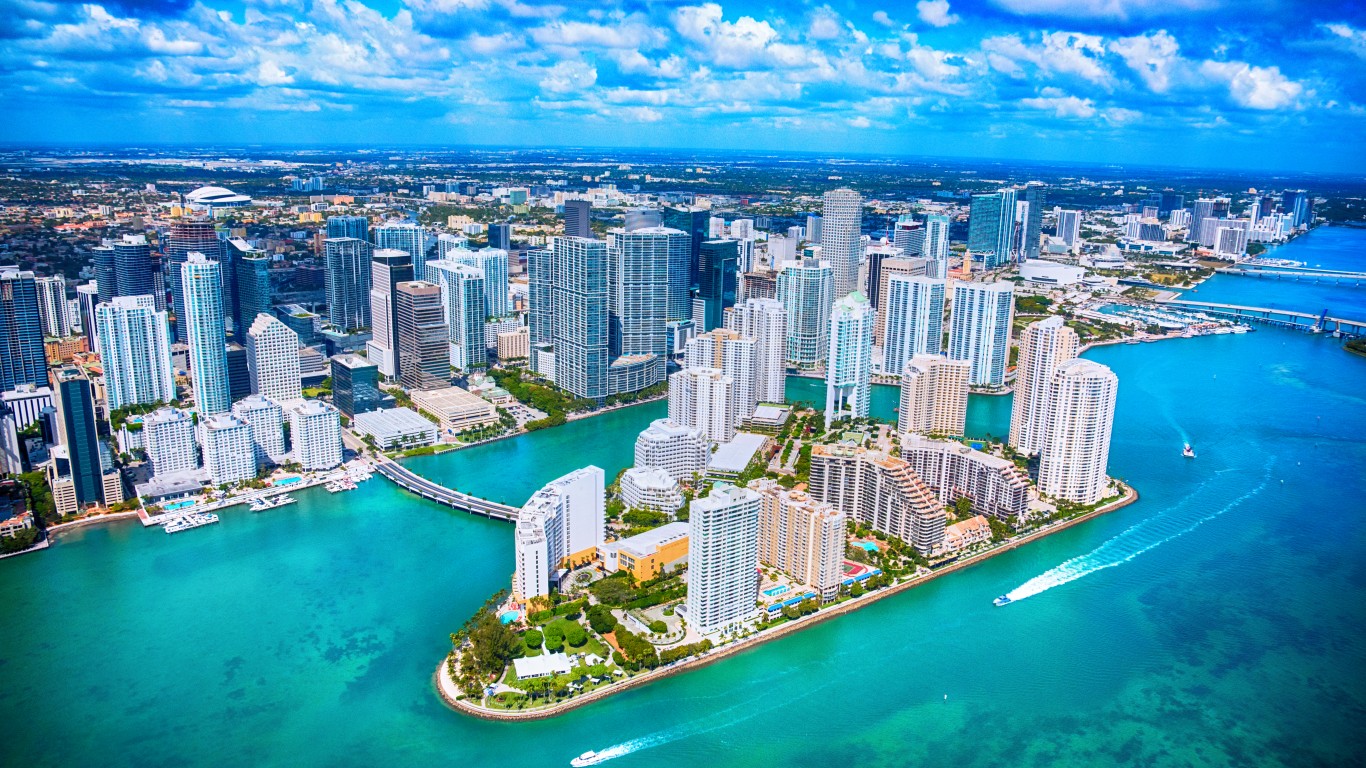
1. Miami-Fort Lauderdale-West Palm Beach, FL
> Renter households paying at least 35% of income on rent, 2020: 53%
> Metro area population, 2021: 6,091,747
The thought of burdening your family with a financial disaster is most Americans’ nightmare. However, recent studies show that over 100 million Americans still don’t have proper life insurance in the event they pass away.
Life insurance can bring peace of mind – ensuring your loved ones are safeguarded against unforeseen expenses and debts. With premiums often lower than expected and a variety of plans tailored to different life stages and health conditions, securing a policy is more accessible than ever.
A quick, no-obligation quote can provide valuable insight into what’s available and what might best suit your family’s needs. Life insurance is a simple step you can take today to help secure peace of mind for your loved ones tomorrow.
Click here to learn how to get a quote in just a few minutes.
Thank you for reading! Have some feedback for us?
Contact the 24/7 Wall St. editorial team.