Special Report
States Where the Biden Policies Could Create the Most Jobs
Published:

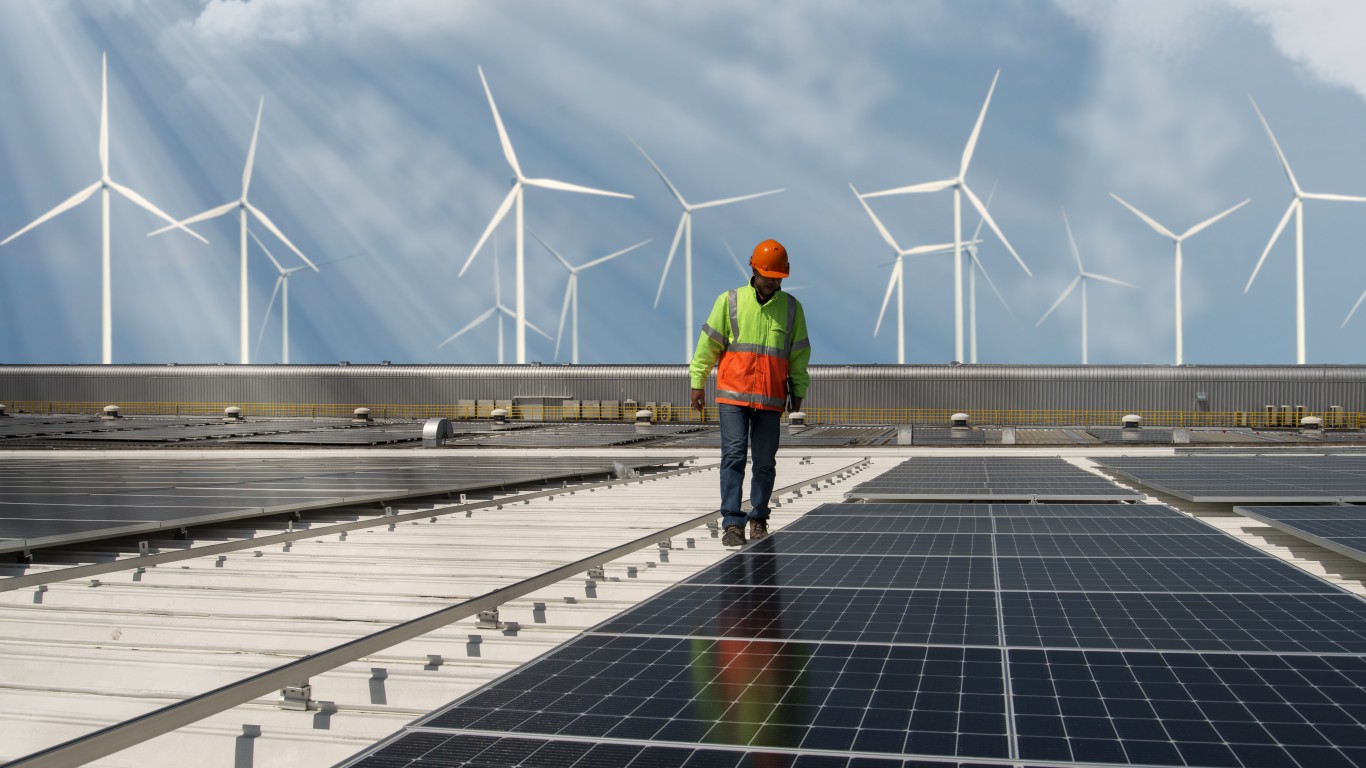
After narrowly passing through a Democratically controlled Congress along party lines, President Joe Biden signed the Inflation Reduction Act into law on Aug. 16, 2022. The law allocates $500 billion in new spending. While it may marginally reduce inflation over the long term, its largest impact will likely be on the U.S. energy grid, as most of the money in it is slated for clean energy initiatives.
Through a range of federal subsidies, including rebates, loans, and tax credits, the IRA provides incentives to households, businesses, and state and local governments to invest in clean energy while moving away from fossil fuels. With nearly $370 billion in clean energy funding, the act marks the most significant action the U.S. has ever taken toward addressing climate change.
Not only could the IRA result in a 40% to 50% reduction in America’s greenhouse gas emissions, as Democrats in Washington have argued, but it could also be a boon for the job market — particularly in hard-hit sectors, like manufacturing.
Based on reports from different sources, in the first six months after the IRA passed, there were over 100,000 new clean energy jobs nationwide — and that number could exceed 9 million over the next decade. According to the independent, nonprofit clean energy advocacy group, Rocky Mountain Institute, the IRA could create over 1.3 million new jobs in 2030 alone.
Using data from the Rocky Mountain Institute’s report, The Economic Tides Just Turned for States, 24/7 Wall St. identified the states where Biden’s Inflation Reduction Act will create the most jobs. States are ranked by the estimated potential number of new jobs created by the IRA in the year 2030, adjusted for population. Alaska and Hawaii are not included in this analysis. A full explanation of the Rocky Mountain Institute’s methodology is available here.
According to the report, depending on the state, the IRA could create anywhere from 2,000 to 140,000 jobs (measured in job-years) in 2030. Accounting for population, the number of new jobs in 2030 ranges by state from about one for every 250 people to one for every 320 people. Compared against 2022 annual unemployment figures from the Bureau of Labor Statistics, these new jobs could reduce the current number of unemployed by anywhere from 14% to 36%, depending on the state. (Here is a look at the cities that will add the most jobs by 2060, according to economists.)
Some of the states that could add the most clean energy jobs in 2030 currently rely heavily on energy from fossil fuels. North Dakota, a state that could add one new job for every 258 people in 2030, produced nearly 73 metric tons of energy-related carbon dioxide pollution per person in 2021, according to the Energy Information Administration. That is over 390% more than the national average. (Here is a look at the worst states driving the climate crisis.)
Click here to see states here the Biden policies could create the most jobs.

48. West Virginia
> Potential jobs created under Inflation Reduction Act in 2030: 1 for every 319 people (5,587 total)
> Potential new jobs as a share of current unemployed population: 18.2%
> Unemployed population in 2022: 30,662 (3.9% of labor force)
> Energy-related carbon dioxide emissions in 2021: 49.5 metric tons per person (234.5% higher than avg.)
[in-text-ad]
47. Mississippi
> Potential jobs created under Inflation Reduction Act in 2030: 1 for every 307 people (9,628 total)
> Potential new jobs as a share of current unemployed population: 19.6%
> Unemployed population in 2022: 49,142 (3.9% of labor force)
> Energy-related carbon dioxide emissions in 2021: 21.4 metric tons per person (44.4% higher than avg.)

46. Illinois
> Potential jobs created under Inflation Reduction Act in 2030: 1 for every 307 people (41,694 total)
> Potential new jobs as a share of current unemployed population: 14.1%
> Unemployed population in 2022: 295,787 (4.6% of labor force)
> Energy-related carbon dioxide emissions in 2021: 14.5 metric tons per person (1.9% lower than avg.)
45. Connecticut
> Potential jobs created under Inflation Reduction Act in 2030: 1 for every 303 people (11,904 total)
> Potential new jobs as a share of current unemployed population: 14.8%
> Unemployed population in 2022: 80,470 (4.2% of labor force)
> Energy-related carbon dioxide emissions in 2021: 10.1 metric tons per person (31.8% lower than avg.)
[in-text-ad-2]
44. Michigan
> Potential jobs created under Inflation Reduction Act in 2030: 1 for every 300 people (33,761 total)
> Potential new jobs as a share of current unemployed population: 16.6%
> Unemployed population in 2022: 203,427 (4.2% of labor force)
> Energy-related carbon dioxide emissions in 2021: 14.7 metric tons per person (0.5% lower than avg.)
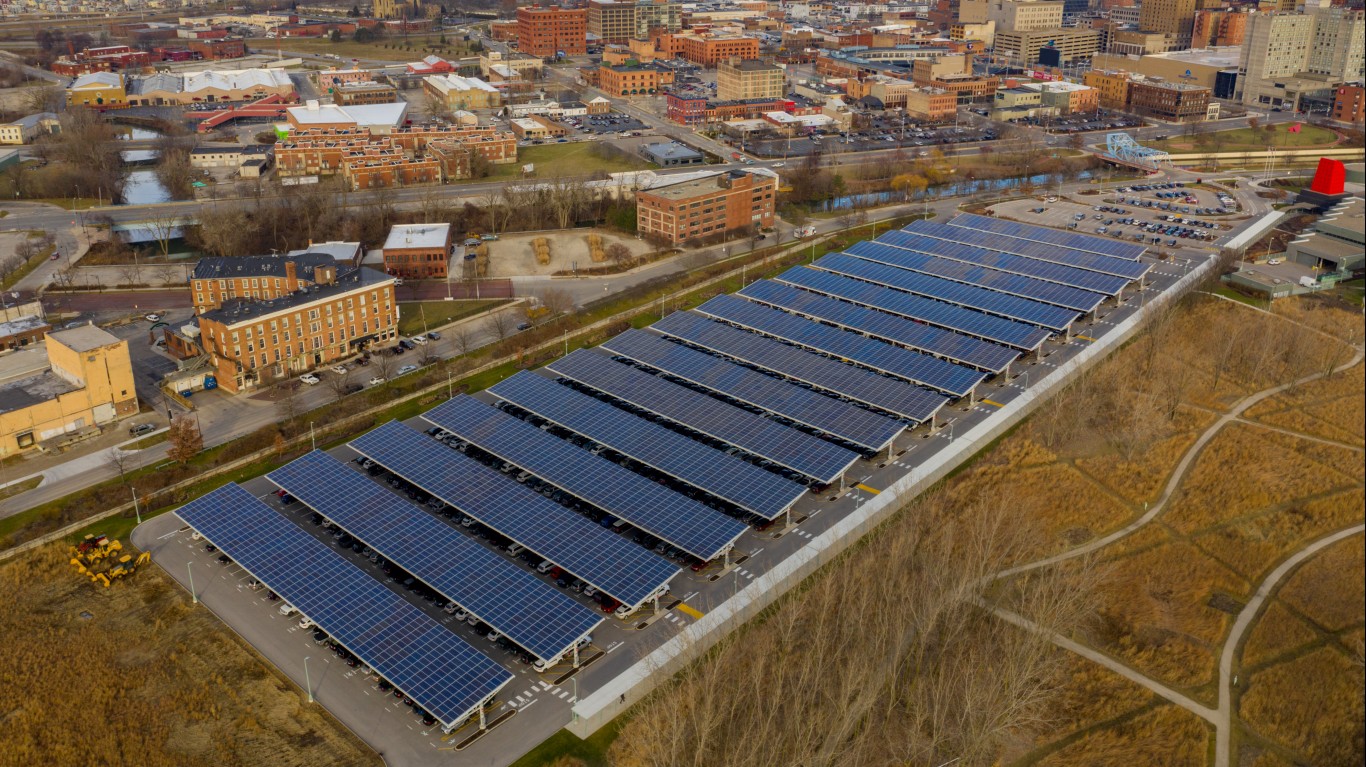
43. Ohio
> Potential jobs created under Inflation Reduction Act in 2030: 1 for every 299 people (39,702 total)
> Potential new jobs as a share of current unemployed population: 17.2%
> Unemployed population in 2022: 230,950 (4.0% of labor force)
> Energy-related carbon dioxide emissions in 2021: 16.5 metric tons per person (11.4% higher than avg.)
[in-text-ad]
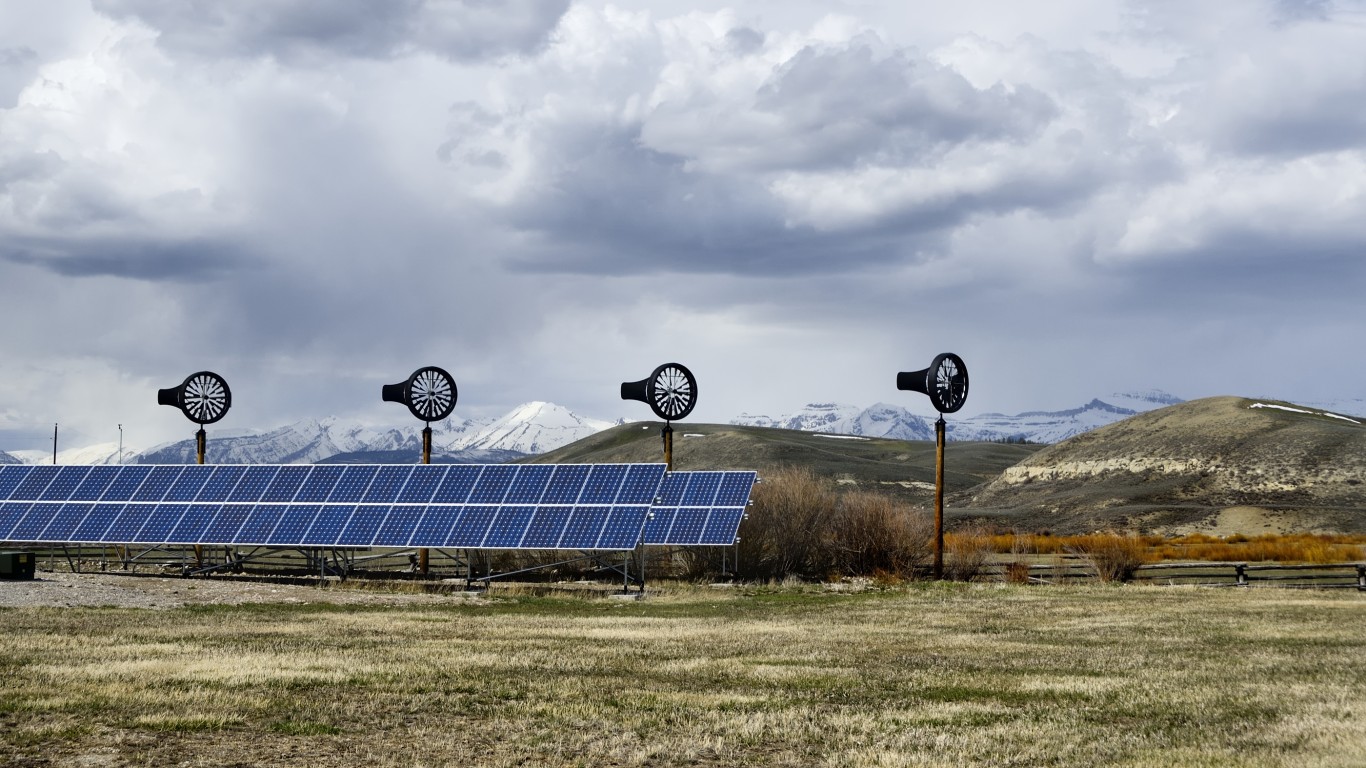
42. Wyoming
> Potential jobs created under Inflation Reduction Act in 2030: 1 for every 298 people (1,943 total)
> Potential new jobs as a share of current unemployed population: 18.7%
> Unemployed population in 2022: 10,413 (3.6% of labor force)
> Energy-related carbon dioxide emissions in 2021: 94.3 metric tons per person (537.1% higher than avg.)
41. Pennsylvania
> Potential jobs created under Inflation Reduction Act in 2030: 1 for every 298 people (43,801 total)
> Potential new jobs as a share of current unemployed population: 15.5%
> Unemployed population in 2022: 282,692 (4.4% of labor force)
> Energy-related carbon dioxide emissions in 2021: 16.4 metric tons per person (10.9% higher than avg.)

40. Maine
> Potential jobs created under Inflation Reduction Act in 2030: 1 for every 298 people (4,601 total)
> Potential new jobs as a share of current unemployed population: 23.1%
> Unemployed population in 2022: 19,910 (3.0% of labor force)
> Energy-related carbon dioxide emissions in 2021: 10.5 metric tons per person (29.3% lower than avg.)
[in-text-ad-2]
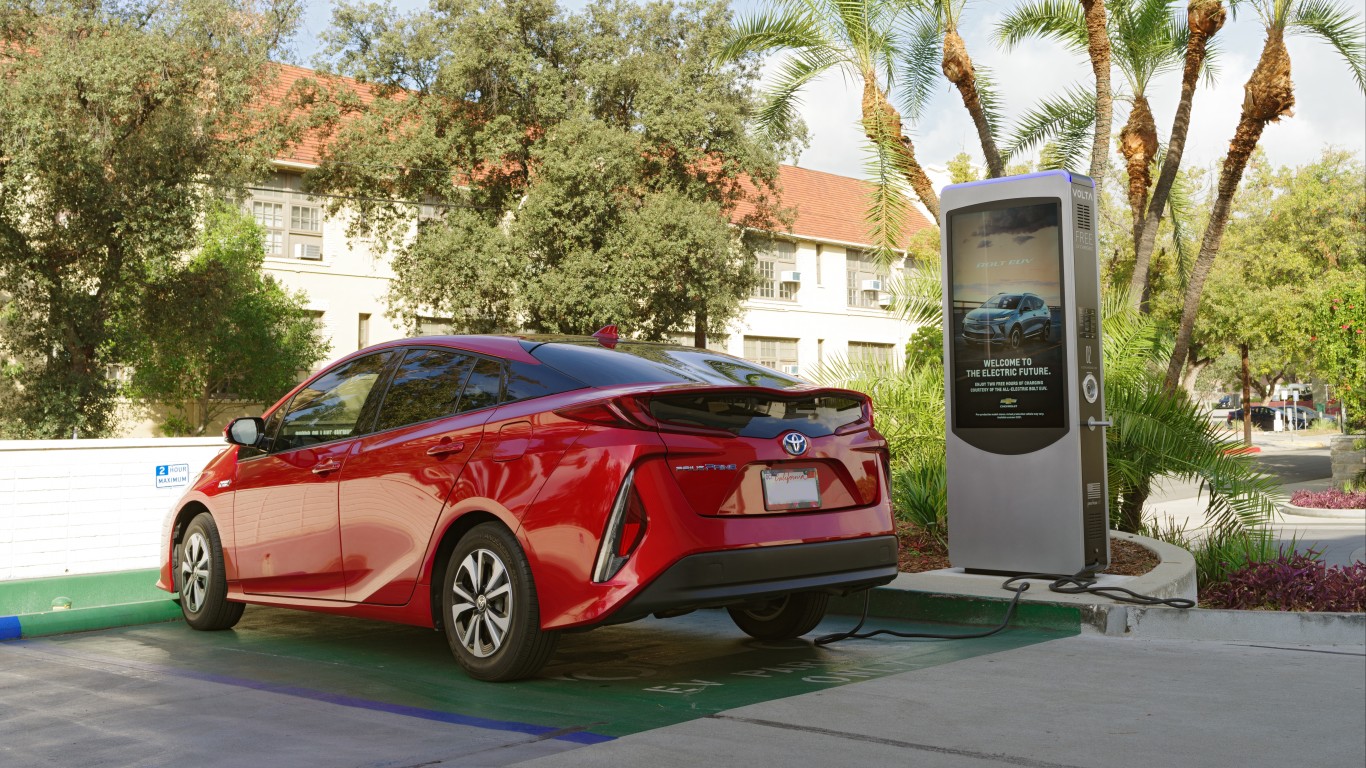
39. Louisiana
> Potential jobs created under Inflation Reduction Act in 2030: 1 for every 297 people (15,771 total)
> Potential new jobs as a share of current unemployed population: 20.7%
> Unemployed population in 2022: 76,350 (3.7% of labor force)
> Energy-related carbon dioxide emissions in 2021: 40.8 metric tons per person (175.4% higher than avg.)
38. Vermont
> Potential jobs created under Inflation Reduction Act in 2030: 1 for every 297 people (2,178 total)
> Potential new jobs as a share of current unemployed population: 24.1%
> Unemployed population in 2022: 9,038 (2.6% of labor force)
> Energy-related carbon dioxide emissions in 2021: 8.6 metric tons per person (41.8% lower than avg.)
[in-text-ad]
37. Missouri
> Potential jobs created under Inflation Reduction Act in 2030: 1 for every 297 people (20,848 total)
> Potential new jobs as a share of current unemployed population: 27.1%
> Unemployed population in 2022: 76,939 (2.5% of labor force)
> Energy-related carbon dioxide emissions in 2021: 19.0 metric tons per person (28.1% higher than avg.)

36. New Mexico
> Potential jobs created under Inflation Reduction Act in 2030: 1 for every 297 people (7,179 total)
> Potential new jobs as a share of current unemployed population: 18.8%
> Unemployed population in 2022: 38,155 (4.0% of labor force)
> Energy-related carbon dioxide emissions in 2021: 21.7 metric tons per person (46.5% higher than avg.)
35. Kansas
> Potential jobs created under Inflation Reduction Act in 2030: 1 for every 296 people (9,978 total)
> Potential new jobs as a share of current unemployed population: 24.9%
> Unemployed population in 2022: 40,098 (2.7% of labor force)
> Energy-related carbon dioxide emissions in 2021: 20.3 metric tons per person (37.4% higher than avg.)
[in-text-ad-2]
34. Arkansas
> Potential jobs created under Inflation Reduction Act in 2030: 1 for every 295 people (10,271 total)
> Potential new jobs as a share of current unemployed population: 22.6%
> Unemployed population in 2022: 45,418 (3.3% of labor force)
> Energy-related carbon dioxide emissions in 2021: 20.5 metric tons per person (38.4% higher than avg.)
33. Wisconsin
> Potential jobs created under Inflation Reduction Act in 2030: 1 for every 294 people (20,196 total)
> Potential new jobs as a share of current unemployed population: 22.4%
> Unemployed population in 2022: 90,079 (2.9% of labor force)
> Energy-related carbon dioxide emissions in 2021: 15.7 metric tons per person (6.2% higher than avg.)
[in-text-ad]
32. Kentucky
> Potential jobs created under Inflation Reduction Act in 2030: 1 for every 293 people (15,482 total)
> Potential new jobs as a share of current unemployed population: 19.4%
> Unemployed population in 2022: 79,945 (3.9% of labor force)
> Energy-related carbon dioxide emissions in 2021: 24.7 metric tons per person (66.9% higher than avg.)

31. New York
> Potential jobs created under Inflation Reduction Act in 2030: 1 for every 292 people (69,790 total)
> Potential new jobs as a share of current unemployed population: 17.0%
> Unemployed population in 2022: 411,168 (4.3% of labor force)
> Energy-related carbon dioxide emissions in 2021: 7.9 metric tons per person (46.9% lower than avg.)

30. Rhode Island
> Potential jobs created under Inflation Reduction Act in 2030: 1 for every 292 people (3,792 total)
> Potential new jobs as a share of current unemployed population: 20.8%
> Unemployed population in 2022: 18,235 (3.2% of labor force)
> Energy-related carbon dioxide emissions in 2021: 9.7 metric tons per person (34.5% lower than avg.)
[in-text-ad-2]
29. New Hampshire
> Potential jobs created under Inflation Reduction Act in 2030: 1 for every 291 people (4,784 total)
> Potential new jobs as a share of current unemployed population: 24.7%
> Unemployed population in 2022: 19,333 (2.5% of labor force)
> Energy-related carbon dioxide emissions in 2021: 9.6 metric tons per person (35.3% lower than avg.)
28. Indiana
> Potential jobs created under Inflation Reduction Act in 2030: 1 for every 290 people (23,568 total)
> Potential new jobs as a share of current unemployed population: 23.1%
> Unemployed population in 2022: 101,811 (3.0% of labor force)
> Energy-related carbon dioxide emissions in 2021: 24.4 metric tons per person (65.0% higher than avg.)
[in-text-ad]

27. Iowa
> Potential jobs created under Inflation Reduction Act in 2030: 1 for every 290 people (11,092 total)
> Potential new jobs as a share of current unemployed population: 23.6%
> Unemployed population in 2022: 46,961 (2.7% of labor force)
> Energy-related carbon dioxide emissions in 2021: 22.9 metric tons per person (54.5% higher than avg.)
26. Alabama
> Potential jobs created under Inflation Reduction Act in 2030: 1 for every 289 people (17,557 total)
> Potential new jobs as a share of current unemployed population: 29.6%
> Unemployed population in 2022: 59,358 (2.6% of labor force)
> Energy-related carbon dioxide emissions in 2021: 21.5 metric tons per person (45.0% higher than avg.)

25. Oklahoma
> Potential jobs created under Inflation Reduction Act in 2030: 1 for every 288 people (13,914 total)
> Potential new jobs as a share of current unemployed population: 24.4%
> Unemployed population in 2022: 56,979 (3.0% of labor force)
> Energy-related carbon dioxide emissions in 2021: 22.0 metric tons per person (48.7% higher than avg.)
[in-text-ad-2]
24. New Jersey
> Potential jobs created under Inflation Reduction Act in 2030: 1 for every 287 people (32,689 total)
> Potential new jobs as a share of current unemployed population: 18.6%
> Unemployed population in 2022: 175,691 (3.7% of labor force)
> Energy-related carbon dioxide emissions in 2021: 9.6 metric tons per person (35.0% lower than avg.)
23. California
> Potential jobs created under Inflation Reduction Act in 2030: 1 for every 286 people (140,005 total)
> Potential new jobs as a share of current unemployed population: 17.3%
> Unemployed population in 2022: 811,079 (4.2% of labor force)
> Energy-related carbon dioxide emissions in 2021: 8.3 metric tons per person (44.1% lower than avg.)
[in-text-ad]

22. Maryland
> Potential jobs created under Inflation Reduction Act in 2030: 1 for every 283 people (22,117 total)
> Potential new jobs as a share of current unemployed population: 21.5%
> Unemployed population in 2022: 102,813 (3.2% of labor force)
> Energy-related carbon dioxide emissions in 2021: 8.5 metric tons per person (42.5% lower than avg.)
21. Massachusetts
> Potential jobs created under Inflation Reduction Act in 2030: 1 for every 282 people (25,290 total)
> Potential new jobs as a share of current unemployed population: 18.0%
> Unemployed population in 2022: 140,752 (3.8% of labor force)
> Energy-related carbon dioxide emissions in 2021: 8.0 metric tons per person (45.8% lower than avg.)
20. Nebraska
> Potential jobs created under Inflation Reduction Act in 2030: 1 for every 282 people (7,060 total)
> Potential new jobs as a share of current unemployed population: 28.4%
> Unemployed population in 2022: 24,836 (2.3% of labor force)
> Energy-related carbon dioxide emissions in 2021: 24.0 metric tons per person (62.5% higher than avg.)
[in-text-ad-2]
19. Minnesota
> Potential jobs created under Inflation Reduction Act in 2030: 1 for every 281 people (20,588 total)
> Potential new jobs as a share of current unemployed population: 24.9%
> Unemployed population in 2022: 82,580 (2.7% of labor force)
> Energy-related carbon dioxide emissions in 2021: 14.6 metric tons per person (1.6% lower than avg.)

18. Virginia
> Potential jobs created under Inflation Reduction Act in 2030: 1 for every 280 people (31,255 total)
> Potential new jobs as a share of current unemployed population: 24.6%
> Unemployed population in 2022: 127,053 (2.9% of labor force)
> Energy-related carbon dioxide emissions in 2021: 11.3 metric tons per person (23.5% lower than avg.)
[in-text-ad]
17. Tennessee
> Potential jobs created under Inflation Reduction Act in 2030: 1 for every 277 people (25,348 total)
> Potential new jobs as a share of current unemployed population: 22.3%
> Unemployed population in 2022: 113,471 (3.4% of labor force)
> Energy-related carbon dioxide emissions in 2021: 13.3 metric tons per person (10.1% lower than avg.)
16. South Dakota
> Potential jobs created under Inflation Reduction Act in 2030: 1 for every 277 people (3,252 total)
> Potential new jobs as a share of current unemployed population: 33.1%
> Unemployed population in 2022: 9,815 (2.1% of labor force)
> Energy-related carbon dioxide emissions in 2021: 16.9 metric tons per person (14.3% higher than avg.)
15. North Carolina
> Potential jobs created under Inflation Reduction Act in 2030: 1 for every 275 people (38,568 total)
> Potential new jobs as a share of current unemployed population: 20.5%
> Unemployed population in 2022: 188,331 (3.7% of labor force)
> Energy-related carbon dioxide emissions in 2021: 10.9 metric tons per person (26.1% lower than avg.)
[in-text-ad-2]

14. Montana
> Potential jobs created under Inflation Reduction Act in 2030: 1 for every 275 people (4,011 total)
> Potential new jobs as a share of current unemployed population: 26.8%
> Unemployed population in 2022: 14,945 (2.6% of labor force)
> Energy-related carbon dioxide emissions in 2021: 25.8 metric tons per person (74.2% higher than avg.)
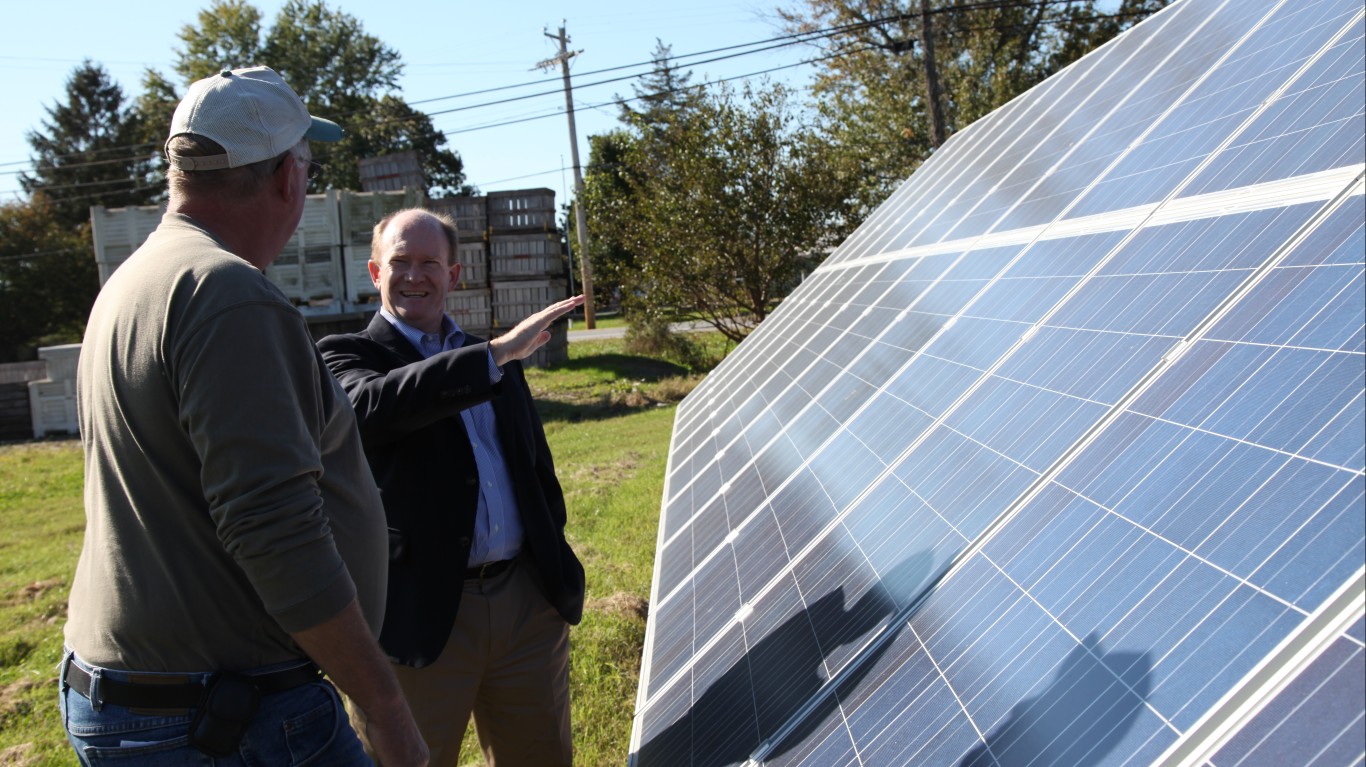
13. Delaware
> Potential jobs created under Inflation Reduction Act in 2030: 1 for every 273 people (3,692 total)
> Potential new jobs as a share of current unemployed population: 16.5%
> Unemployed population in 2022: 22,430 (4.5% of labor force)
> Energy-related carbon dioxide emissions in 2021: 12.9 metric tons per person (12.8% lower than avg.)
[in-text-ad]

12. Georgia
> Potential jobs created under Inflation Reduction Act in 2030: 1 for every 272 people (40,112 total)
> Potential new jobs as a share of current unemployed population: 25.2%
> Unemployed population in 2022: 159,182 (3.0% of labor force)
> Energy-related carbon dioxide emissions in 2021: 11.5 metric tons per person (22.3% lower than avg.)

11. Oregon
> Potential jobs created under Inflation Reduction Act in 2030: 1 for every 272 people (15,873 total)
> Potential new jobs as a share of current unemployed population: 17.5%
> Unemployed population in 2022: 90,795 (4.2% of labor force)
> Energy-related carbon dioxide emissions in 2021: 9.1 metric tons per person (38.8% lower than avg.)
10. South Carolina
> Potential jobs created under Inflation Reduction Act in 2030: 1 for every 272 people (19,187 total)
> Potential new jobs as a share of current unemployed population: 24.9%
> Unemployed population in 2022: 77,048 (3.2% of labor force)
> Energy-related carbon dioxide emissions in 2021: 13.4 metric tons per person (9.8% lower than avg.)
[in-text-ad-2]

9. Arizona
> Potential jobs created under Inflation Reduction Act in 2030: 1 for every 268 people (27,209 total)
> Potential new jobs as a share of current unemployed population: 19.7%
> Unemployed population in 2022: 138,128 (3.8% of labor force)
> Energy-related carbon dioxide emissions in 2021: 11.4 metric tons per person (22.8% lower than avg.)
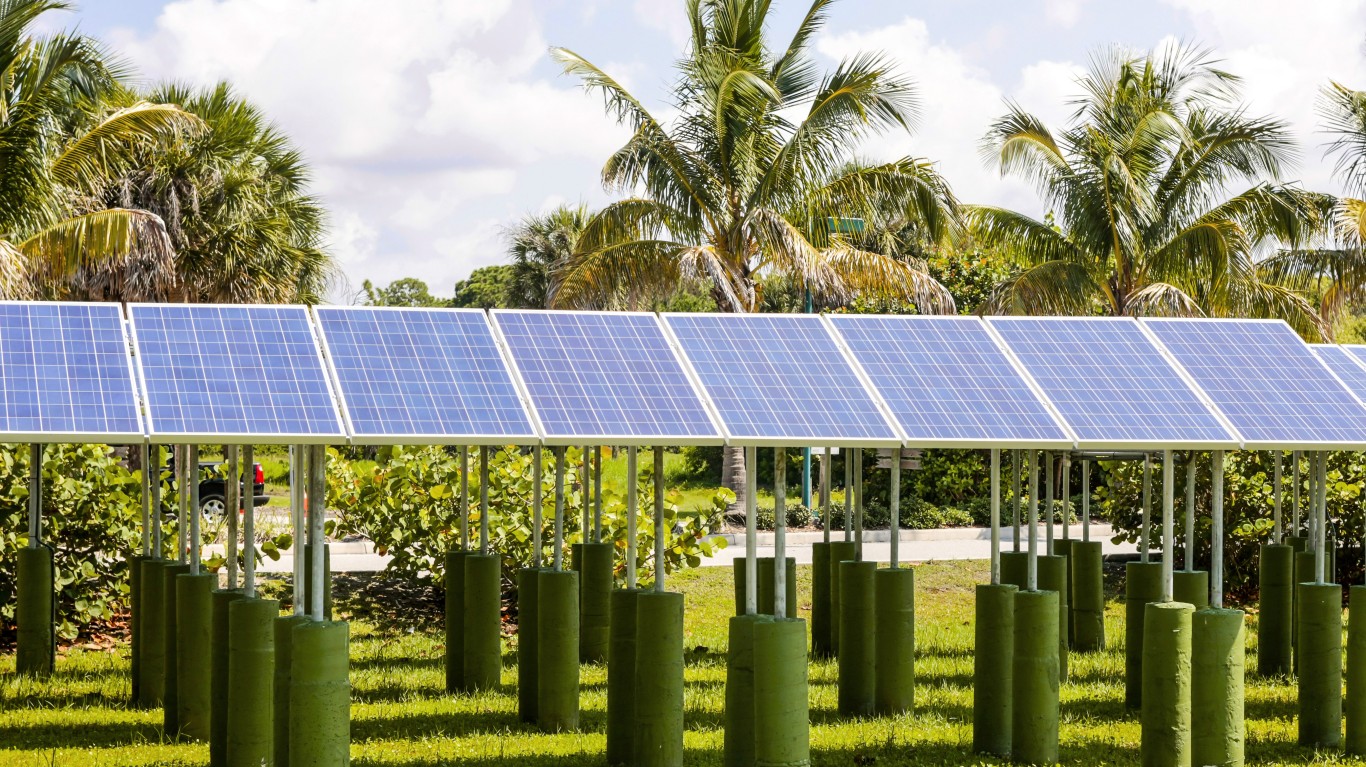
8. Florida
> Potential jobs created under Inflation Reduction Act in 2030: 1 for every 261 people (84,592 total)
> Potential new jobs as a share of current unemployed population: 27.0%
> Unemployed population in 2022: 313,266 (2.9% of labor force)
> Energy-related carbon dioxide emissions in 2021: 10.4 metric tons per person (29.9% lower than avg.)
[in-text-ad]
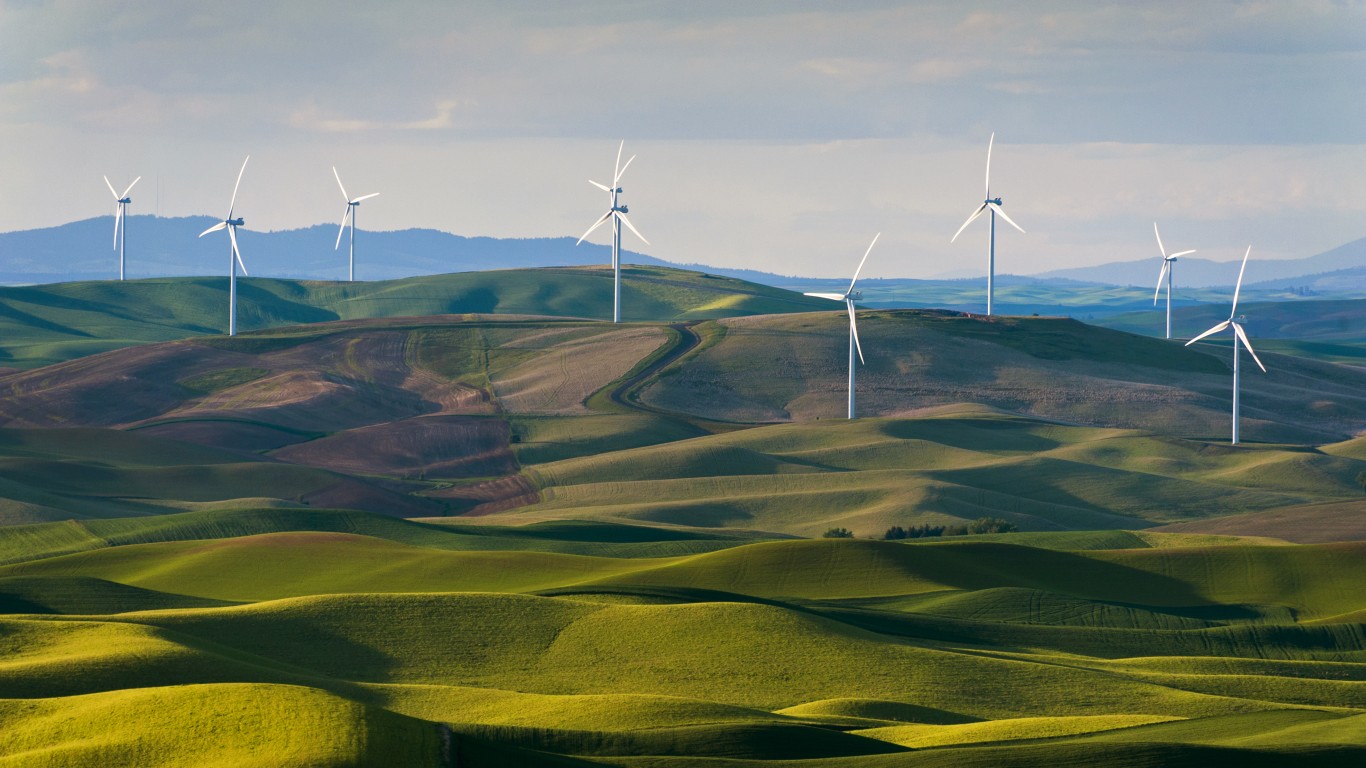
7. Washington
> Potential jobs created under Inflation Reduction Act in 2030: 1 for every 261 people (30,273 total)
> Potential new jobs as a share of current unemployed population: 18.0%
> Unemployed population in 2022: 168,024 (4.2% of labor force)
> Energy-related carbon dioxide emissions in 2021: 9.5 metric tons per person (35.6% lower than avg.)
6. Colorado
> Potential jobs created under Inflation Reduction Act in 2030: 1 for every 260 people (22,742 total)
> Potential new jobs as a share of current unemployed population: 23.4%
> Unemployed population in 2022: 97,094 (3.0% of labor force)
> Energy-related carbon dioxide emissions in 2021: 14.7 metric tons per person (0.7% lower than avg.)

5. Nevada
> Potential jobs created under Inflation Reduction Act in 2030: 1 for every 260 people (12,251 total)
> Potential new jobs as a share of current unemployed population: 14.6%
> Unemployed population in 2022: 83,646 (5.4% of labor force)
> Energy-related carbon dioxide emissions in 2021: 12.5 metric tons per person (15.3% lower than avg.)
[in-text-ad-2]
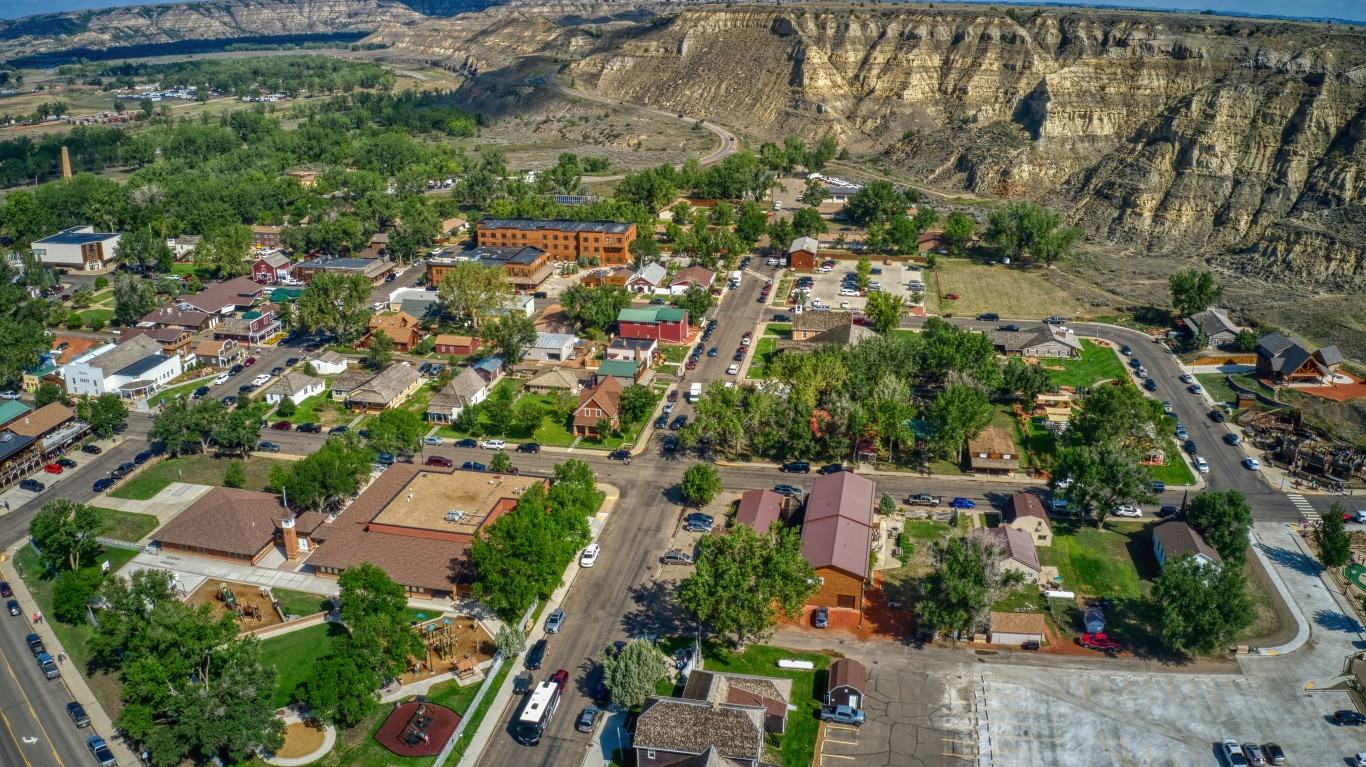
4. North Dakota
> Potential jobs created under Inflation Reduction Act in 2030: 1 for every 258 people (3,106 total)
> Potential new jobs as a share of current unemployed population: 35.6%
> Unemployed population in 2022: 8,731 (2.1% of labor force)
> Energy-related carbon dioxide emissions in 2021: 72.7 metric tons per person (391.0% higher than avg.)
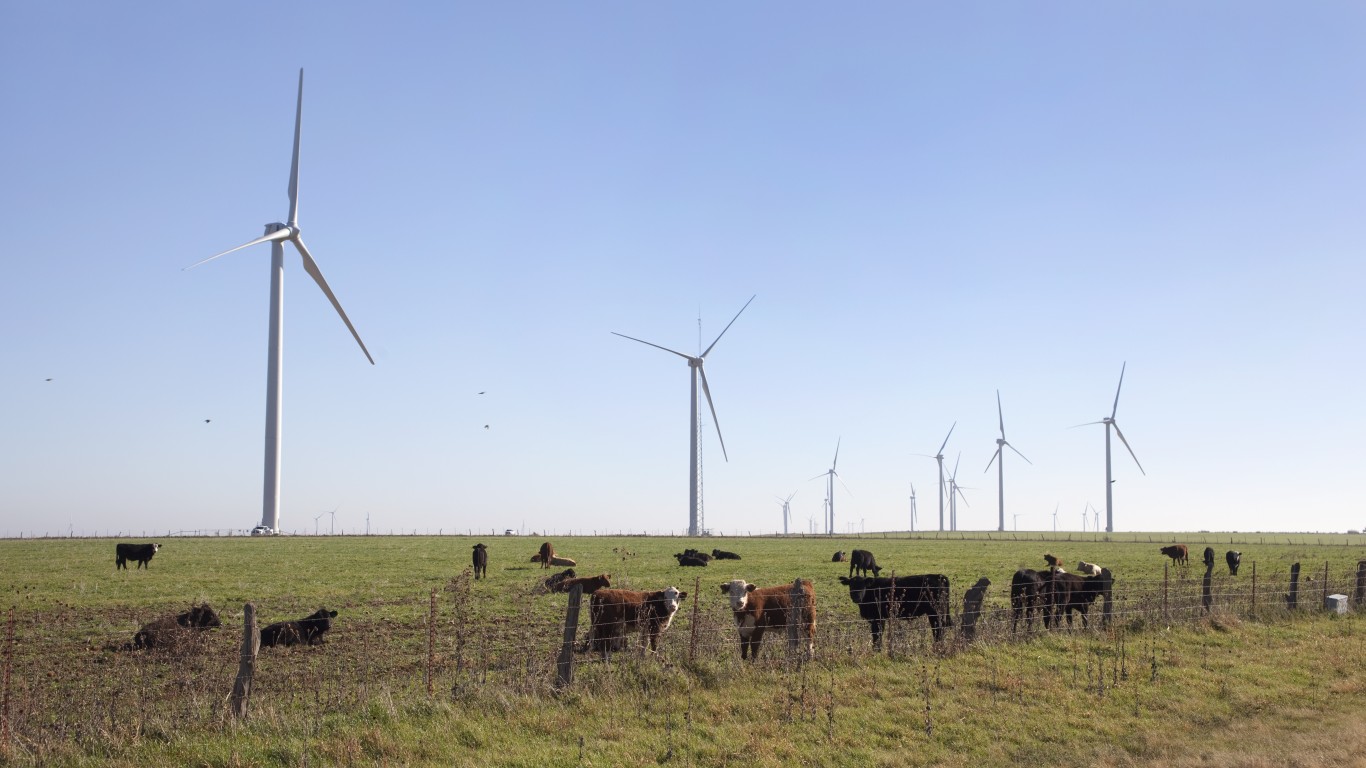
3. Texas
> Potential jobs created under Inflation Reduction Act in 2030: 1 for every 258 people (116,280 total)
> Potential new jobs as a share of current unemployed population: 20.4%
> Unemployed population in 2022: 569,725 (3.9% of labor force)
> Energy-related carbon dioxide emissions in 2021: 22.4 metric tons per person (51.7% higher than avg.)
[in-text-ad]

2. Idaho
> Potential jobs created under Inflation Reduction Act in 2030: 1 for every 254 people (7,457 total)
> Potential new jobs as a share of current unemployed population: 29.5%
> Unemployed population in 2022: 25,314 (2.7% of labor force)
> Energy-related carbon dioxide emissions in 2021: 10.8 metric tons per person (27.2% lower than avg.)
1. Utah
> Potential jobs created under Inflation Reduction Act in 2030: 1 for every 251 people (13,423 total)
> Potential new jobs as a share of current unemployed population: 33.2%
> Unemployed population in 2022: 40,380 (2.3% of labor force)
> Energy-related carbon dioxide emissions in 2021: 18.6 metric tons per person (25.6% higher than avg.)
The thought of burdening your family with a financial disaster is most Americans’ nightmare. However, recent studies show that over 100 million Americans still don’t have proper life insurance in the event they pass away.
Life insurance can bring peace of mind – ensuring your loved ones are safeguarded against unforeseen expenses and debts. With premiums often lower than expected and a variety of plans tailored to different life stages and health conditions, securing a policy is more accessible than ever.
A quick, no-obligation quote can provide valuable insight into what’s available and what might best suit your family’s needs. Life insurance is a simple step you can take today to help secure peace of mind for your loved ones tomorrow.
Click here to learn how to get a quote in just a few minutes.
Thank you for reading! Have some feedback for us?
Contact the 24/7 Wall St. editorial team.