Special Report
20 States Getting Destroyed by Natural Disasters
Published:
Last Updated:

California’s 2020 wildfire season was particularly savage. By the end of that year, about 4% of California’s landmass, some 4.3 million acres, had gone up in smoke from nearly 10,000 wildfires that raged from the northern coastal range to the border with Mexico, and from the hills outside of Los Angeles inland to San Bernardino County.
The fires killed 33 people and turned more than 11,000 structures to ash, including many residences and businesses. The damage was so extensive the Federal Emergency Management Agency distributed more than $103 million in disaster assistance.
FEMA also declared the record-setting California wildfire season a major disaster, one of over 150 major disaster declarations in 2020 and 2021 nationwide as more frequent and severe storms, fires, and floods, wreaked havoc across the country. (This is the worst natural disaster in every state.)
The number of FEMA disaster declarations every fiscal year — from Sept. 1 to Oct. 30 the following year — has increased from an average of 31 in the decade ending in 1992 to 130 in the decade ending in 2022. Most FEMA disaster declarations are weather related.
Some parts of the country are particularly prone to certain types of disasters: wildfires in the west; heavy storms and tornadoes in the middle parts of the country; hurricanes on the Gulf Coast and in the Southeast. Non hurricane-related flooding caused by heavy deluges can strike anywhere there’s a river or low-lying areas near bodies of water.
The 72 disaster declarations since the start of this calendar year have included FEMA responses to flooding in Vermont and New York; severe storms, damaging winds, and tornadoes in Oklahoma, Kentucky, Alabama, Arkansas, Mississippi, and Florida; and severe winter weather that caused flooding, landslides, and mudslides in California. These states are among the 20 that have borne most of the brunt of disasters linked to global warming. (Here are the 18 separate billion dollar weather and climate disasters in 2022.)
To determine the states getting destroyed by natural disasters, 24/7 Wall St. reviewed data on the impact of natural disasters on residents from the most recent U.S. Census Bureau’s Household Pulse Survey of June 28, 2023 to July 10, 2023. States were ranked based on the percentage of adults who have been displaced by a natural disaster in the past year ending in July 10. Supplemental data on the percentage of displaced adults who have yet to return home and the number of displaced adults by type of natural disaster are also from the survey. The number of major disasters FEMA declared in each state since 1953 is current as of July 2023.
In the past year ending in early July, 2.5 million people nationwide have been displaced because of natural disasters, led by people living in Florida, California, Louisiana, and Illinois. Disasters in California and Florida caused nearly half of these displacements. Hurricanes and fires in these states were the largest sources of displacement.
Here are the states getting destroyed most by natural disasters.
20. Missouri
> Pct. adults displaced by natural disaster in past year: 1.1% (50,453)
> Pct. displaced adults who never returned home: 17.2% (8,672)
> Largest source of displacement: Flood (33,570)
> FEMA major disaster declarations since 1953: 66
[in-text-ad]
19. New Mexico
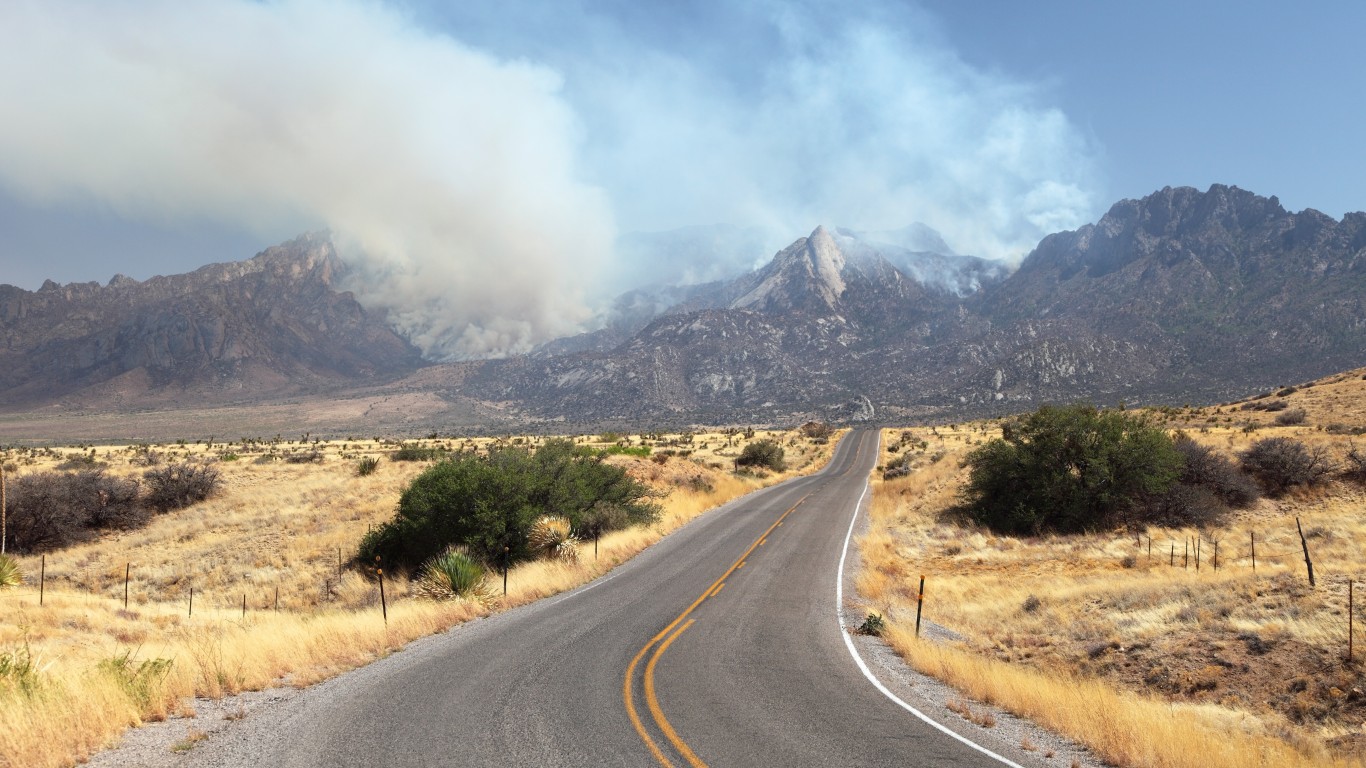
> Pct. adults displaced by natural disaster in past year: 1.1% (17,568)
> Pct. displaced adults who never returned home: 49.1% (8,628)
> Largest source of displacement: Fire (7,733)
> FEMA major disaster declarations since 1953: 34
18. West Virginia
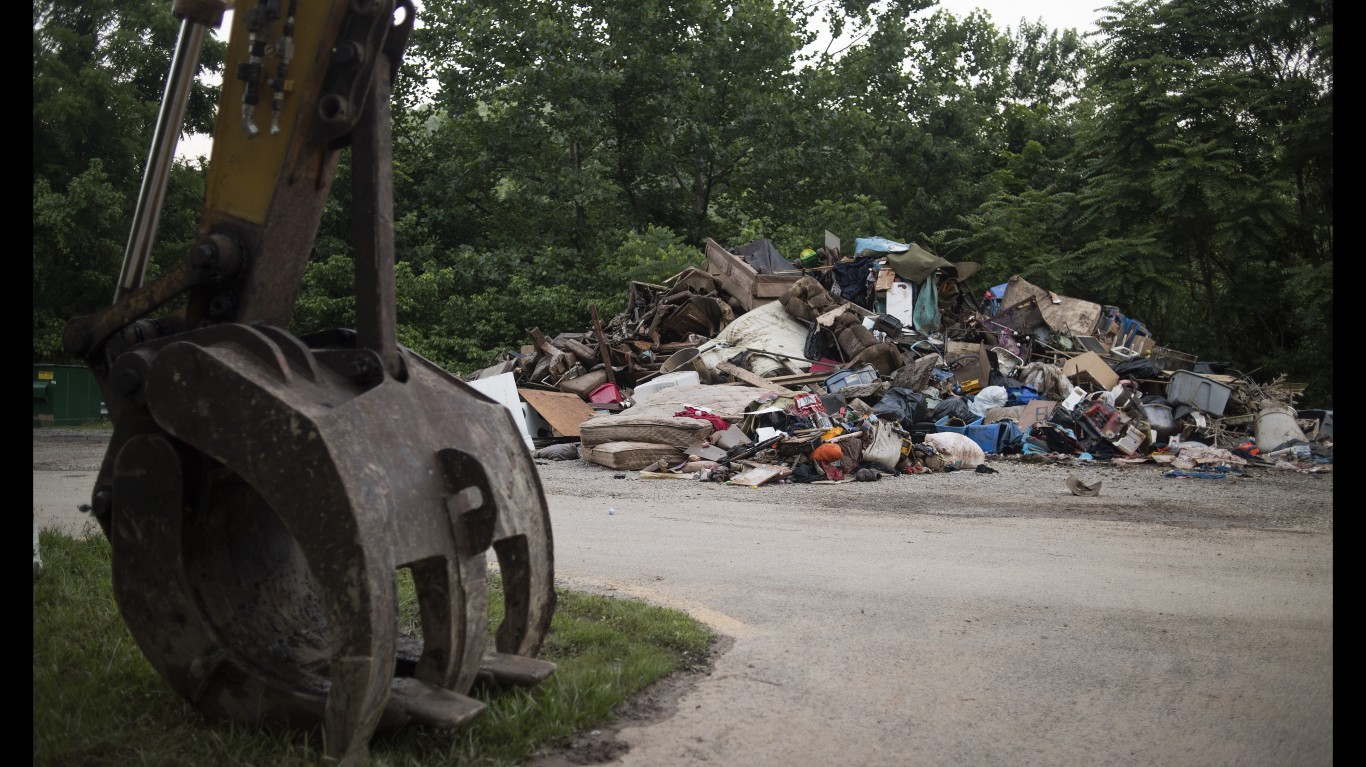
> Pct. adults displaced by natural disaster in past year: 1.1% (15,533)
> Pct. displaced adults who never returned home: N/A
> Largest source of displacement: Flood (11,040)
> FEMA major disaster declarations since 1953: 66
17. Indiana
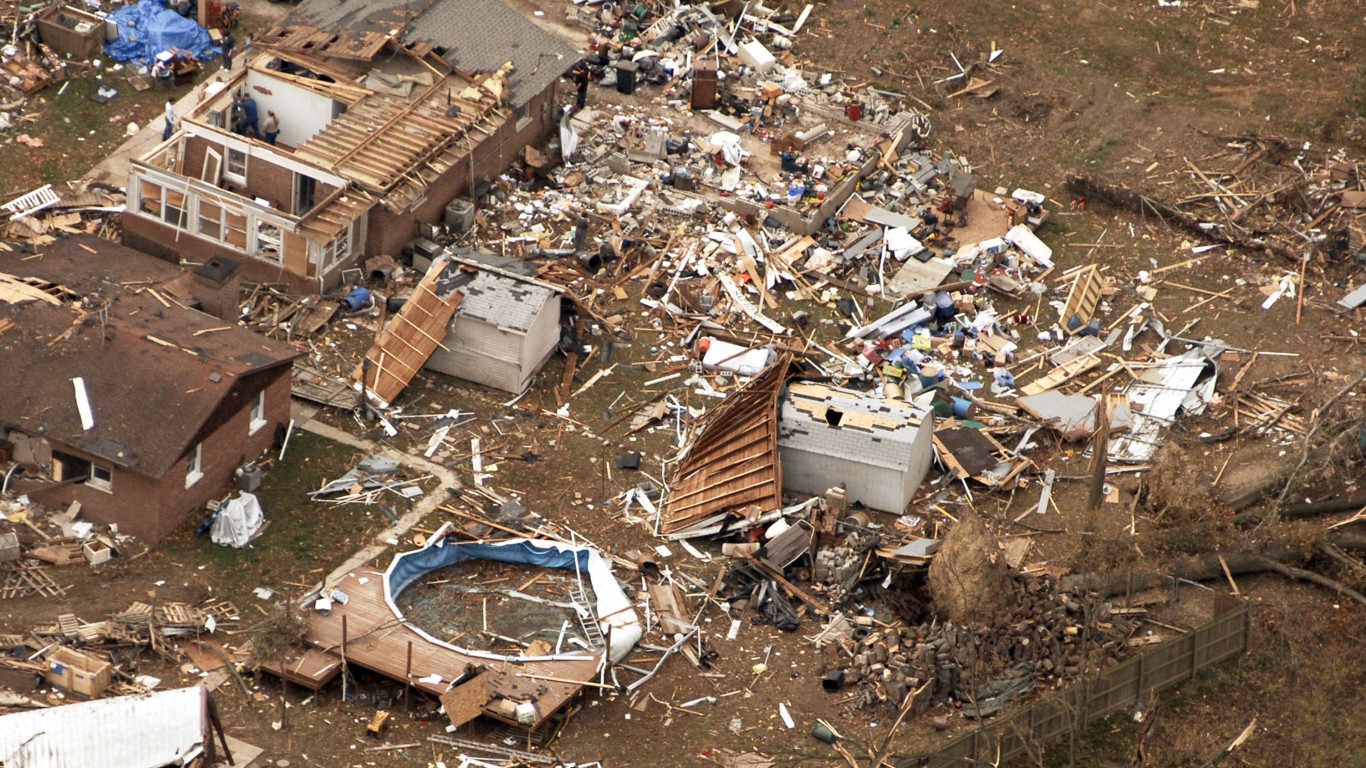
> Pct. adults displaced by natural disaster in past year: 1.2% (59,474)
> Pct. displaced adults who never returned home: 21.4% (12,720)
> Largest source of displacement: Tornado (26,652)
> FEMA major disaster declarations since 1953: 44
[in-text-ad-2]

16. Michigan
> Pct. adults displaced by natural disaster in past year: 1.2% (92,460)
> Pct. displaced adults who never returned home: 43.5% (40,192)
> Largest source of displacement: Hurricane (29,069)
> FEMA major disaster declarations since 1953: 32
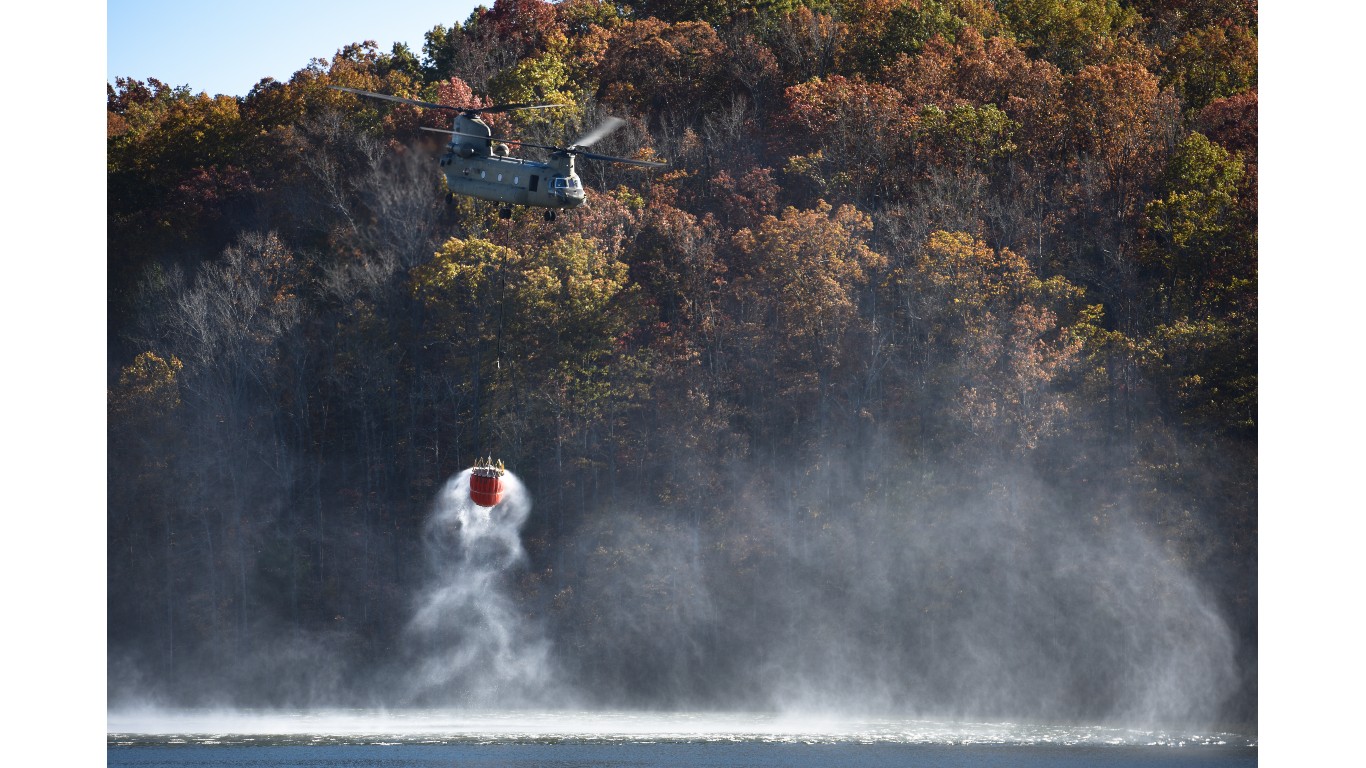
15. South Carolina
> Pct. adults displaced by natural disaster in past year: 1.2% (49,941)
> Pct. displaced adults who never returned home: 91.4% (45,668)
> Largest source of displacement: Fire (9,533)
> FEMA major disaster declarations since 1953: 25
[in-text-ad]
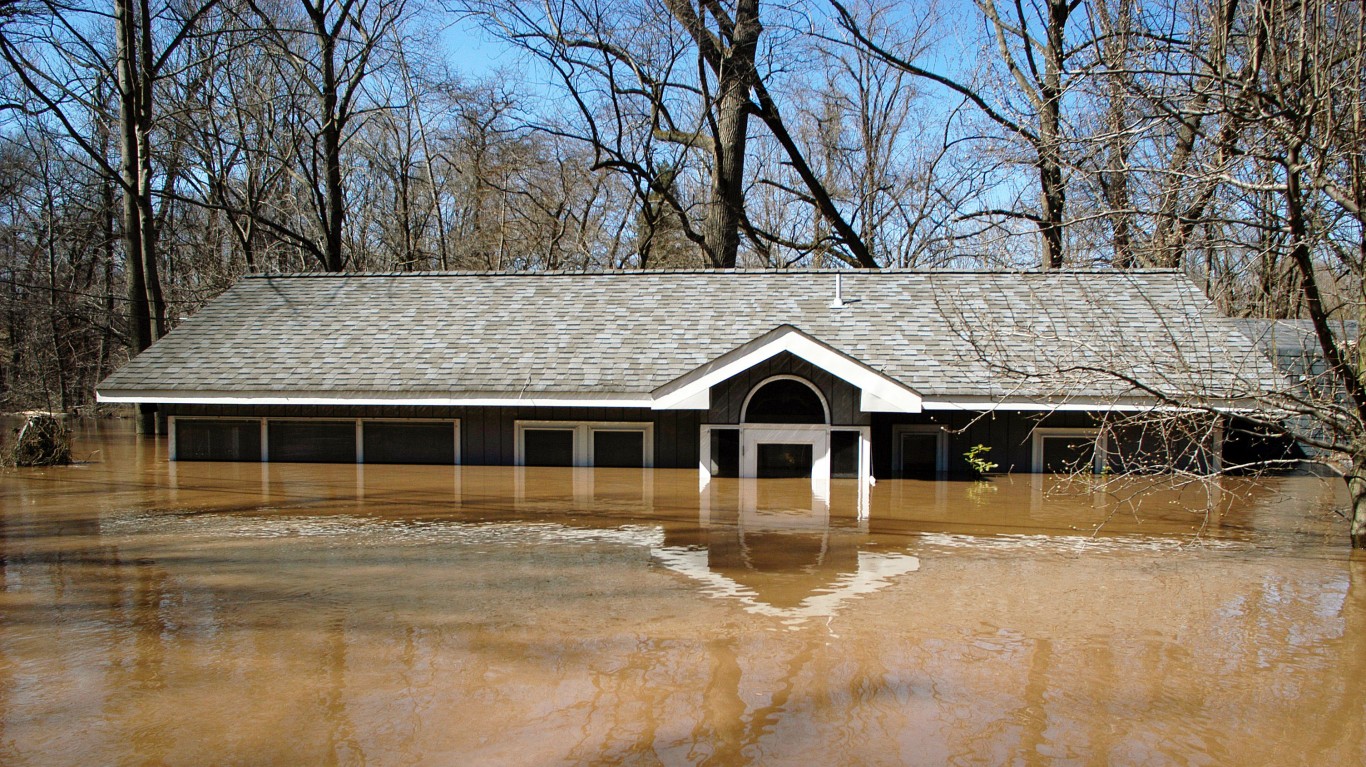
14. Pennsylvania
> Pct. adults displaced by natural disaster in past year: 1.3% (130,042)
> Pct. displaced adults who never returned home: 8.2% (10,616)
> Largest source of displacement: Flood (107,102)
> FEMA major disaster declarations since 1953: 53
13. Colorado
> Pct. adults displaced by natural disaster in past year: 1.3% (60,063)
> Pct. displaced adults who never returned home: 48.6% (29,176)
> Largest source of displacement: Fire (43,363)
> FEMA major disaster declarations since 1953: 24
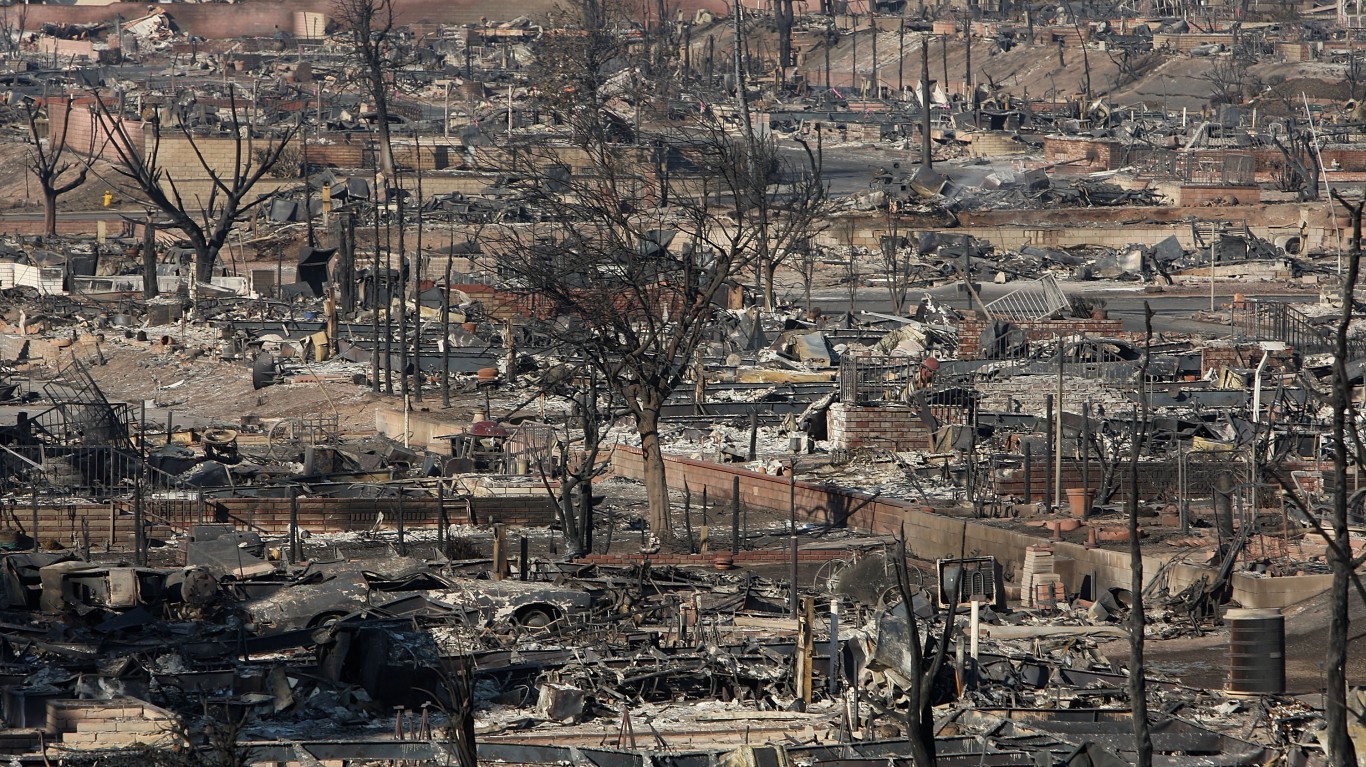
12. California
> Pct. adults displaced by natural disaster in past year: 1.4% (422,353)
> Pct. displaced adults who never returned home: 12.8% (54,089)
> Largest source of displacement: Fire (201,610)
> FEMA major disaster declarations since 1953: 108
[in-text-ad-2]
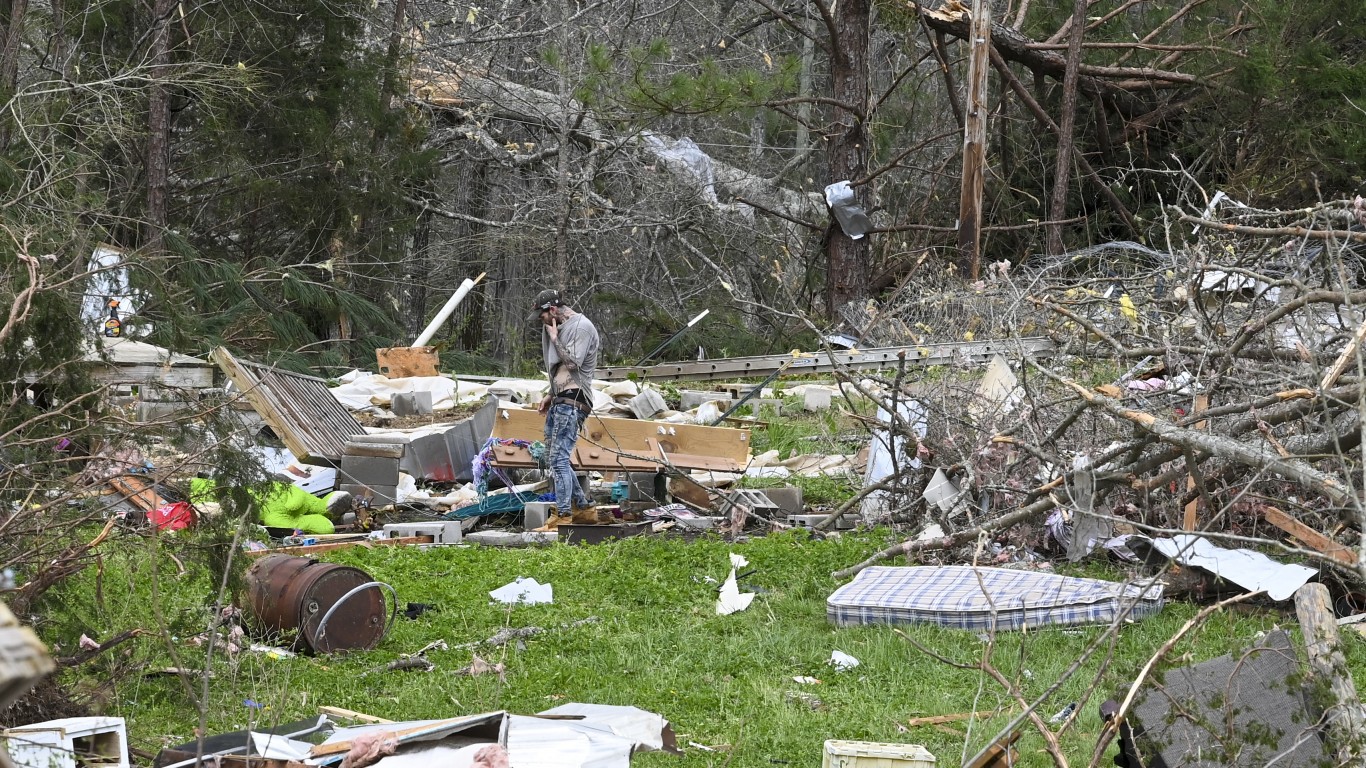
11. Alabama
> Pct. adults displaced by natural disaster in past year: 1.4% (55,610)
> Pct. displaced adults who never returned home: 21.2% (11,811)
> Largest source of displacement: Tornado (39,422)
> FEMA major disaster declarations since 1953: 75
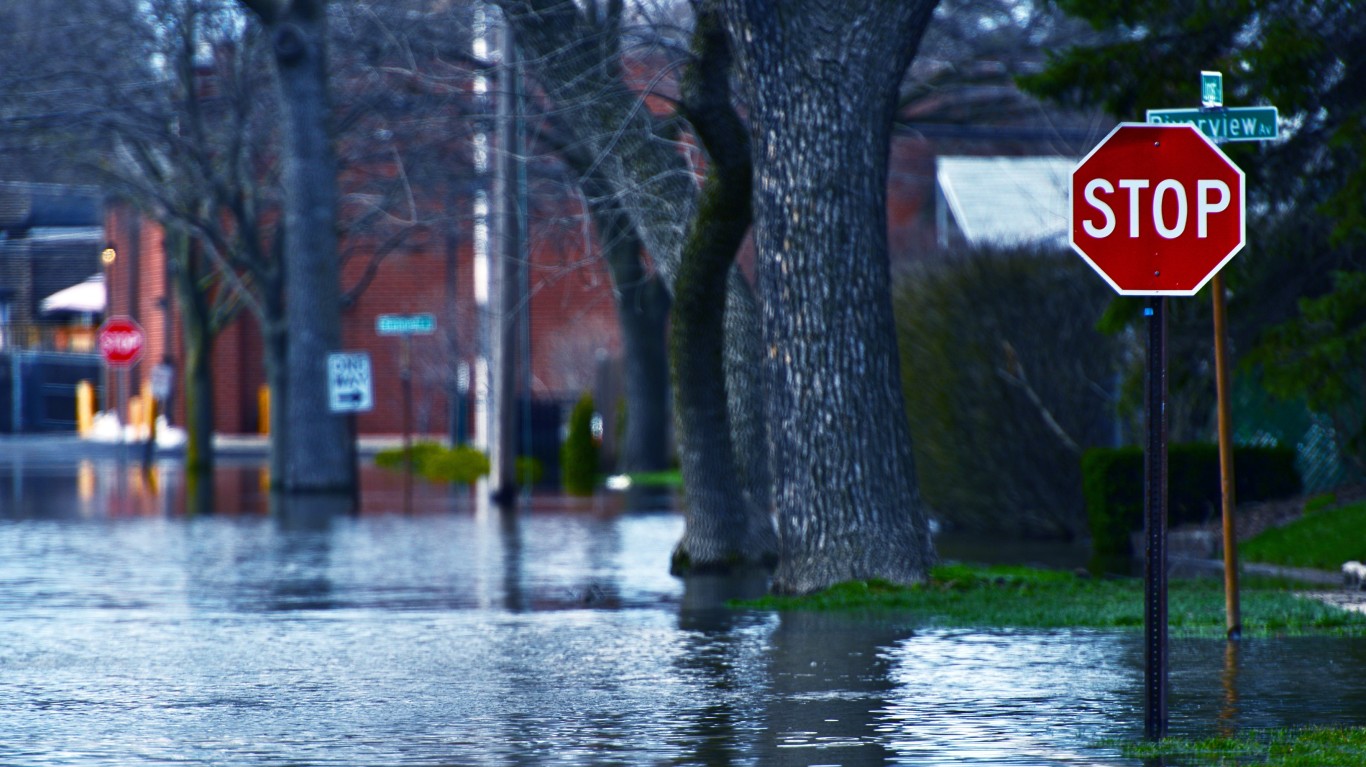
10. Illinois
> Pct. adults displaced by natural disaster in past year: 1.6% (154,100)
> Pct. displaced adults who never returned home: 13.2% (20,319)
> Largest source of displacement: Flood (98,767)
> FEMA major disaster declarations since 1953: 55
[in-text-ad]
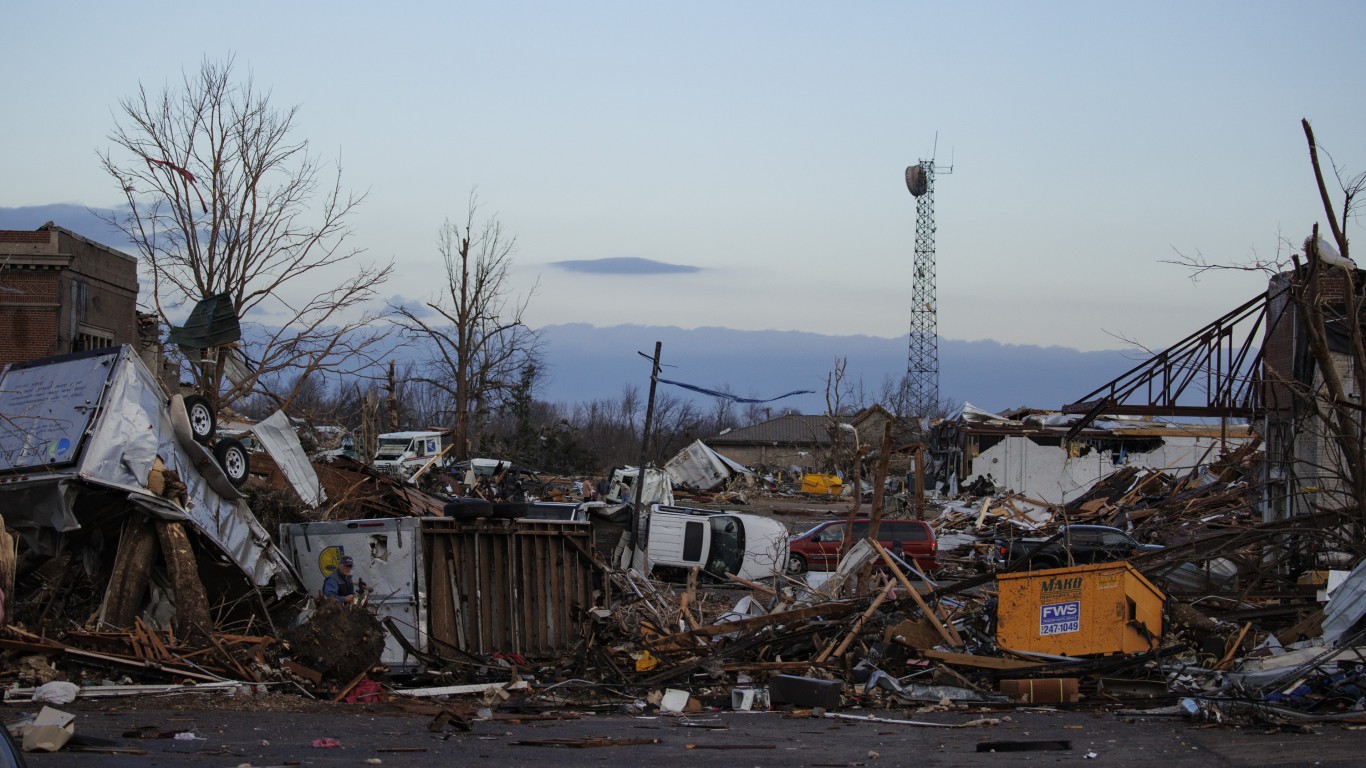
9. Kentucky
> Pct. adults displaced by natural disaster in past year: 1.8% (60,931)
> Pct. displaced adults who never returned home: 14.7% (8,938)
> Largest source of displacement: Tornado (10,585)
> FEMA major disaster declarations since 1953: 74
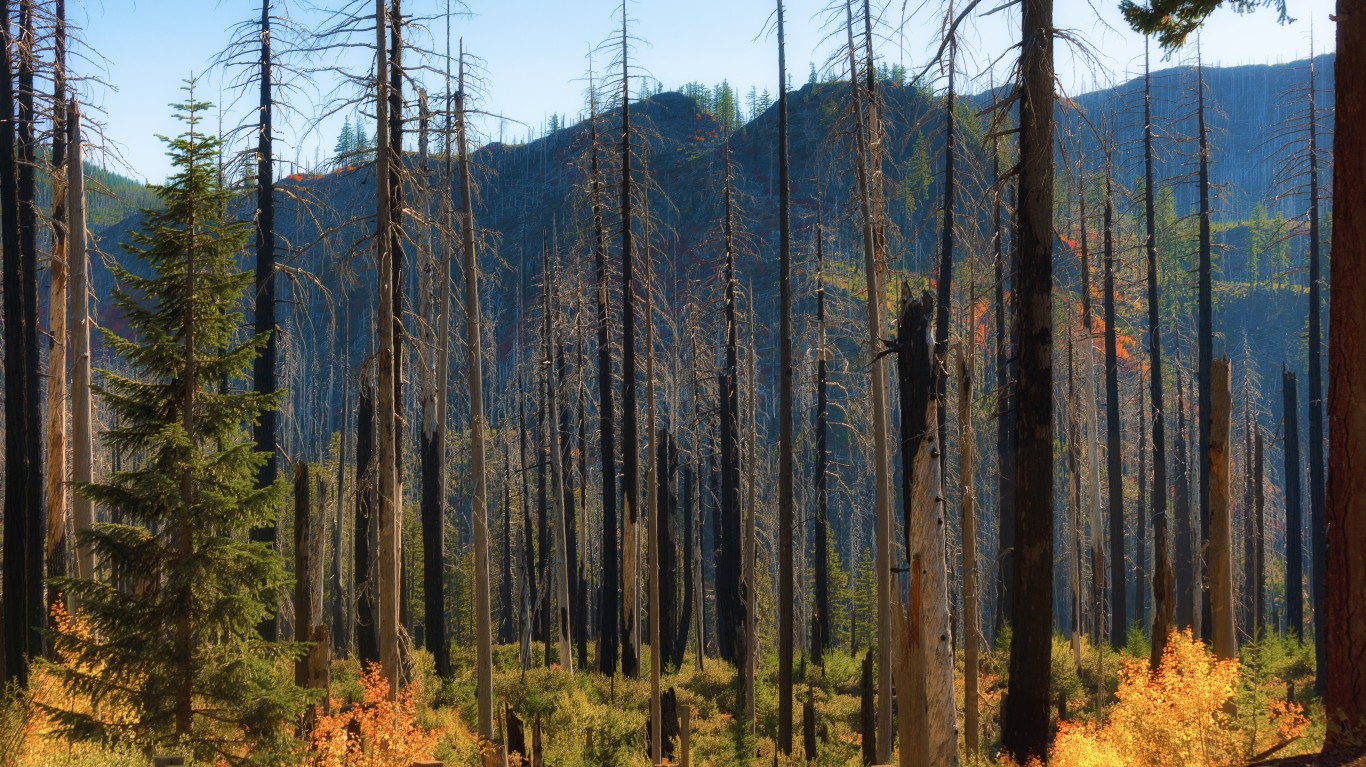
8. Oregon
> Pct. adults displaced by natural disaster in past year: 1.8% (60,799)
> Pct. displaced adults who never returned home: 35.2% (21,422)
> Largest source of displacement: Fire (41,496)
> FEMA major disaster declarations since 1953: 39
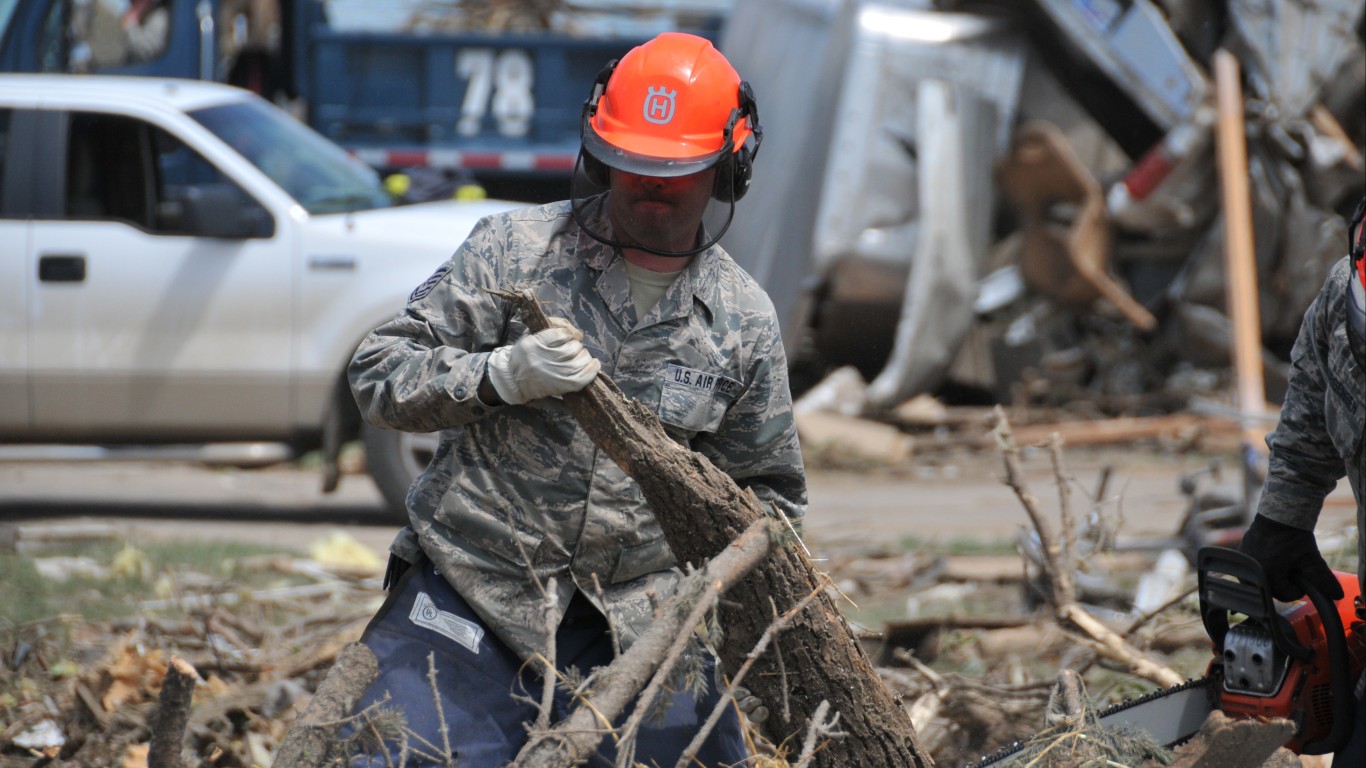
7. South Dakota
> Pct. adults displaced by natural disaster in past year: 1.8% (12,393)
> Pct. displaced adults who never returned home: 92.2% (11,421)
> Largest source of displacement: Tornado (295)
> FEMA major disaster declarations since 1953: 59
[in-text-ad-2]
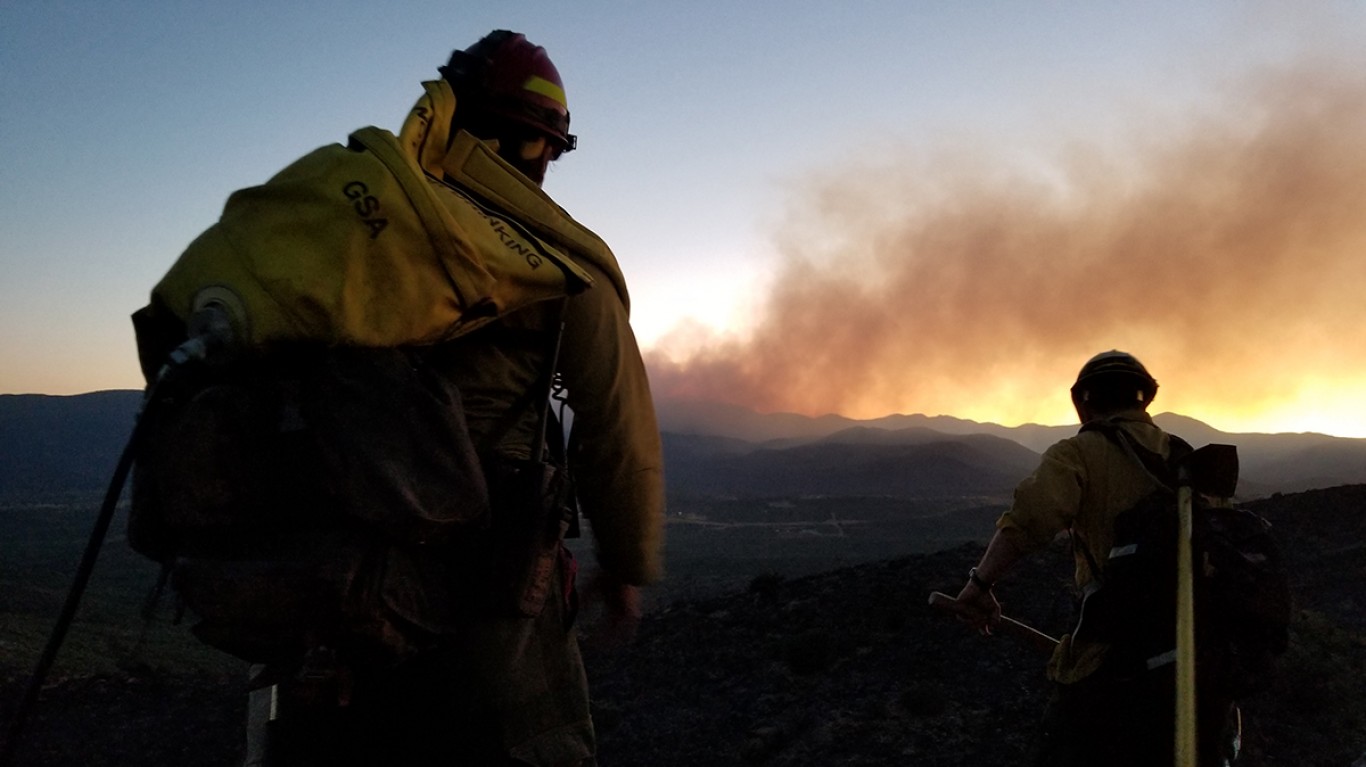
6. Montana
> Pct. adults displaced by natural disaster in past year: 1.9% (16,594)
> Pct. displaced adults who never returned home: 50.7% (8,418)
> Largest source of displacement: Fire (6,504)
> FEMA major disaster declarations since 1953: 33
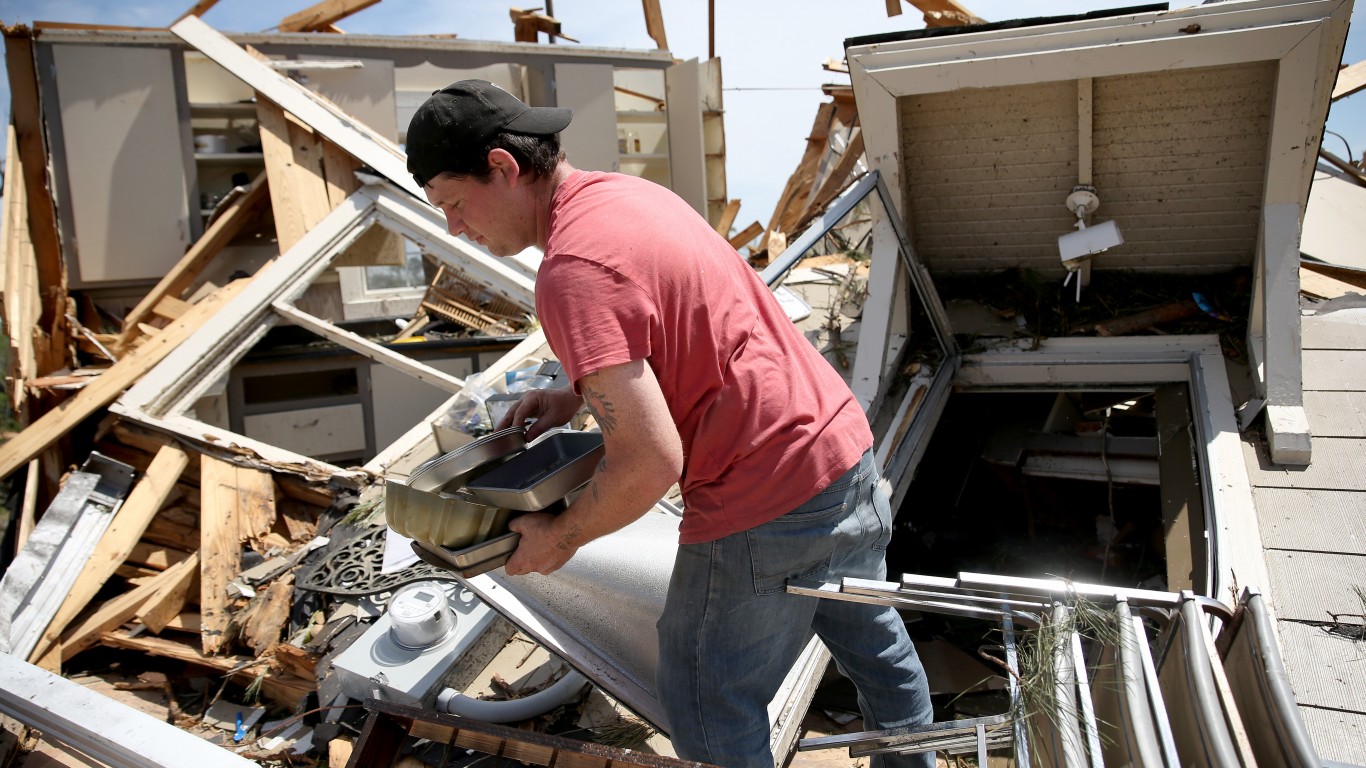
5. Mississippi
> Pct. adults displaced by natural disaster in past year: 3.2% (68,937)
> Pct. displaced adults who never returned home: 32.3% (22,264)
> Largest source of displacement: Tornado (28,906)
> FEMA major disaster declarations since 1953: 72
[in-text-ad]

4. Arkansas
> Pct. adults displaced by natural disaster in past year: 3.4% (78,153)
> Pct. displaced adults who never returned home: 4.7% (3,662)
> Largest source of displacement: Tornado (35,812)
> FEMA major disaster declarations since 1953: 71
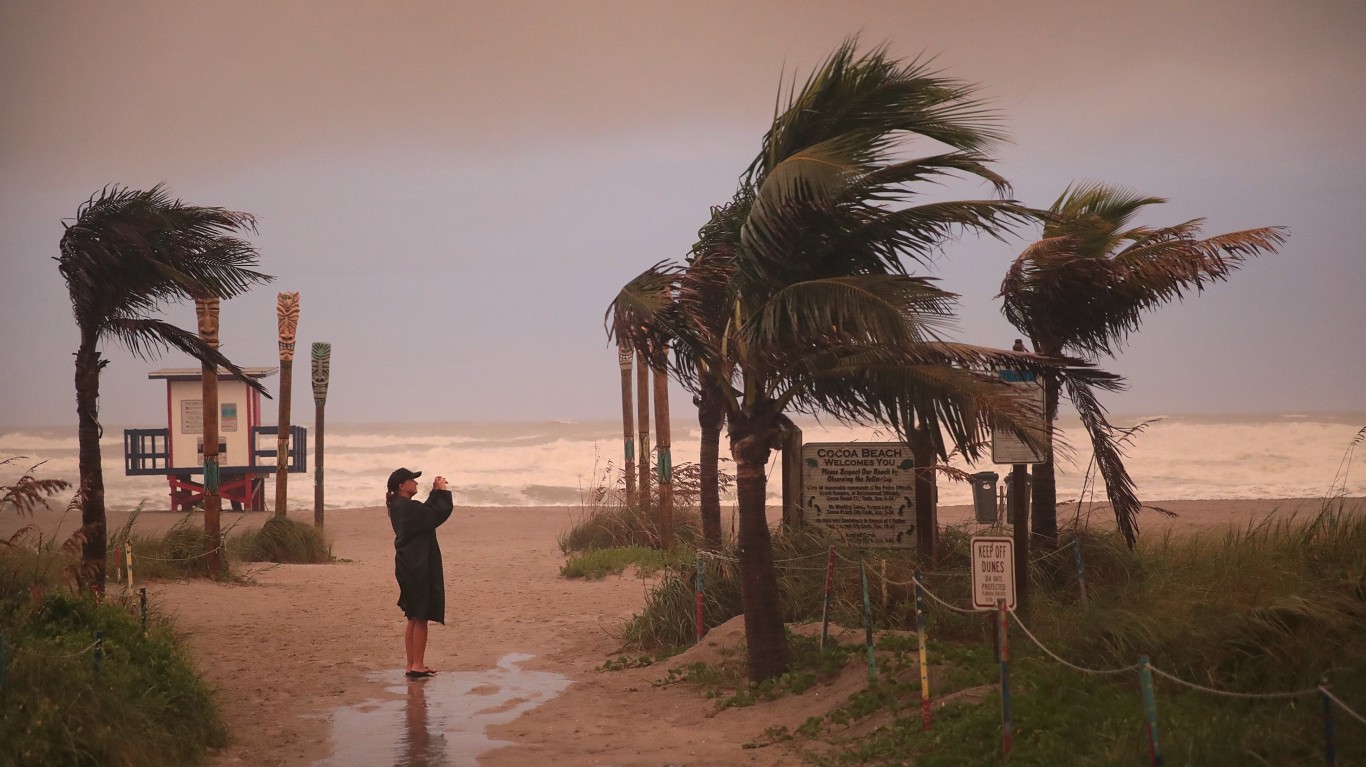
3. Florida
> Pct. adults displaced by natural disaster in past year: 4.2% (743,484)
> Pct. displaced adults who never returned home: 6.7% (49,906)
> Largest source of displacement: Hurricane (707,062)
> FEMA major disaster declarations since 1953: 80
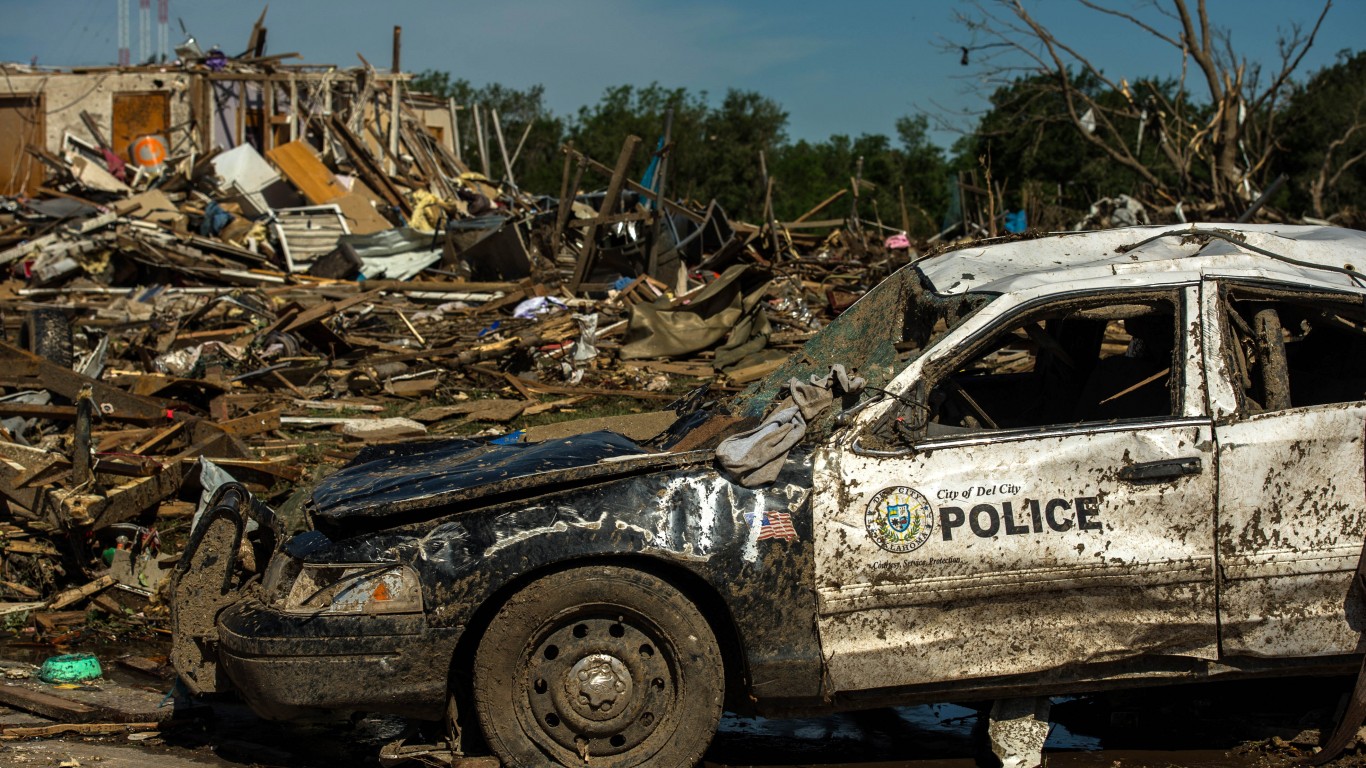
2. Oklahoma
> Pct. adults displaced by natural disaster in past year: 4.2% (124,947)
> Pct. displaced adults who never returned home: 15.6% (19,541)
> Largest source of displacement: Tornado (33,246)
> FEMA major disaster declarations since 1953: 94
[in-text-ad-2]
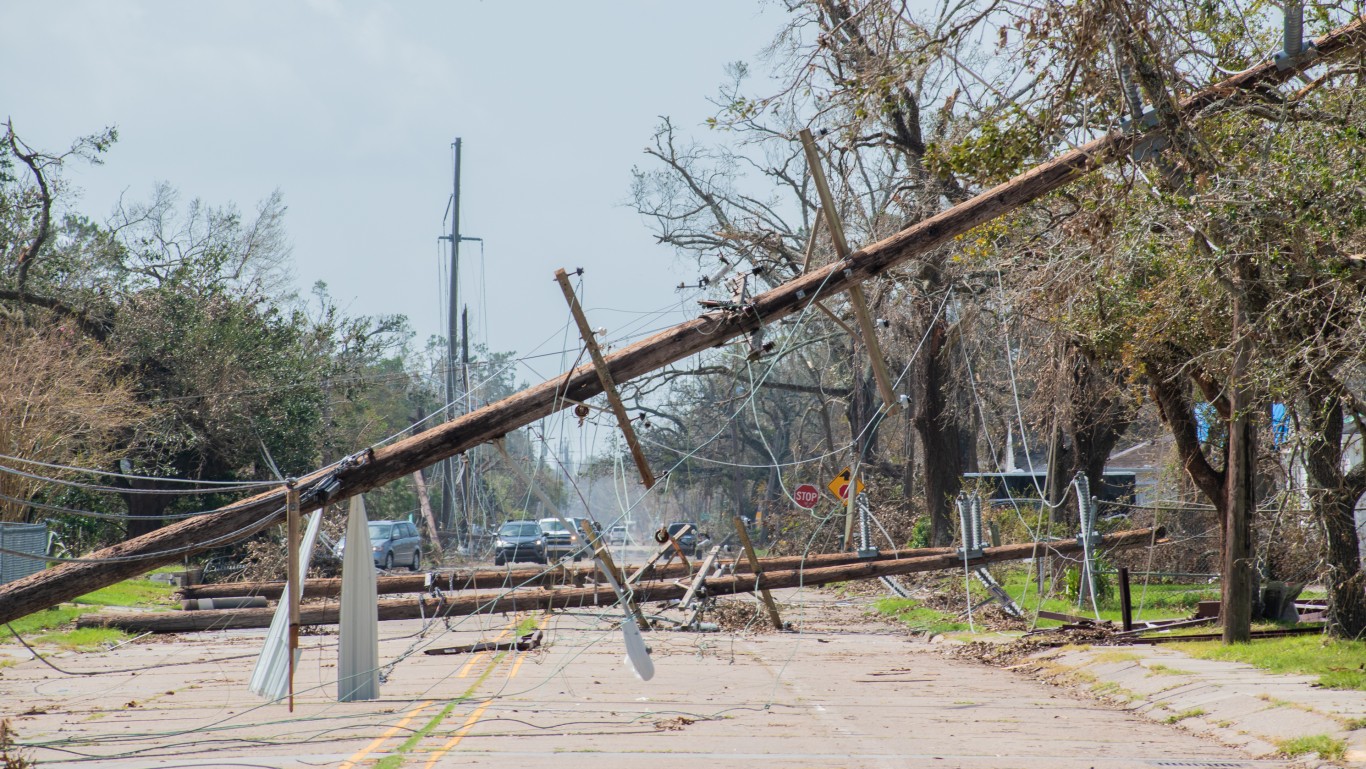
1. Louisiana
> Pct. adults displaced by natural disaster in past year: 6.6% (222,946)
> Pct. displaced adults who never returned home: 11.2% (24,989)
> Largest source of displacement: Hurricane (144,623)
> FEMA major disaster declarations since 1953: 75
The thought of burdening your family with a financial disaster is most Americans’ nightmare. However, recent studies show that over 100 million Americans still don’t have proper life insurance in the event they pass away.
Life insurance can bring peace of mind – ensuring your loved ones are safeguarded against unforeseen expenses and debts. With premiums often lower than expected and a variety of plans tailored to different life stages and health conditions, securing a policy is more accessible than ever.
A quick, no-obligation quote can provide valuable insight into what’s available and what might best suit your family’s needs. Life insurance is a simple step you can take today to help secure peace of mind for your loved ones tomorrow.
Click here to learn how to get a quote in just a few minutes.
Thank you for reading! Have some feedback for us?
Contact the 24/7 Wall St. editorial team.