On July 26, the Federal Reserve increased its benchmark interest rate by a quarter of a point, to a range of 5.25% to 5.5%, making it more expensive to borrow money for everything from business loans to home mortgages. It was the 11th hike since the Fed declared war on inflation on March 17, 2022, when the rate was increased to a range of 0.25% to 0.5%.
Federal Reserve Chair Jerome Powell has warned more hikes may be forthcoming in an effort to pull inflation back down to 2% from its current 3%. (Inflation hit a 40-year high of 9.1% in June 2022.)
Despite the marked decrease in consumer prices, most people are still on edge about rising prices. Last year, the Fed’s annual survey of household economic well-being deduced that 37% of Americans lack enough money to cover a $400 emergency expense.
To determine the states where inflation is stressing people out the most, 24/7 Tempo reviewed data on inflation-related stress levels from the U.S. Census Bureau’s Household Pulse Survey. States were ranked based on the percentage of adults who report experiencing moderate or severe stress caused increases in prices in the past two months.
Supplemental data on the percentage of adults who report having difficulty paying for household expenses in the previous seven days (respondents were surveyed between June 28 and July 10, 2023) also came from the Household Pulse Survey. Data used to calculate the percentage change in personal consumption expenditures per capita – a measure of inflation – from 2020 to 2021 and the percentage change in personal income per capita over the same period comes from the U.S. Bureau of Economic Analysis. (These are the states with the highest per capita income.)
Here is where inflation is stressing out the most people
The share of adults reporting “moderate” to “severe” stress from higher prices ranged from 52% in Minnesota to 69% in West Virginia. Among the 10 most populous states, where more than half of the people in the country reside, Florida had the largest share of these stressed-out adults at 65.7%, while nearly 66% of adult Texans reported difficulties in paying for household expenses. (Here’s a list of the American cities with the most credit card debt.)
Increases in per capita personal consumption expenditures ranged from 9.9% in Vermont and New Hampshire to 14.5% in Florida, while per capita personal income growth varied from 6.1% in Missouri to 8.7% in California.
Inflation pushes personal consumption expenditures higher as consumers pay more for products and services. When personal consumption increases at a higher rate than personal income, it forces consumers to cut spending on non-essentials like streaming services and purchase cheaper, lower-quality products. It can also increase personal or household debt.

50. Minnesota
> Pct. adults reporting moderate to severe stress around inflation: 51.5%
> Pct. adults reporting difficulty paying for household expenses: 52.1% (the lowest)
> Chg. in personal consumption expenditures per capita, 2020 to 2021: +10.1% (3rd lowest)
> Chg. in personal income per capita, 2020 to 2021: +6.5% (19th lowest)
[in-text-ad]

49. Maine
> Pct. adults reporting moderate to severe stress around inflation: 54.3%
> Pct. adults reporting difficulty paying for household expenses: 62.0% (19th highest)
> Chg. in personal consumption expenditures per capita, 2020 to 2021: +12.2% (24th lowest)
> Chg. in personal income per capita, 2020 to 2021: +6.2% (14th lowest)

48. Massachusetts
> Pct. adults reporting moderate to severe stress around inflation: 55.0%
> Pct. adults reporting difficulty paying for household expenses: 57.4% (9th lowest)
> Chg. in personal consumption expenditures per capita, 2020 to 2021: +14.0% (3rd highest)
> Chg. in personal income per capita, 2020 to 2021: +6.2% (16th lowest)

47. Hawaii
> Pct. adults reporting moderate to severe stress around inflation: 55.2%
> Pct. adults reporting difficulty paying for household expenses: 63.5% (16th highest)
> Chg. in personal consumption expenditures per capita, 2020 to 2021: +11.5% (14th lowest)
> Chg. in personal income per capita, 2020 to 2021: +6.0% (11th lowest)
[in-text-ad-2]
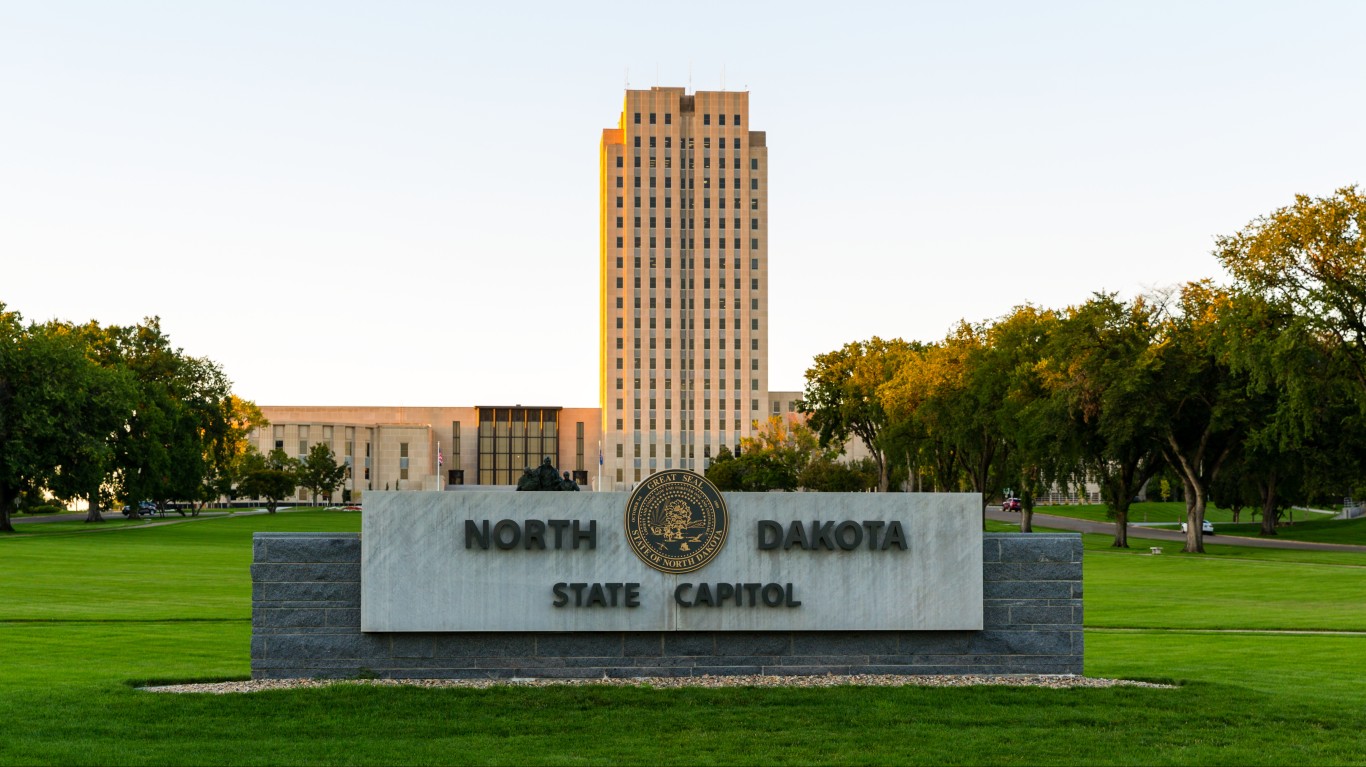
46. North Dakota
> Pct. adults reporting moderate to severe stress around inflation: 55.9%
> Pct. adults reporting difficulty paying for household expenses: 56.8% (8th lowest)
> Chg. in personal consumption expenditures per capita, 2020 to 2021: +11.0% (7th lowest)
> Chg. in personal income per capita, 2020 to 2021: +5.7% (7th lowest)

45. Pennsylvania
> Pct. adults reporting moderate to severe stress around inflation: 56.1%
> Pct. adults reporting difficulty paying for household expenses: 61.4% (23rd highest)
> Chg. in personal consumption expenditures per capita, 2020 to 2021: +11.2% (11th lowest)
> Chg. in personal income per capita, 2020 to 2021: +5.6% (6th lowest)
[in-text-ad]
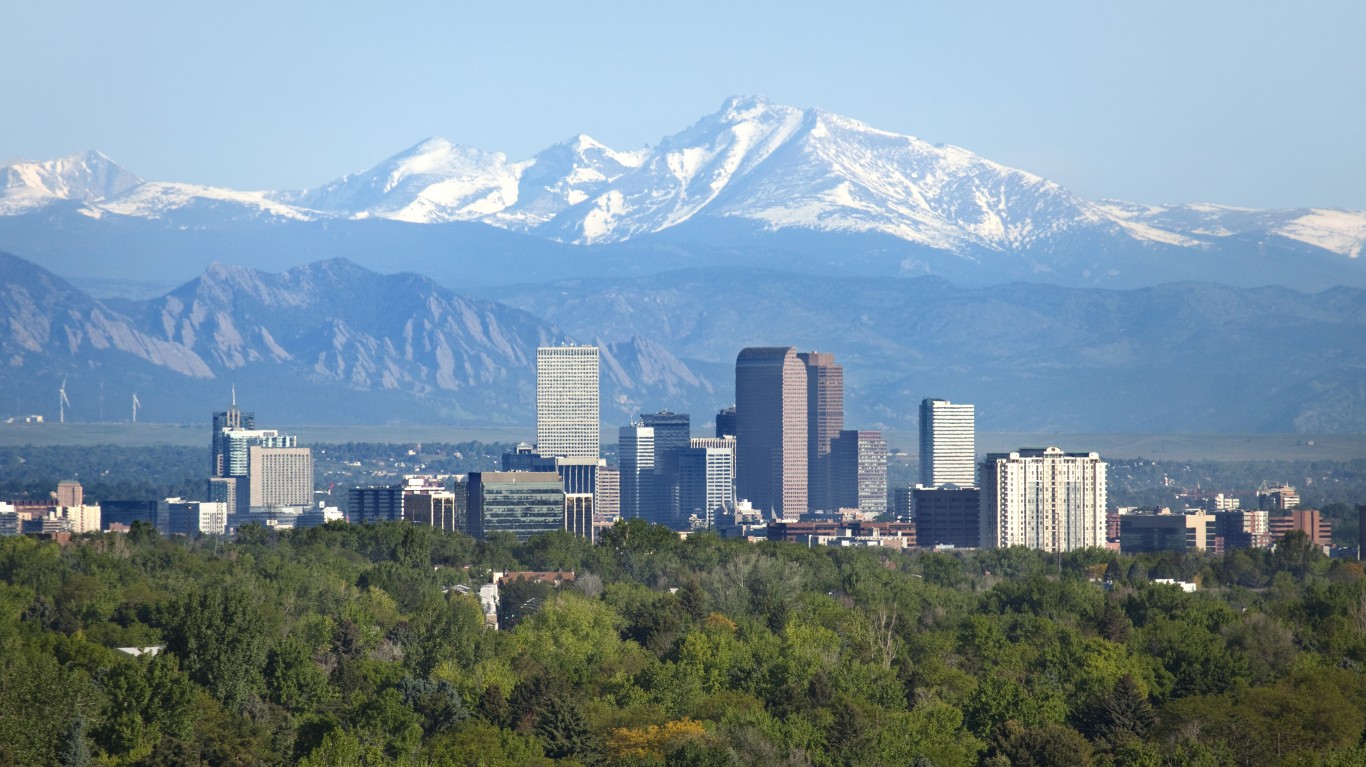
44. Colorado
> Pct. adults reporting moderate to severe stress around inflation: 56.1%
> Pct. adults reporting difficulty paying for household expenses: 59.9% (21st lowest)
> Chg. in personal consumption expenditures per capita, 2020 to 2021: +13.4% (8th highest)
> Chg. in personal income per capita, 2020 to 2021: +8.2% (5th highest)

43. Iowa
> Pct. adults reporting moderate to severe stress around inflation: 56.2%
> Pct. adults reporting difficulty paying for household expenses: 56.6% (7th lowest)
> Chg. in personal consumption expenditures per capita, 2020 to 2021: +11.6% (17th lowest)
> Chg. in personal income per capita, 2020 to 2021: +7.1% (21st highest)

42. Wisconsin
> Pct. adults reporting moderate to severe stress around inflation: 56.5%
> Pct. adults reporting difficulty paying for household expenses: 53.8% (2nd lowest)
> Chg. in personal consumption expenditures per capita, 2020 to 2021: +10.9% (5th lowest)
> Chg. in personal income per capita, 2020 to 2021: +6.9% (25th highest)
[in-text-ad-2]

41. Virginia
> Pct. adults reporting moderate to severe stress around inflation: 57.1%
> Pct. adults reporting difficulty paying for household expenses: 58.6% (15th lowest)
> Chg. in personal consumption expenditures per capita, 2020 to 2021: +12.6% (21st highest)
> Chg. in personal income per capita, 2020 to 2021: +6.5% (20th lowest)

40. Vermont
> Pct. adults reporting moderate to severe stress around inflation: 57.8%
> Pct. adults reporting difficulty paying for household expenses: 56.5% (6th lowest)
> Chg. in personal consumption expenditures per capita, 2020 to 2021: +9.9% (the lowest)
> Chg. in personal income per capita, 2020 to 2021: +4.2% (the lowest)
[in-text-ad]

39. Alaska
> Pct. adults reporting moderate to severe stress around inflation: 58.1%
> Pct. adults reporting difficulty paying for household expenses: 59.2% (17th lowest)
> Chg. in personal consumption expenditures per capita, 2020 to 2021: +11.1% (8th lowest)
> Chg. in personal income per capita, 2020 to 2021: +4.7% (2nd lowest)

38. Michigan
> Pct. adults reporting moderate to severe stress around inflation: 59.0%
> Pct. adults reporting difficulty paying for household expenses: 60.9% (25th highest)
> Chg. in personal consumption expenditures per capita, 2020 to 2021: +11.4% (12th lowest)
> Chg. in personal income per capita, 2020 to 2021: +6.0% (10th lowest)

37. Maryland
> Pct. adults reporting moderate to severe stress around inflation: 59.0%
> Pct. adults reporting difficulty paying for household expenses: 57.6% (10th lowest)
> Chg. in personal consumption expenditures per capita, 2020 to 2021: +11.4% (13th lowest)
> Chg. in personal income per capita, 2020 to 2021: +6.1% (12th lowest)
[in-text-ad-2]

36. Washington
> Pct. adults reporting moderate to severe stress around inflation: 59.0%
> Pct. adults reporting difficulty paying for household expenses: 55.8% (4th lowest)
> Chg. in personal consumption expenditures per capita, 2020 to 2021: +12.0% (21st lowest)
> Chg. in personal income per capita, 2020 to 2021: +8.0% (10th highest)

35. Illinois
> Pct. adults reporting moderate to severe stress around inflation: 59.2%
> Pct. adults reporting difficulty paying for household expenses: 60.5% (24th lowest)
> Chg. in personal consumption expenditures per capita, 2020 to 2021: +13.9% (5th highest)
> Chg. in personal income per capita, 2020 to 2021: +8.1% (7th highest)
[in-text-ad]

34. South Dakota
> Pct. adults reporting moderate to severe stress around inflation: 60.0%
> Pct. adults reporting difficulty paying for household expenses: 59.1% (16th lowest)
> Chg. in personal consumption expenditures per capita, 2020 to 2021: +13.0% (15th highest)
> Chg. in personal income per capita, 2020 to 2021: +6.6% (22nd lowest)

33. Connecticut
> Pct. adults reporting moderate to severe stress around inflation: 60.5%
> Pct. adults reporting difficulty paying for household expenses: 58.5% (14th lowest)
> Chg. in personal consumption expenditures per capita, 2020 to 2021: +11.6% (16th lowest)
> Chg. in personal income per capita, 2020 to 2021: +5.6% (5th lowest)

32. Missouri
> Pct. adults reporting moderate to severe stress around inflation: 60.6%
> Pct. adults reporting difficulty paying for household expenses: 64.4% (13th highest)
> Chg. in personal consumption expenditures per capita, 2020 to 2021: +12.1% (23rd lowest)
> Chg. in personal income per capita, 2020 to 2021: +6.1% (13th lowest)
[in-text-ad-2]

31. New Mexico
> Pct. adults reporting moderate to severe stress around inflation: 60.6%
> Pct. adults reporting difficulty paying for household expenses: 65.5% (10th highest)
> Chg. in personal consumption expenditures per capita, 2020 to 2021: +13.9% (4th highest)
> Chg. in personal income per capita, 2020 to 2021: +7.6% (15th highest)

30. California
> Pct. adults reporting moderate to severe stress around inflation: 60.7%
> Pct. adults reporting difficulty paying for household expenses: 61.5% (22nd highest)
> Chg. in personal consumption expenditures per capita, 2020 to 2021: +13.4% (7th highest)
> Chg. in personal income per capita, 2020 to 2021: +8.7% (the highest)
[in-text-ad]

29. Delaware
> Pct. adults reporting moderate to severe stress around inflation: 61.2%
> Pct. adults reporting difficulty paying for household expenses: 58.0% (11th lowest)
> Chg. in personal consumption expenditures per capita, 2020 to 2021: +12.4% (25th highest)
> Chg. in personal income per capita, 2020 to 2021: +6.3% (17th lowest)

28. Tennessee
> Pct. adults reporting moderate to severe stress around inflation: 61.2%
> Pct. adults reporting difficulty paying for household expenses: 64.6% (12th highest)
> Chg. in personal consumption expenditures per capita, 2020 to 2021: +13.3% (10th highest)
> Chg. in personal income per capita, 2020 to 2021: +8.2% (4th highest)

27. Oregon
> Pct. adults reporting moderate to severe stress around inflation: 61.3%
> Pct. adults reporting difficulty paying for household expenses: 58.4% (12th lowest)
> Chg. in personal consumption expenditures per capita, 2020 to 2021: +13.1% (12th highest)
> Chg. in personal income per capita, 2020 to 2021: +7.9% (11th highest)
[in-text-ad-2]

26. Indiana
> Pct. adults reporting moderate to severe stress around inflation: 61.4%
> Pct. adults reporting difficulty paying for household expenses: 63.4% (17th highest)
> Chg. in personal consumption expenditures per capita, 2020 to 2021: +12.0% (22nd lowest)
> Chg. in personal income per capita, 2020 to 2021: +8.1% (6th highest)

25. Nebraska
> Pct. adults reporting moderate to severe stress around inflation: 61.7%
> Pct. adults reporting difficulty paying for household expenses: 58.4% (13th lowest)
> Chg. in personal consumption expenditures per capita, 2020 to 2021: +13.2% (11th highest)
> Chg. in personal income per capita, 2020 to 2021: +6.7% (24th lowest)
[in-text-ad]

24. New York
> Pct. adults reporting moderate to severe stress around inflation: 61.7%
> Pct. adults reporting difficulty paying for household expenses: 61.2% (24th highest)
> Chg. in personal consumption expenditures per capita, 2020 to 2021: +11.1% (9th lowest)
> Chg. in personal income per capita, 2020 to 2021: +7.0% (23rd highest)

23. Montana
> Pct. adults reporting moderate to severe stress around inflation: 61.8%
> Pct. adults reporting difficulty paying for household expenses: 60.1% (22nd lowest)
> Chg. in personal consumption expenditures per capita, 2020 to 2021: +13.0% (14th highest)
> Chg. in personal income per capita, 2020 to 2021: +5.2% (3rd lowest)

22. New Jersey
> Pct. adults reporting moderate to severe stress around inflation: 62.1%
> Pct. adults reporting difficulty paying for household expenses: 56.5% (5th lowest)
> Chg. in personal consumption expenditures per capita, 2020 to 2021: +13.4% (9th highest)
> Chg. in personal income per capita, 2020 to 2021: +7.6% (14th highest)
[in-text-ad-2]

21. Rhode Island
> Pct. adults reporting moderate to severe stress around inflation: 62.5%
> Pct. adults reporting difficulty paying for household expenses: 55.8% (3rd lowest)
> Chg. in personal consumption expenditures per capita, 2020 to 2021: +12.9% (17th highest)
> Chg. in personal income per capita, 2020 to 2021: +7.3% (20th highest)

20. North Carolina
> Pct. adults reporting moderate to severe stress around inflation: 62.7%
> Pct. adults reporting difficulty paying for household expenses: 60.9% (25th lowest)
> Chg. in personal consumption expenditures per capita, 2020 to 2021: +12.8% (20th highest)
> Chg. in personal income per capita, 2020 to 2021: +8.0% (9th highest)
[in-text-ad]

19. Utah
> Pct. adults reporting moderate to severe stress around inflation: 63.0%
> Pct. adults reporting difficulty paying for household expenses: 63.8% (15th highest)
> Chg. in personal consumption expenditures per capita, 2020 to 2021: +14.3% (2nd highest)
> Chg. in personal income per capita, 2020 to 2021: +7.3% (19th highest)

18. Idaho
> Pct. adults reporting moderate to severe stress around inflation: 63.3%
> Pct. adults reporting difficulty paying for household expenses: 60.1% (23rd lowest)
> Chg. in personal consumption expenditures per capita, 2020 to 2021: +12.8% (18th highest)
> Chg. in personal income per capita, 2020 to 2021: +5.7% (8th lowest)

17. Alabama
> Pct. adults reporting moderate to severe stress around inflation: 63.6%
> Pct. adults reporting difficulty paying for household expenses: 68.4% (2nd highest)
> Chg. in personal consumption expenditures per capita, 2020 to 2021: +12.5% (23rd highest)
> Chg. in personal income per capita, 2020 to 2021: +7.7% (12th highest)
[in-text-ad-2]

16. Arizona
> Pct. adults reporting moderate to severe stress around inflation: 63.8%
> Pct. adults reporting difficulty paying for household expenses: 61.9% (20th highest)
> Chg. in personal consumption expenditures per capita, 2020 to 2021: +11.5% (15th lowest)
> Chg. in personal income per capita, 2020 to 2021: +6.2% (15th lowest)

15. Kentucky
> Pct. adults reporting moderate to severe stress around inflation: 64.0%
> Pct. adults reporting difficulty paying for household expenses: 65.7% (9th highest)
> Chg. in personal consumption expenditures per capita, 2020 to 2021: +12.0% (20th lowest)
> Chg. in personal income per capita, 2020 to 2021: +8.0% (8th highest)
[in-text-ad]

14. Ohio
> Pct. adults reporting moderate to severe stress around inflation: 64.0%
> Pct. adults reporting difficulty paying for household expenses: 59.5% (19th lowest)
> Chg. in personal consumption expenditures per capita, 2020 to 2021: +11.2% (10th lowest)
> Chg. in personal income per capita, 2020 to 2021: +6.4% (18th lowest)

13. Kansas
> Pct. adults reporting moderate to severe stress around inflation: 64.0%
> Pct. adults reporting difficulty paying for household expenses: 59.6% (20th lowest)
> Chg. in personal consumption expenditures per capita, 2020 to 2021: +11.6% (18th lowest)
> Chg. in personal income per capita, 2020 to 2021: +5.2% (4th lowest)

12. Texas
> Pct. adults reporting moderate to severe stress around inflation: 64.1%
> Pct. adults reporting difficulty paying for household expenses: 65.9% (8th highest)
> Chg. in personal consumption expenditures per capita, 2020 to 2021: +12.8% (19th highest)
> Chg. in personal income per capita, 2020 to 2021: +7.6% (13th highest)
[in-text-ad-2]

11. New Hampshire
> Pct. adults reporting moderate to severe stress around inflation: 64.2%
> Pct. adults reporting difficulty paying for household expenses: 59.4% (18th lowest)
> Chg. in personal consumption expenditures per capita, 2020 to 2021: +9.9% (2nd lowest)
> Chg. in personal income per capita, 2020 to 2021: +7.0% (24th highest)

10. Georgia
> Pct. adults reporting moderate to severe stress around inflation: 64.3%
> Pct. adults reporting difficulty paying for household expenses: 61.8% (21st highest)
> Chg. in personal consumption expenditures per capita, 2020 to 2021: +13.7% (6th highest)
> Chg. in personal income per capita, 2020 to 2021: +7.5% (17th highest)
[in-text-ad]

9. Wyoming
> Pct. adults reporting moderate to severe stress around inflation: 64.8%
> Pct. adults reporting difficulty paying for household expenses: 66.5% (6th highest)
> Chg. in personal consumption expenditures per capita, 2020 to 2021: +12.4% (24th highest)
> Chg. in personal income per capita, 2020 to 2021: +5.8% (9th lowest)

8. Oklahoma
> Pct. adults reporting moderate to severe stress around inflation: 65.2%
> Pct. adults reporting difficulty paying for household expenses: 67.0% (4th highest)
> Chg. in personal consumption expenditures per capita, 2020 to 2021: +11.0% (6th lowest)
> Chg. in personal income per capita, 2020 to 2021: +6.6% (21st lowest)
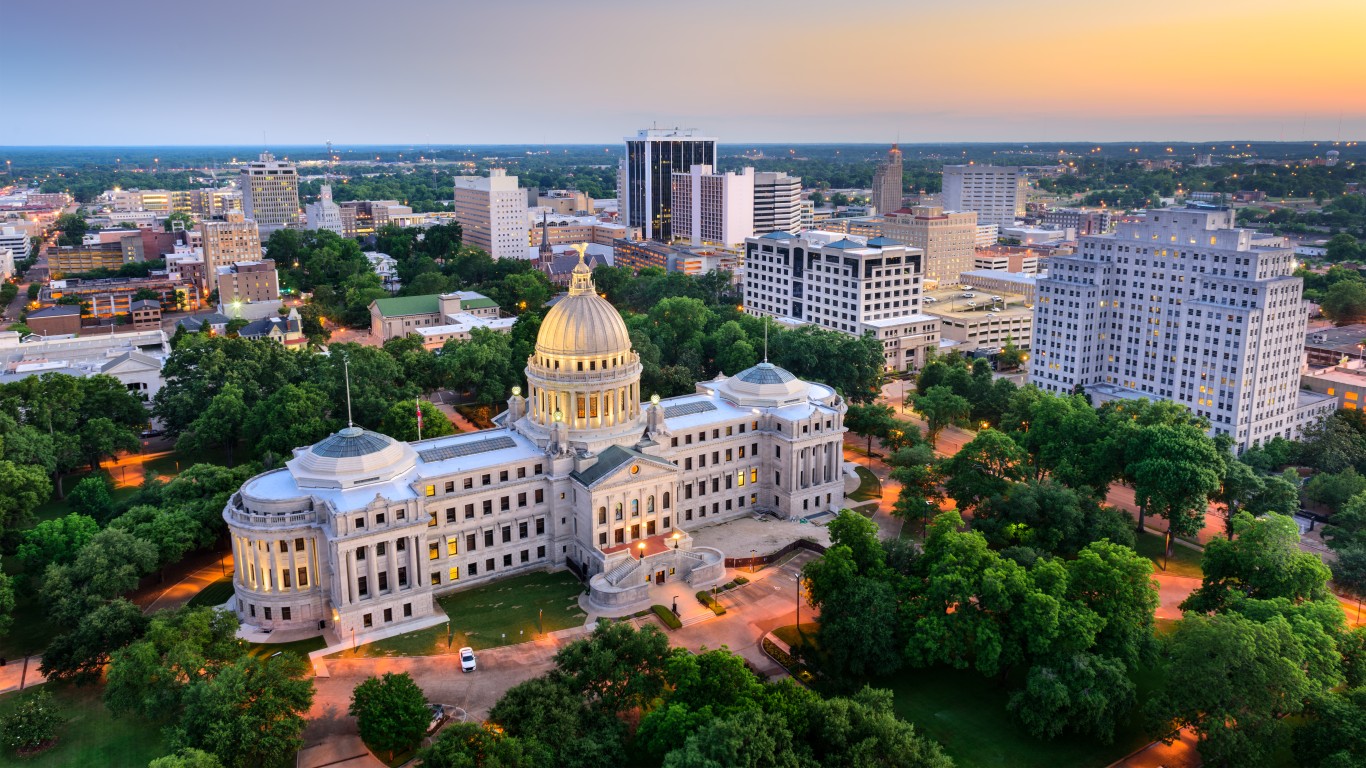
7. Mississippi
> Pct. adults reporting moderate to severe stress around inflation: 65.6%
> Pct. adults reporting difficulty paying for household expenses: 72.5% (the highest)
> Chg. in personal consumption expenditures per capita, 2020 to 2021: +11.9% (19th lowest)
> Chg. in personal income per capita, 2020 to 2021: +7.5% (16th highest)
[in-text-ad-2]

6. Florida
> Pct. adults reporting moderate to severe stress around inflation: 65.7%
> Pct. adults reporting difficulty paying for household expenses: 62.8% (18th highest)
> Chg. in personal consumption expenditures per capita, 2020 to 2021: +14.5% (the highest)
> Chg. in personal income per capita, 2020 to 2021: +8.6% (3rd highest)

5. Arkansas
> Pct. adults reporting moderate to severe stress around inflation: 66.1%
> Pct. adults reporting difficulty paying for household expenses: 66.2% (7th highest)
> Chg. in personal consumption expenditures per capita, 2020 to 2021: +12.2% (25th lowest)
> Chg. in personal income per capita, 2020 to 2021: +7.4% (18th highest)
[in-text-ad]

4. Nevada
> Pct. adults reporting moderate to severe stress around inflation: 66.1%
> Pct. adults reporting difficulty paying for household expenses: 66.8% (5th highest)
> Chg. in personal consumption expenditures per capita, 2020 to 2021: +12.6% (22nd highest)
> Chg. in personal income per capita, 2020 to 2021: +8.6% (2nd highest)

3. Louisiana
> Pct. adults reporting moderate to severe stress around inflation: 66.1%
> Pct. adults reporting difficulty paying for household expenses: 68.4% (3rd highest)
> Chg. in personal consumption expenditures per capita, 2020 to 2021: +13.1% (13th highest)
> Chg. in personal income per capita, 2020 to 2021: +6.6% (23rd lowest)
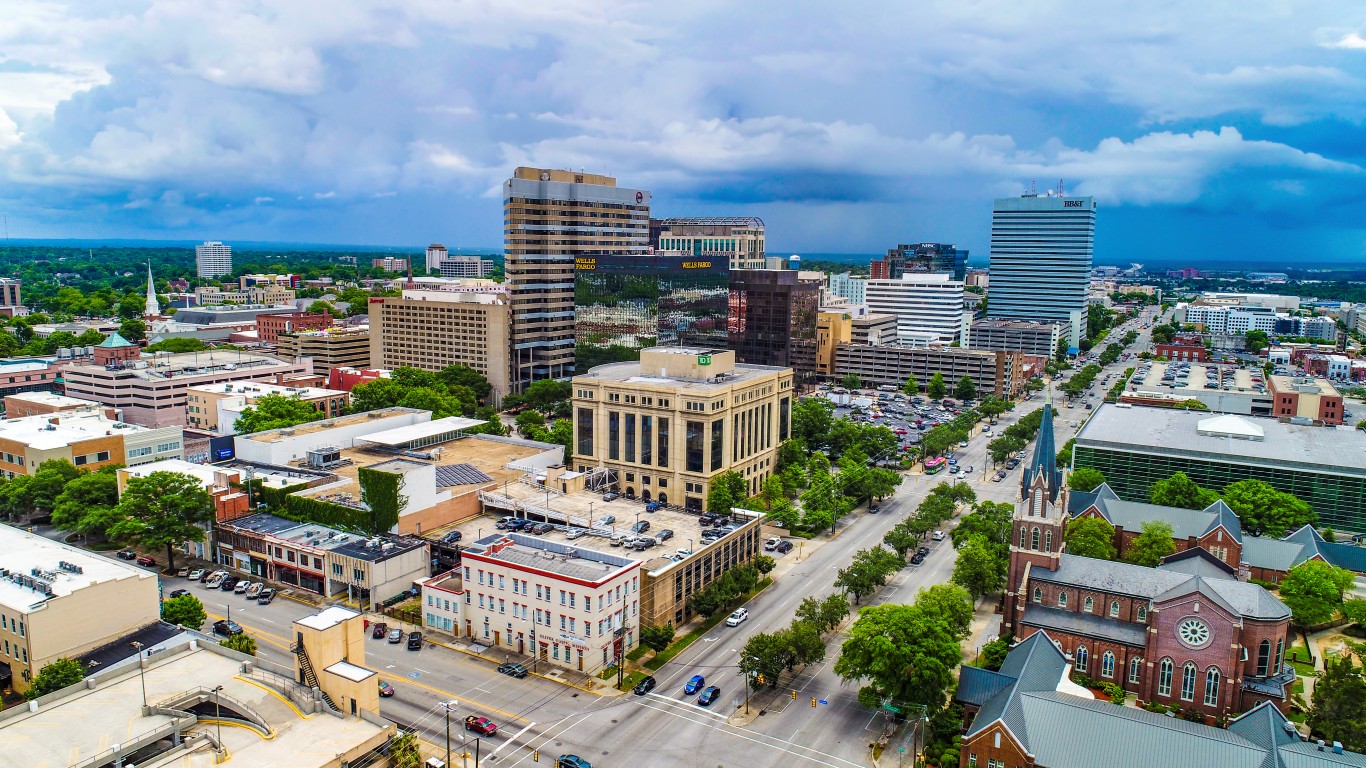
2. South Carolina
> Pct. adults reporting moderate to severe stress around inflation: 66.2%
> Pct. adults reporting difficulty paying for household expenses: 64.1% (14th highest)
> Chg. in personal consumption expenditures per capita, 2020 to 2021: +12.9% (16th highest)
> Chg. in personal income per capita, 2020 to 2021: +6.8% (25th lowest)
[in-text-ad-2]

1. West Virginia
> Pct. adults reporting moderate to severe stress around inflation: 69.0%
> Pct. adults reporting difficulty paying for household expenses: 65.3% (11th highest)
> Chg. in personal consumption expenditures per capita, 2020 to 2021: +10.7% (4th lowest)
> Chg. in personal income per capita, 2020 to 2021: +7.1% (22nd highest)
Are You Still Paying With a Debit Card?
The average American spends $17,274 on debit cards a year, and it’s a HUGE mistake. First, debit cards don’t have the same fraud protections as credit cards. Once your money is gone, it’s gone. But more importantly you can actually get something back from this spending every time you swipe.
Issuers are handing out wild bonuses right now. With some you can earn up to 5% back on every purchase. That’s like getting a 5% discount on everything you buy!
Our top pick is kind of hard to imagine. Not only does it pay up to 5% back, it also includes a $200 cash back reward in the first six months, a 0% intro APR, and…. $0 annual fee. It’s quite literally free money for any one that uses a card regularly. Click here to learn more!
Flywheel Publishing has partnered with CardRatings to provide coverage of credit card products. Flywheel Publishing and CardRatings may receive a commission from card issuers.
Thank you for reading! Have some feedback for us?
Contact the 24/7 Wall St. editorial team.
 24/7 Wall St.
