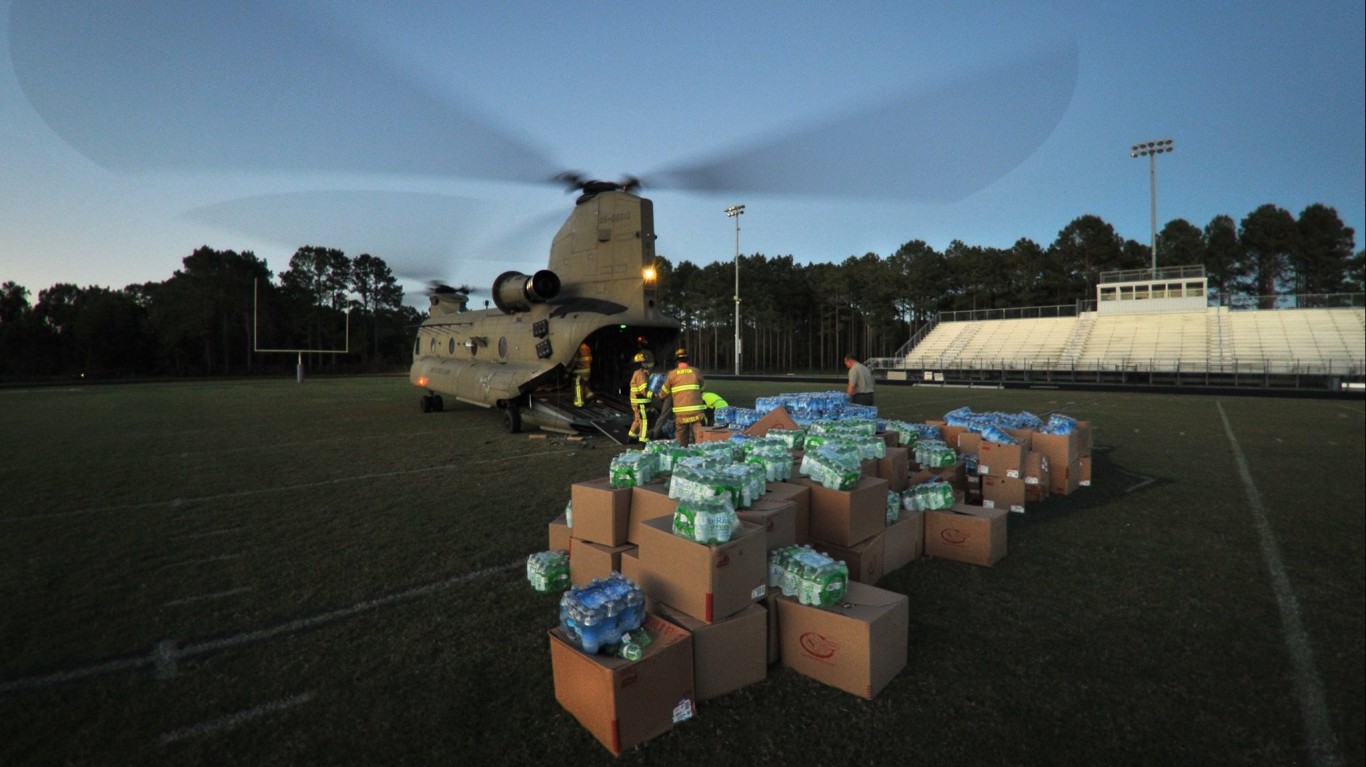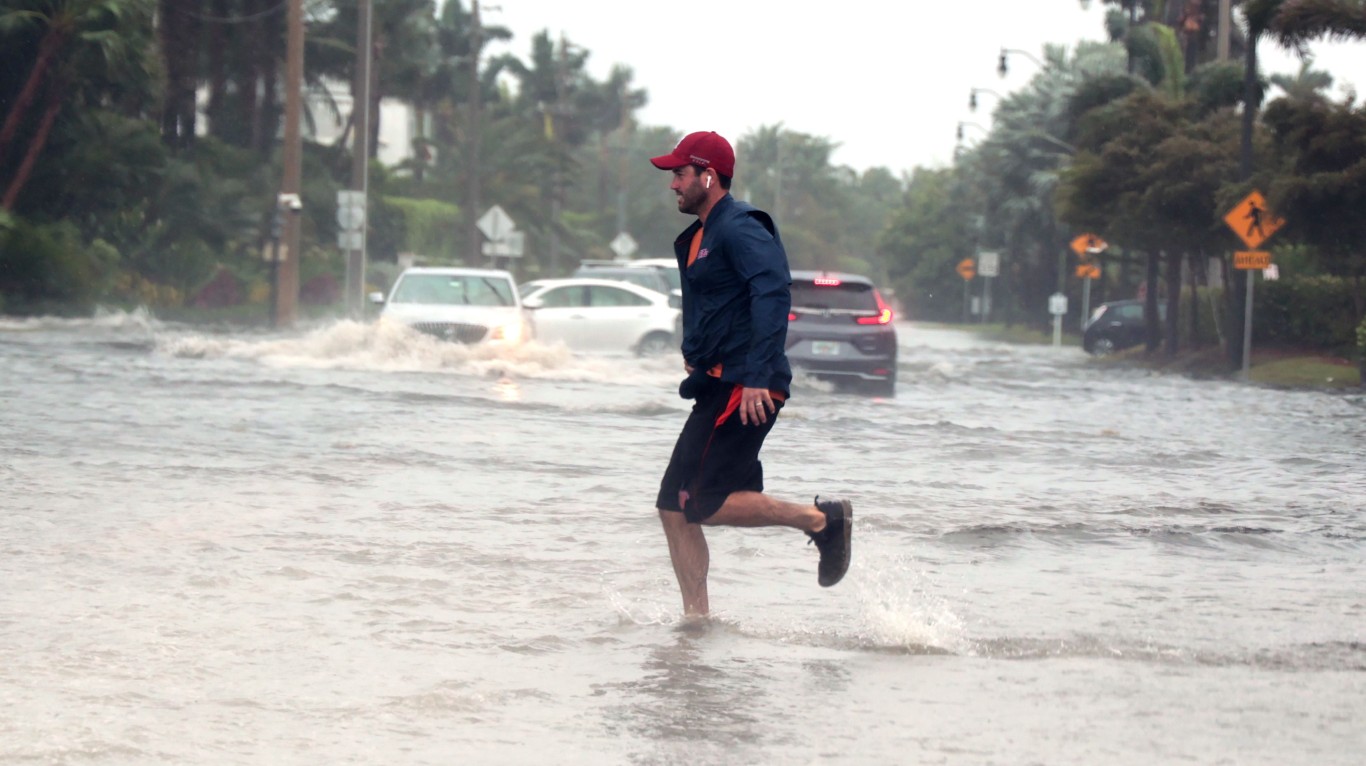
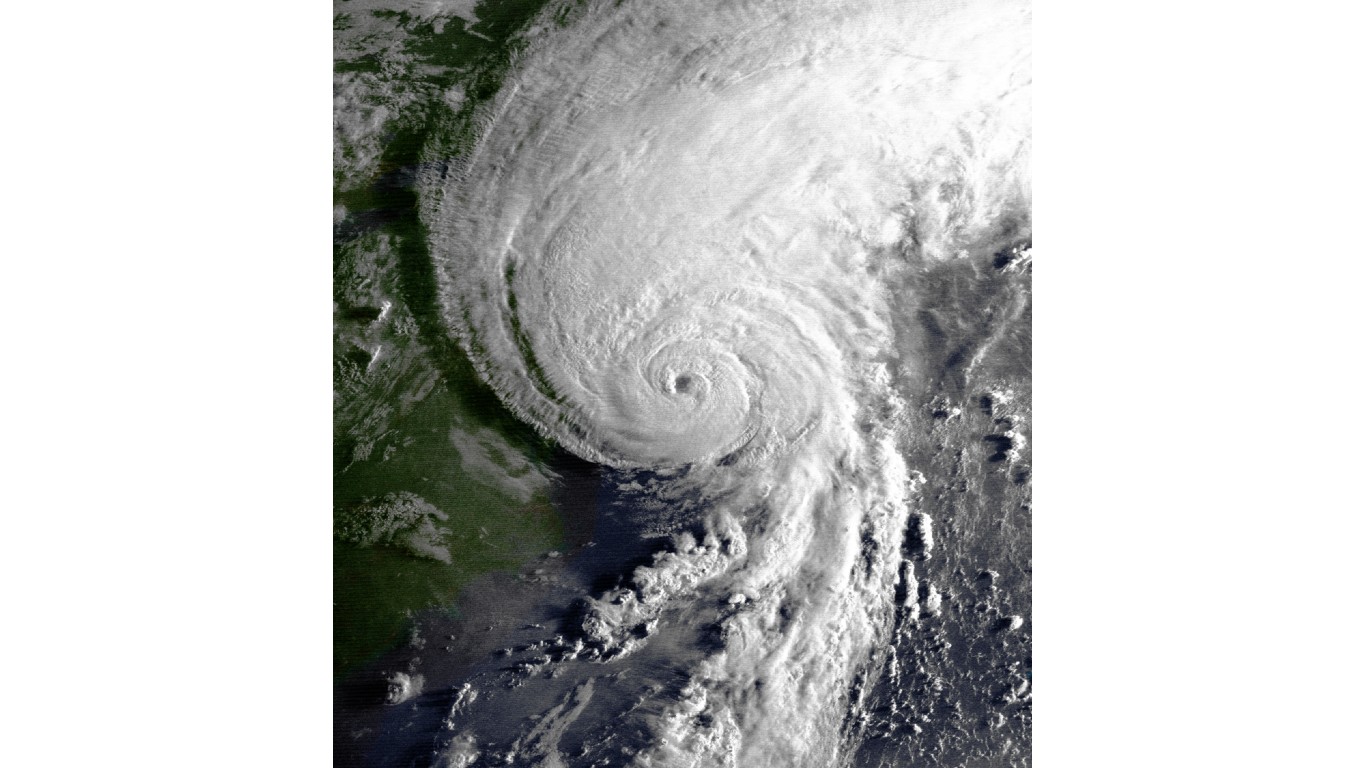
We are more than two months into the Atlantic hurricane season, which goes from June 1 to Nov. 30, but there has only been one hurricane. As of the end of July, Tropical Storm Don briefly reached hurricane status the weekend of July 22 before losing strength. Of course, the end of the season is still a long way off, and like other climatological phenomena these days, hurricanes do not always behave as we expect them to, and post-season occurrences are not out of the question.
While the New England states may feel the aftereffects of major hurricanes, and the violent storms can even cross the Atlantic (Hurricane Ophelia swept over Ireland in October 2017), it is the states along the lower southeastern seaboard and the Gulf of Mexico that bear their brunt.
To determine the 35 most hurricane-vulnerable counties in America, 24/7 Wall St. consulted gutter services company Gutter Gnome’s study, 2023’s Most Hurricane-Vulnerable Counties. Drawing on data from the Federal Emergency Management Agency, the National Center for Disaster Preparedness, and the National Oceanic and Atmospheric Administration, the site developed an index for the 318 U.S. counties with a Hurricane Risk Score determined by the NCDP. The index comprises nine differently weighted metrics such as hurricane risk, hurricane history over the past decade, and expected annual loss from hurricanes provides a score out of 100, with higher scores denoting greater vulnerability. County population figures are U.S. Census Bureau estimates as of July 1, 2022. (On a more granular level, these are the U.S. cities where hurricanes would cause the most damage.)
Click here to see the most hurricane-vulnerable counties in America.
Not surprisingly, a dozen of the most vulnerable counties are in Florida, with almost all the rest in North or South Carolina. Georgia and Texas also have one county each. Some counties that have been ravished by hurricanes in the past did not make the list because the history metrics considered only the past 10 years. Most notably, Orleans Parish, Louisiana, which was all but leveled by Hurricane Katrina in 2005, but has been relatively calm ever since, is not on the list. (See these before and after pictures of the worst hurricanes in American history.)
While coastal counties are the most likely to be affected, being inland is no guarantee of safety. Several counties on the list are 100 miles or more from the sea. And while Texas appears here only once, its Harris County — home of Houston, the nation’s fourth largest metro area — stands to suffer the most financially from hurricanes, to the tune of more than $1.1 billion a year.

35. Orangeburg County, SC
> Overall hurricane-vulnerability score: 51.5 out of 100
> Risk rank: #108 highest risk out of 318 counties
> Hurricane history rank: #17 highest risk out of 318 counties
> Financial impact rank: #116 highest impact out of 318 counties
> Population (2022): 83,094
[in-text-ad]
34. Dare County, NC
> Overall hurricane-vulnerability score: 52.02 out of 100
> Risk rank: #55 highest risk out of 318 counties
> Hurricane history rank: #43 highest risk out of 318 counties
> Financial impact rank: #51 highest impact out of 318 counties
> Population (2022): 36,314

33. Hillsborough County, FL
> Overall hurricane-vulnerability score: 52.05 out of 100
> Risk rank: #5 highest risk out of 318 counties
> Hurricane history rank: #183 highest risk out of 318 counties
> Financial impact rank: #5 highest impact out of 318 counties
> Population (2022): 1,525,108
32. Colleton County, SC
> Overall hurricane-vulnerability score: 52.24 out of 100
> Risk rank: #142 highest risk out of 318 counties
> Hurricane history rank: #2 highest risk out of 318 counties
> Financial impact rank: #153 highest impact out of 318 counties
> Population (2022): 36,702
[in-text-ad-2]
31. Martin County, FL
> Overall hurricane-vulnerability score: 52.97 out of 100
> Risk rank: #42 highest risk out of 318 counties
> Hurricane history rank: #56 highest risk out of 318 counties
> Financial impact rank: #39 highest impact out of 318 counties
> Population (2022): 162,678

30. Pasco County, FL
> Overall hurricane-vulnerability score: 53.01 out of 100
> Risk rank: #10 highest risk out of 318 counties
> Hurricane history rank: #102 highest risk out of 318 counties
> Financial impact rank: #14 highest impact out of 318 counties
> Population (2022): 592,146
[in-text-ad]

29. Craven County, NC
> Overall hurricane-vulnerability score: 53.07 out of 100
> Risk rank: #44 highest risk out of 318 counties
> Hurricane history rank: #43 highest risk out of 318 counties
> Financial impact rank: #46 highest impact out of 318 counties
> Population (2022): 102,112
28. Robeson County, NC
> Overall hurricane-vulnerability score: 53.11 out of 100
> Risk rank: #88 highest risk out of 318 counties
> Hurricane history rank: #17 highest risk out of 318 counties
> Financial impact rank: #105 highest impact out of 318 counties
> Population (2022): 131,559

27. Jasper County, SC
> Overall hurricane-vulnerability score: 53.49 out of 100
> Risk rank: #126 highest risk out of 318 counties
> Hurricane history rank: #2 highest risk out of 318 counties
> Financial impact rank: #147 highest impact out of 318 counties
> Population (2022): 27,713
[in-text-ad-2]

26. Duplin County, NC
> Overall hurricane-vulnerability score: 53.61 out of 100
> Risk rank: #83 highest risk out of 318 counties
> Hurricane history rank: #17 highest risk out of 318 counties
> Financial impact rank: #96 highest impact out of 318 counties
> Population (2022): 58,838
25. Bladen County, NC
> Overall hurricane-vulnerability score: 54.23 out of 100
> Risk rank: #117 highest risk out of 318 counties
> Hurricane history rank: #2 highest risk out of 318 counties
> Financial impact rank: #132 highest impact out of 318 counties
> Population (2022): 32,612
[in-text-ad]

24. Polk County, FL
> Overall hurricane-vulnerability score: 54.29 out of 100
> Risk rank: #31 highest risk out of 318 counties
> Hurricane history rank: #53 highest risk out of 318 counties
> Financial impact rank: #38 highest impact out of 318 counties
> Population (2022): 748,967
23. Brunswick County, NC
> Overall hurricane-vulnerability score: 54.34 out of 100
> Risk rank: #37 highest risk out of 318 counties
> Hurricane history rank: #43 highest risk out of 318 counties
> Financial impact rank: #27 highest impact out of 318 counties
> Population (2022): 156,872
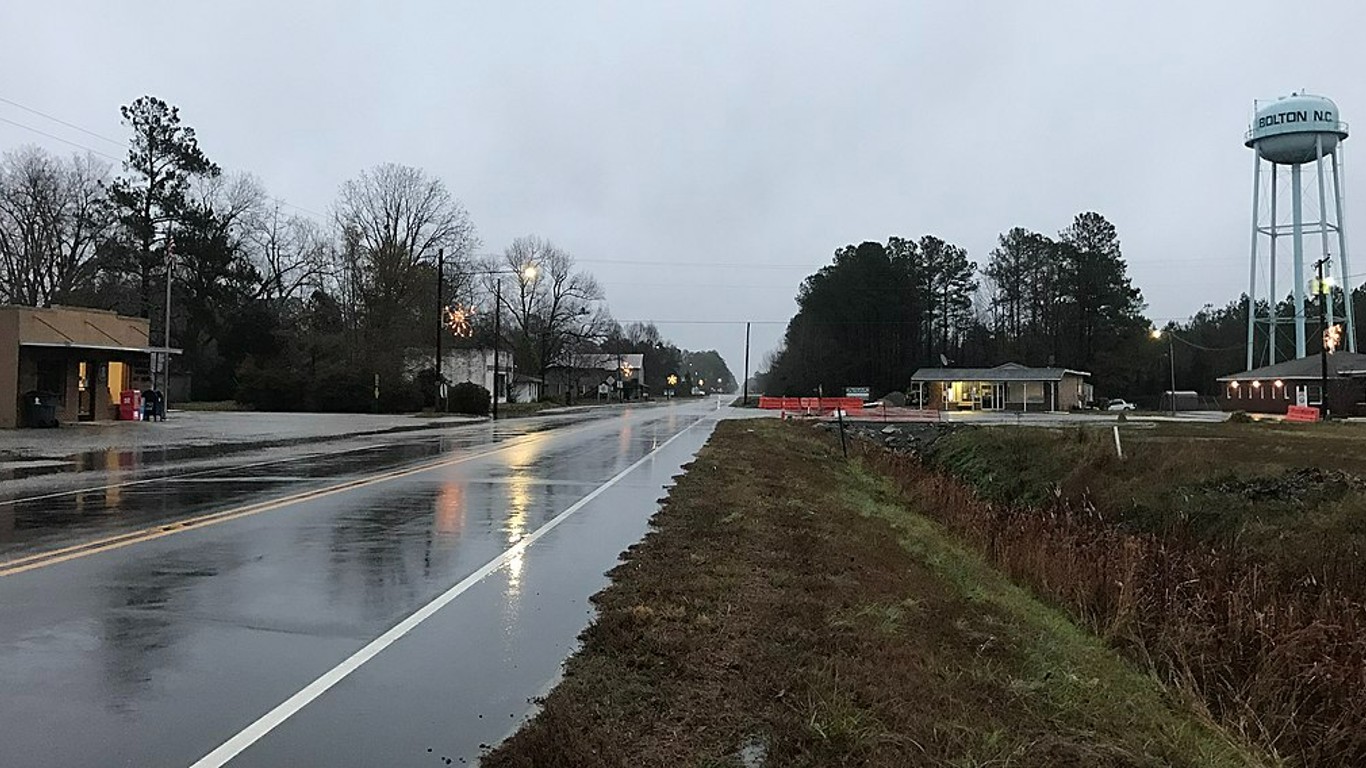
22. Columbus County, NC
> Overall hurricane-vulnerability score: 54.37 out of 100
> Risk rank: #115 highest risk out of 318 counties
> Hurricane history rank: #2 highest risk out of 318 counties
> Financial impact rank: #134 highest impact out of 318 counties
> Population (2022): 55,634
[in-text-ad-2]
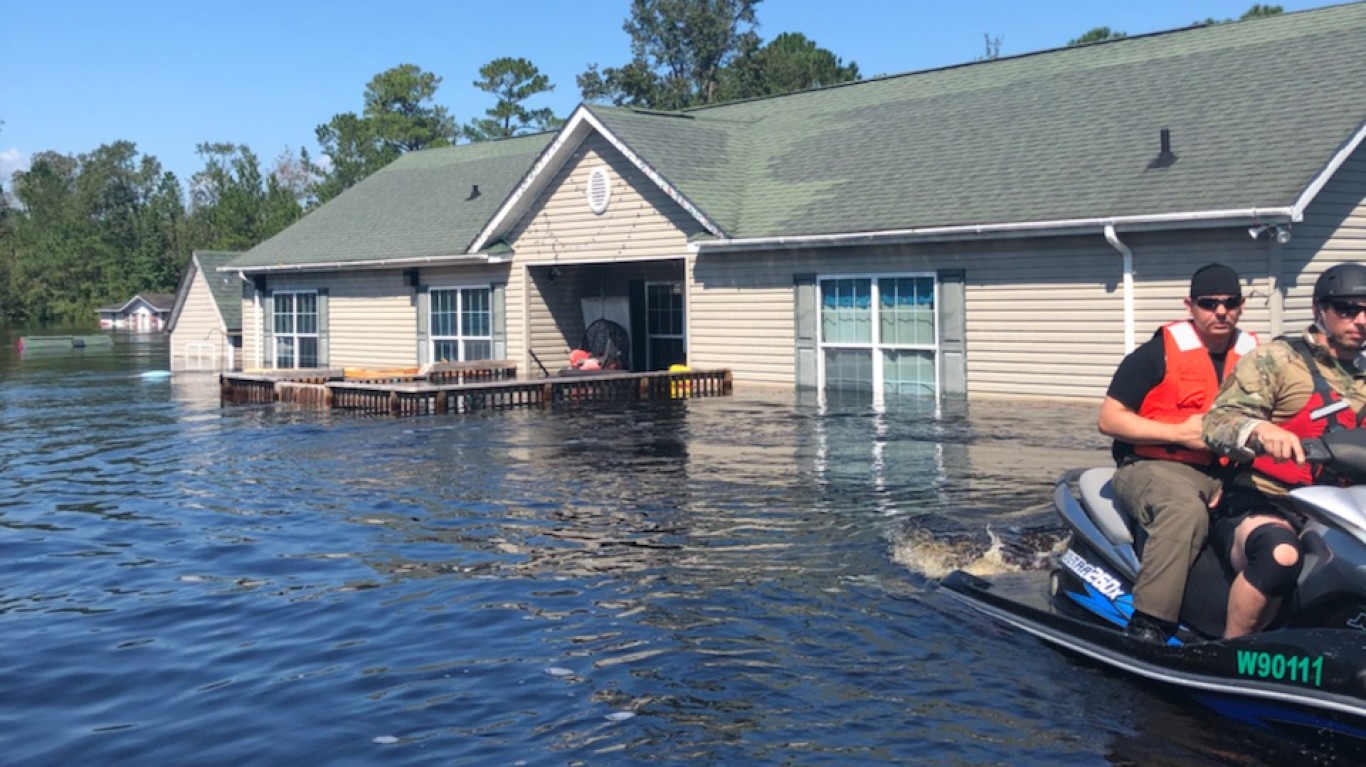
21. Pender County, NC
> Overall hurricane-vulnerability score: 54.4 out of 100
> Risk rank: #76 highest risk out of 318 counties
> Hurricane history rank: #17 highest risk out of 318 counties
> Financial impact rank: #79 highest impact out of 318 counties
> Population (2022): 64,902
20. Volusia County, FL
> Overall hurricane-vulnerability score: 54.55 out of 100
> Risk rank: #41 highest risk out of 318 counties
> Hurricane history rank: #30 highest risk out of 318 counties
> Financial impact rank: #41 highest impact out of 318 counties
> Population (2022): 571,209
[in-text-ad]
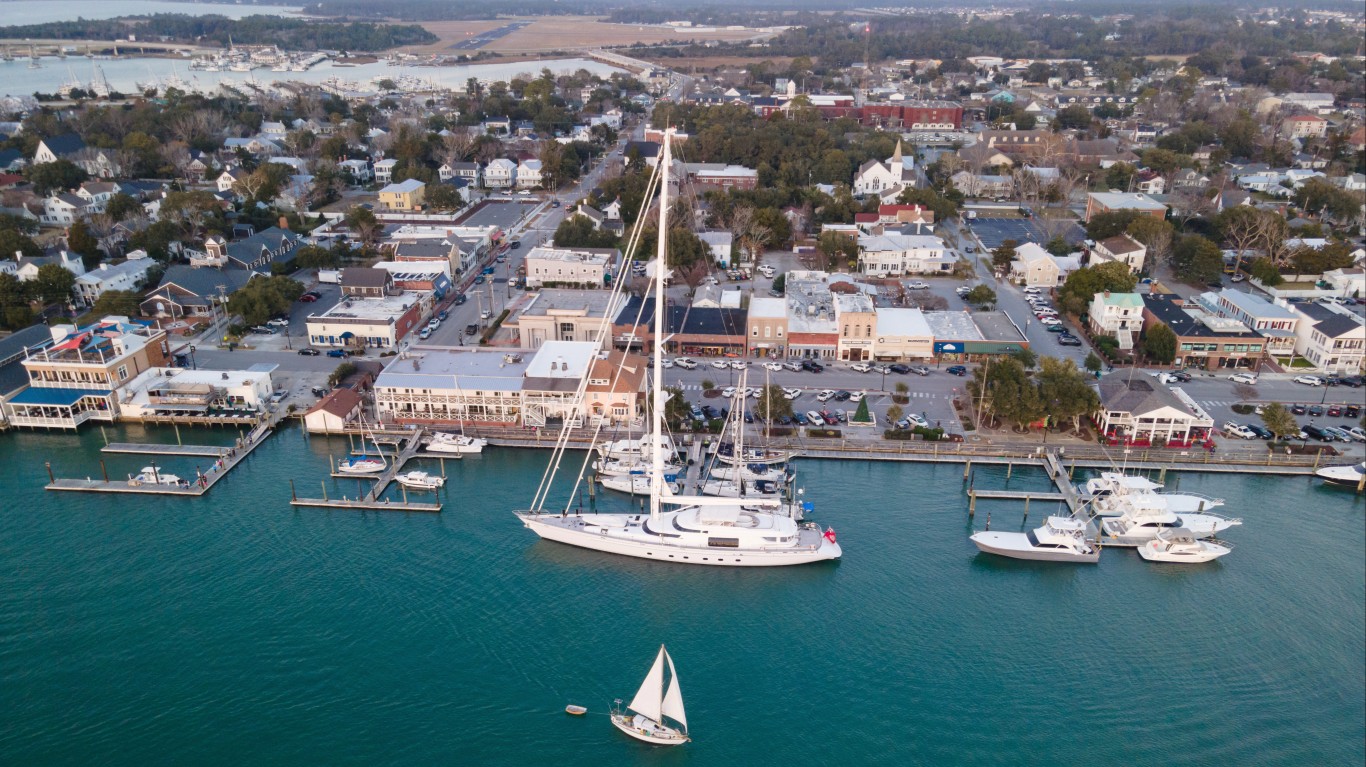
19. Carteret County, NC
> Overall hurricane-vulnerability score: 54.74 out of 100
> Risk rank: #33 highest risk out of 318 counties
> Hurricane history rank: #43 highest risk out of 318 counties
> Financial impact rank: #26 highest impact out of 318 counties
> Population (2022): 73,290
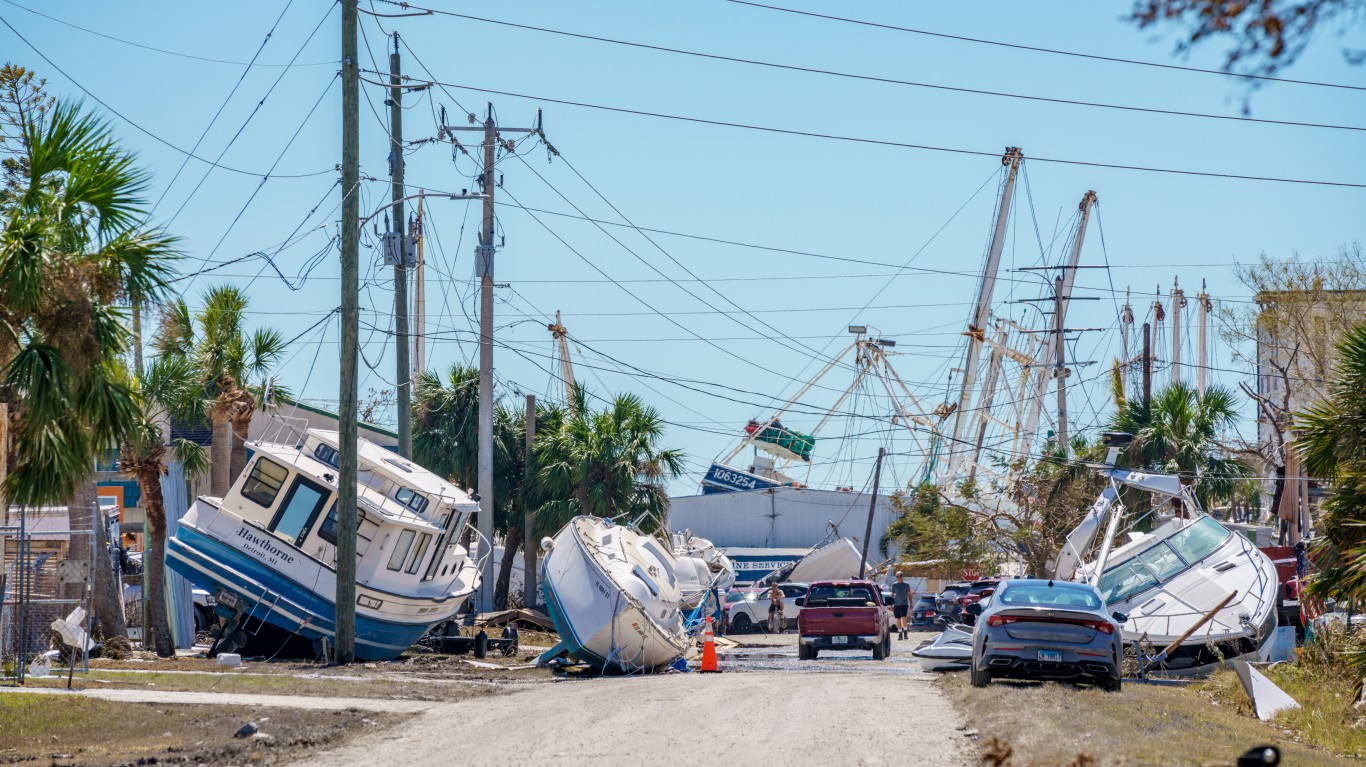
18. Collier County, FL
> Overall hurricane-vulnerability score: 54.98 out of 100
> Risk rank: #12 highest risk out of 318 counties
> Hurricane history rank: #84 highest risk out of 318 counties
> Financial impact rank: #10 highest impact out of 318 counties
> Population (2022): 407,383
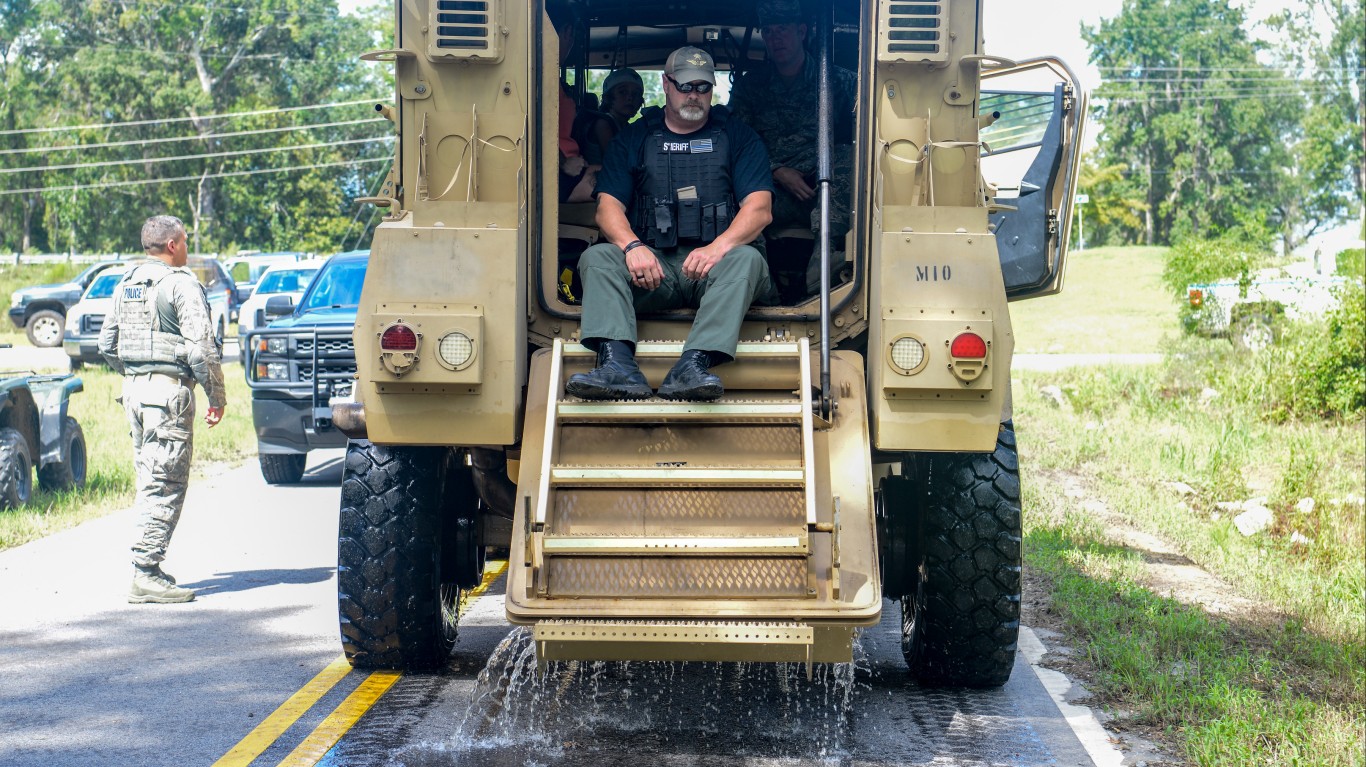
17. Florence County, SC
> Overall hurricane-vulnerability score: 55.8 out of 100
> Risk rank: #99 highest risk out of 318 counties
> Hurricane history rank: #2 highest risk out of 318 counties
> Financial impact rank: #103 highest impact out of 318 counties
> Population (2022): 136,114
[in-text-ad-2]
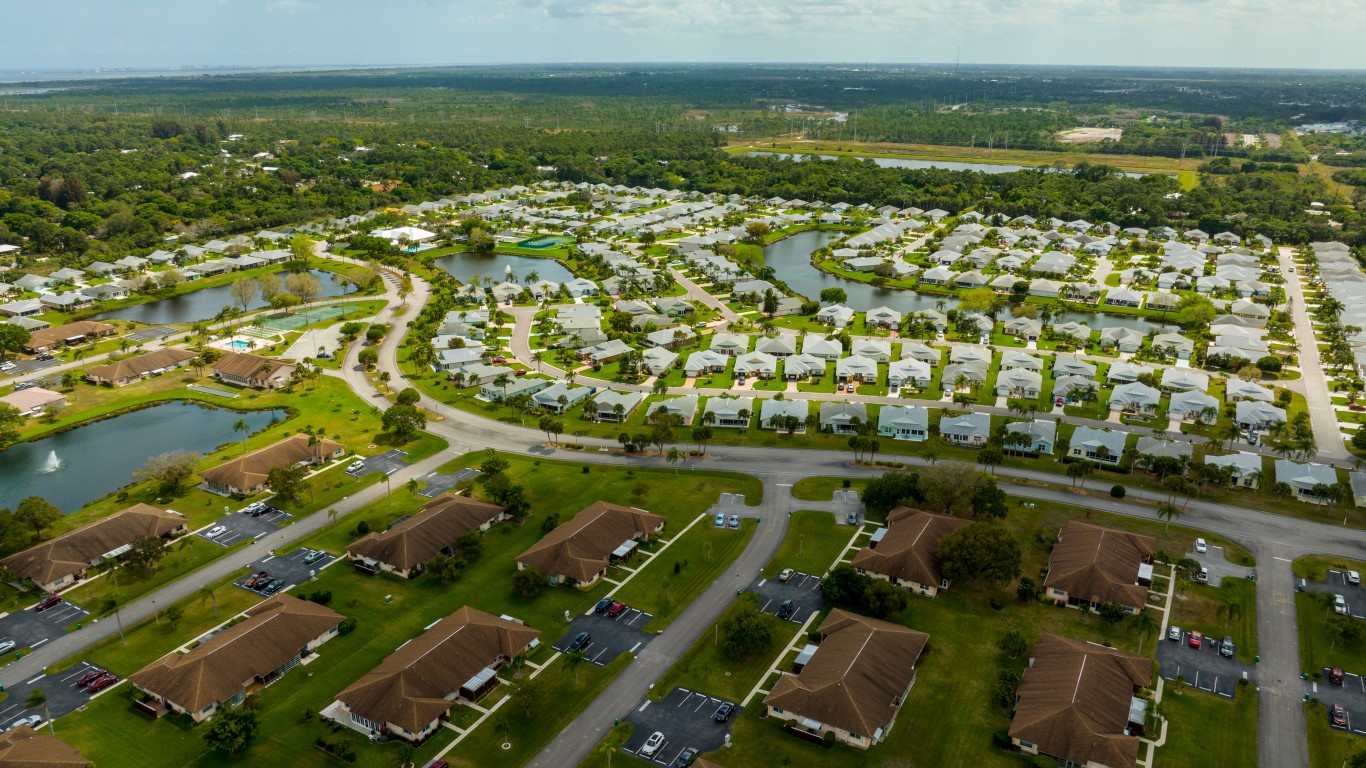
16. St. Lucie County, FL
> Overall hurricane-vulnerability score: 55.83 out of 100
> Risk rank: #20 highest risk out of 318 counties
> Hurricane history rank: #56 highest risk out of 318 counties
> Financial impact rank: #21 highest impact out of 318 counties
> Population (2022): 335,419
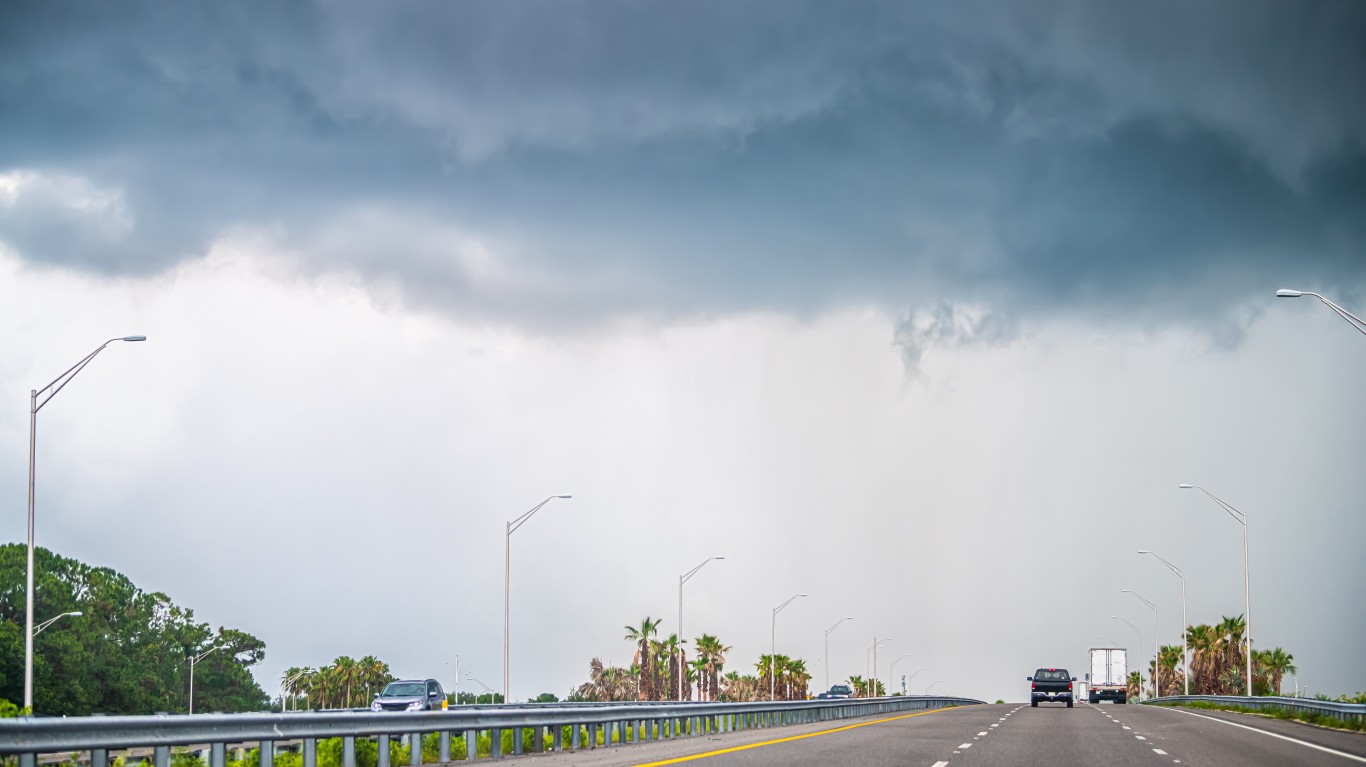
15. Orange County, FL
> Overall hurricane-vulnerability score: 57.02 out of 100
> Risk rank: #22 highest risk out of 318 counties
> Hurricane history rank: #30 highest risk out of 318 counties
> Financial impact rank: #24 highest impact out of 318 counties
> Population (2022): 1,452,137
[in-text-ad]
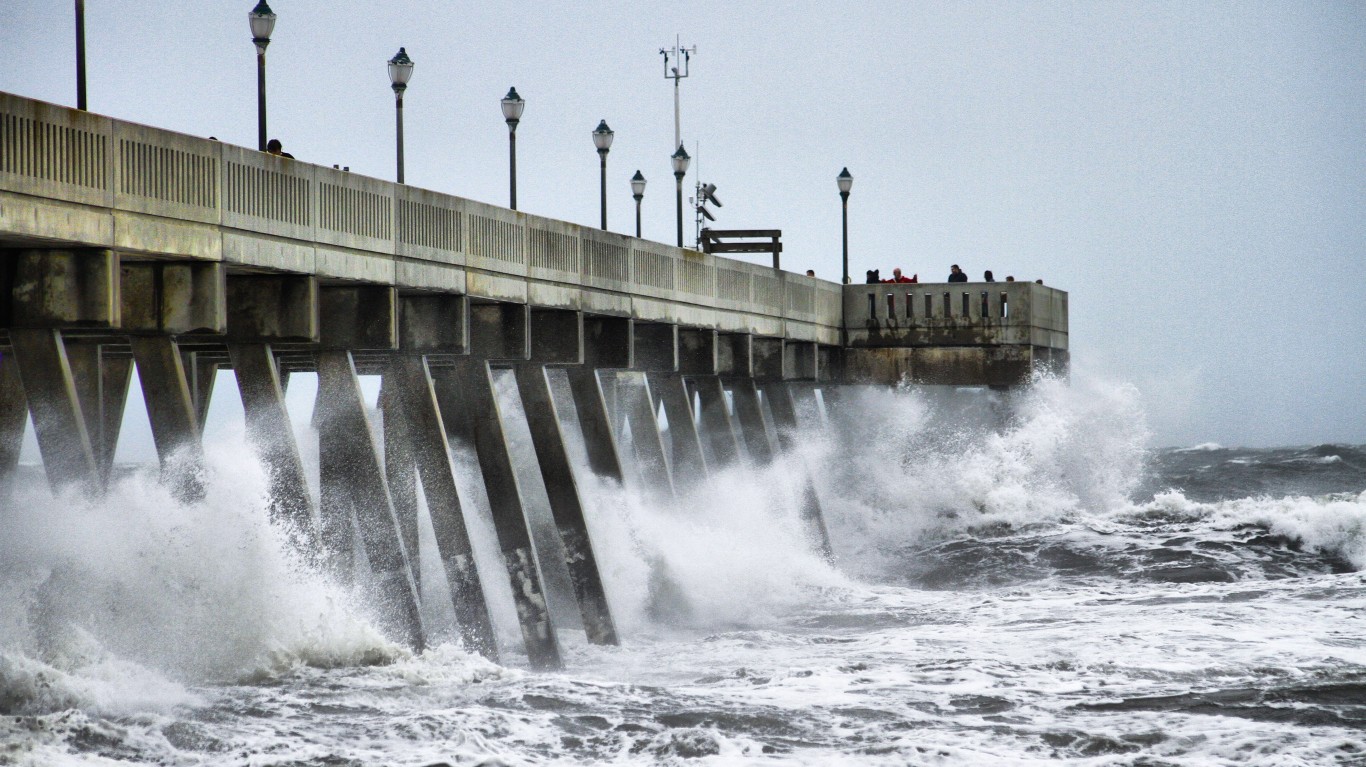
14. New Hanover County, NC
> Overall hurricane-vulnerability score: 57.73 out of 100
> Risk rank: #15 highest risk out of 318 counties
> Hurricane history rank: #43 highest risk out of 318 counties
> Financial impact rank: #13 highest impact out of 318 counties
> Population (2022): 243,085
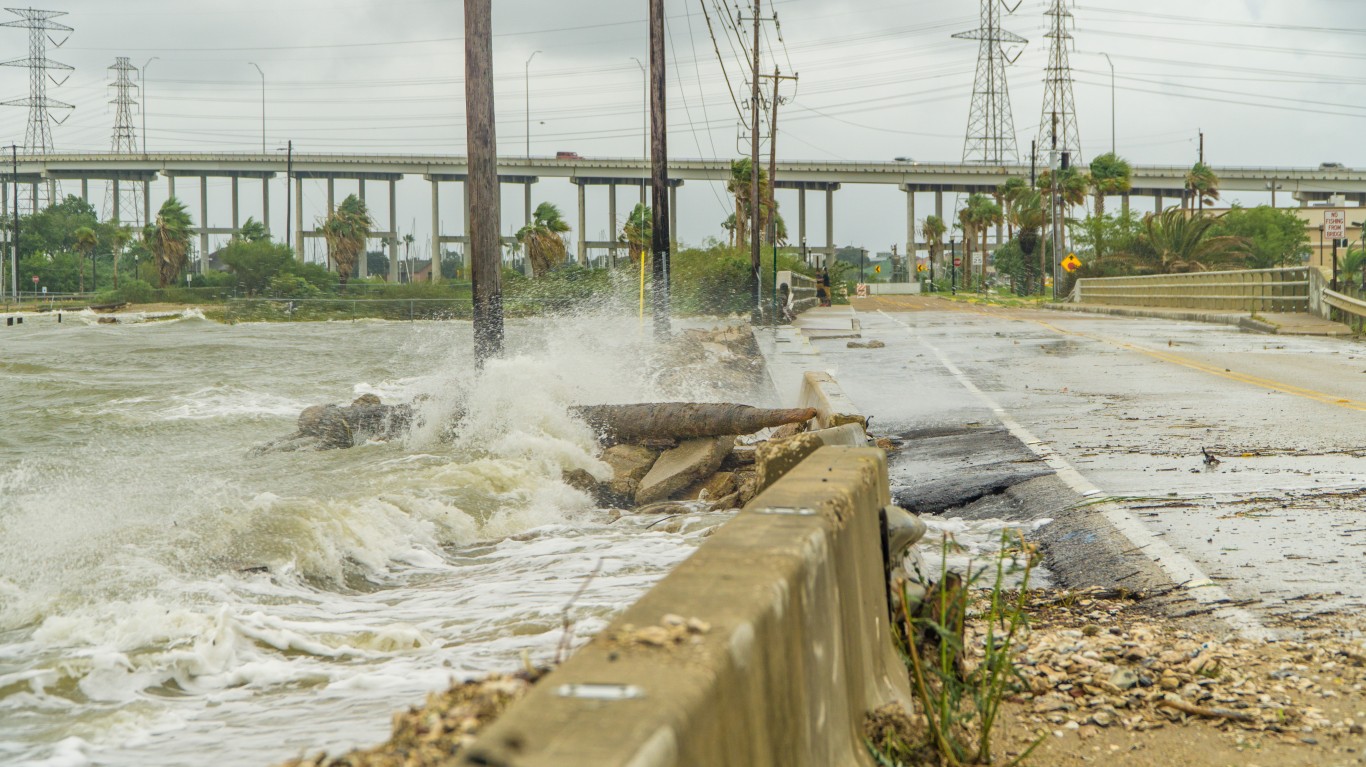
13. Harris County, TX
> Overall hurricane-vulnerability score: 57.89 out of 100
> Risk rank: #1 highest risk out of 318 counties
> Hurricane history rank: #280 highest risk out of 318 counties
> Financial impact rank: #1 highest impact out of 318 counties
> Population (2022): 4,780,913
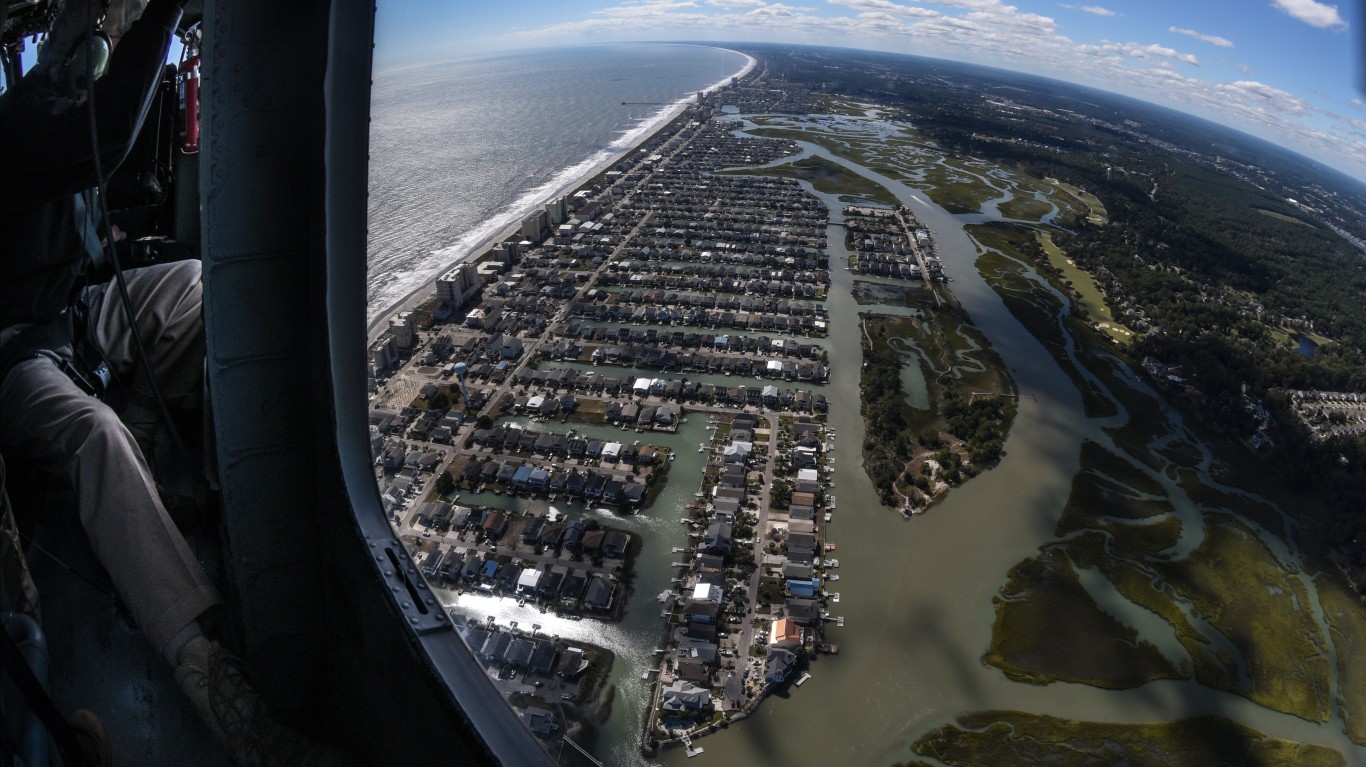
12. Georgetown County, SC
> Overall hurricane-vulnerability score: 59.61 out of 100
> Risk rank: #60 highest risk out of 318 counties
> Hurricane history rank: #2 highest risk out of 318 counties
> Financial impact rank: #56 highest impact out of 318 counties
> Population (2022): 64,183
[in-text-ad-2]

11. Brevard County, FL
> Overall hurricane-vulnerability score: 59.98 out of 100
> Risk rank: #7 highest risk out of 318 counties
> Hurricane history rank: #55 highest risk out of 318 counties
> Financial impact rank: #7 highest impact out of 318 counties
> Population (2022): 618,147
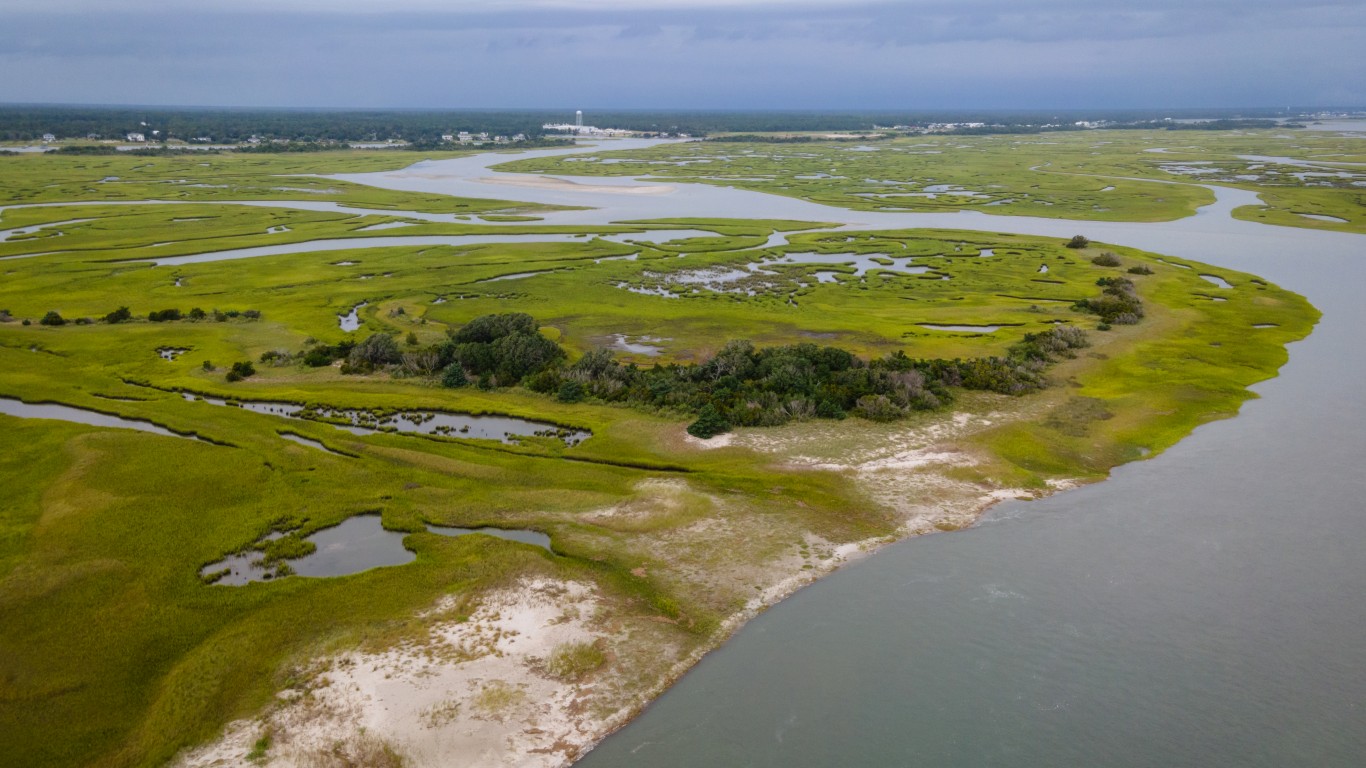
10. Onslow County, NC
> Overall hurricane-vulnerability score: 60.75 out of 100
> Risk rank: #23 highest risk out of 318 counties
> Hurricane history rank: #17 highest risk out of 318 counties
> Financial impact rank: #20 highest impact out of 318 counties
> Population (2022): 212,539
[in-text-ad]
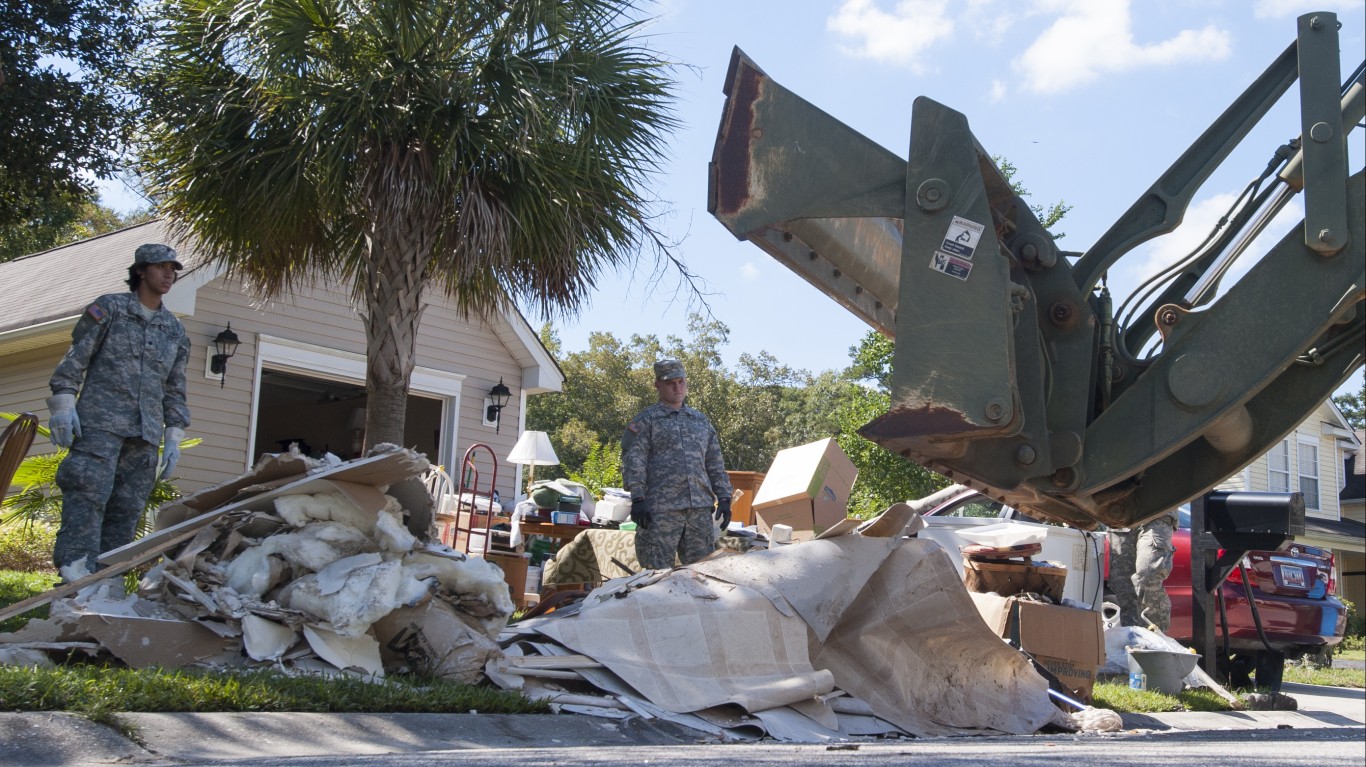
9. Dorchester County, SC
> Overall hurricane-vulnerability score: 60.97 out of 100
> Risk rank: #46 highest risk out of 318 counties
> Hurricane history rank: #2 highest risk out of 318 counties
> Financial impact rank: #47 highest impact out of 318 counties
> Population (2022): 168,424
8. Chatham County, GA
> Overall hurricane-vulnerability score: 62.5 out of 100
> Risk rank: #13 highest risk out of 318 counties
> Hurricane history rank: #17 highest risk out of 318 counties
> Financial impact rank: #12 highest impact out of 318 counties
> Population (2022): 295,703
7. Berkeley County, SC
> Overall hurricane-vulnerability score: 62.76 out of 100
> Risk rank: #32 highest risk out of 318 counties
> Hurricane history rank: #2 highest risk out of 318 counties
> Financial impact rank: #31 highest impact out of 318 counties
> Population (2022): 235,297
[in-text-ad-2]
6. Beaufort County, SC
> Overall hurricane-vulnerability score: 64.93 out of 100
> Risk rank: #21 highest risk out of 318 counties
> Hurricane history rank: #2 highest risk out of 318 counties
> Financial impact rank: #18 highest impact out of 318 counties
> Population (2022): 196,952
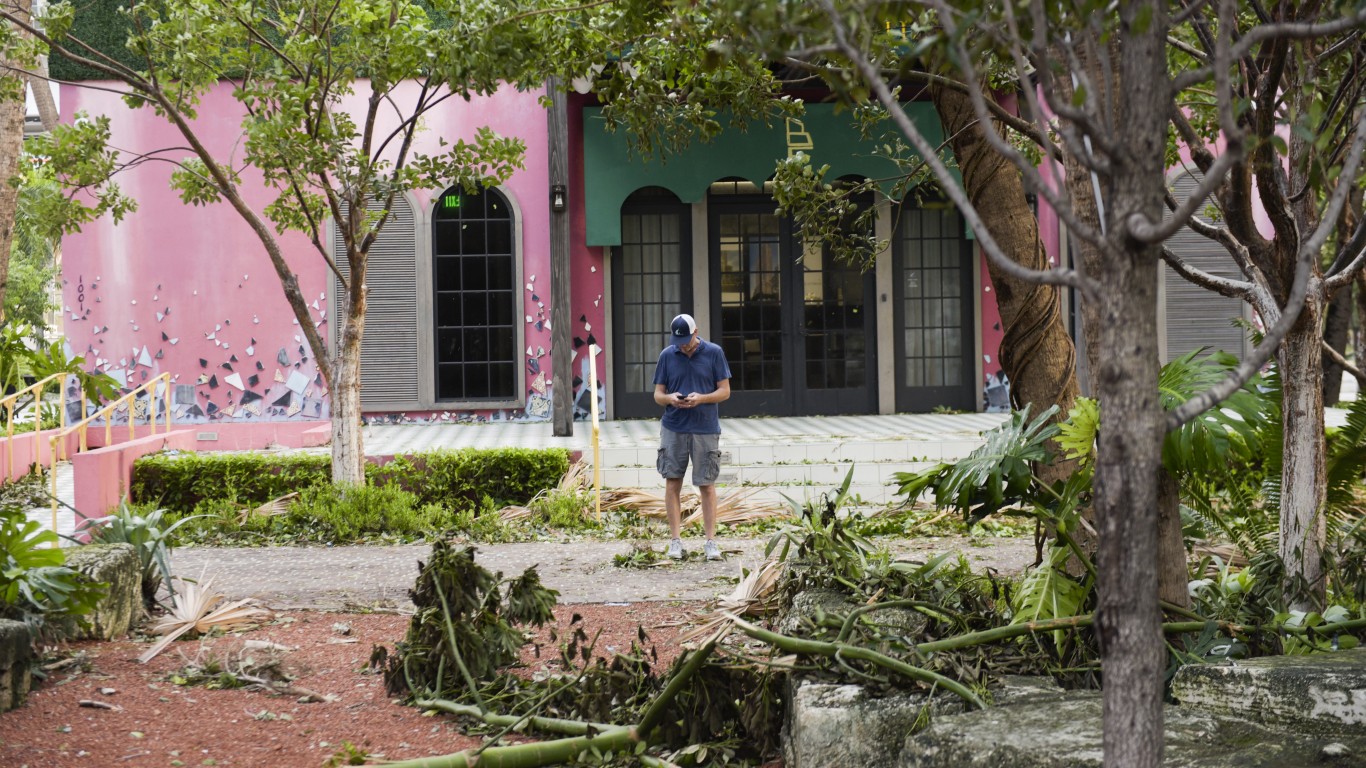
5. Miami-Dade County, FL
> Overall hurricane-vulnerability score: 65.1 out of 100
> Risk rank: #2 highest risk out of 318 counties
> Hurricane history rank: #84 highest risk out of 318 counties
> Financial impact rank: #4 highest impact out of 318 counties
> Population (2022): 2,758,931
[in-text-ad]
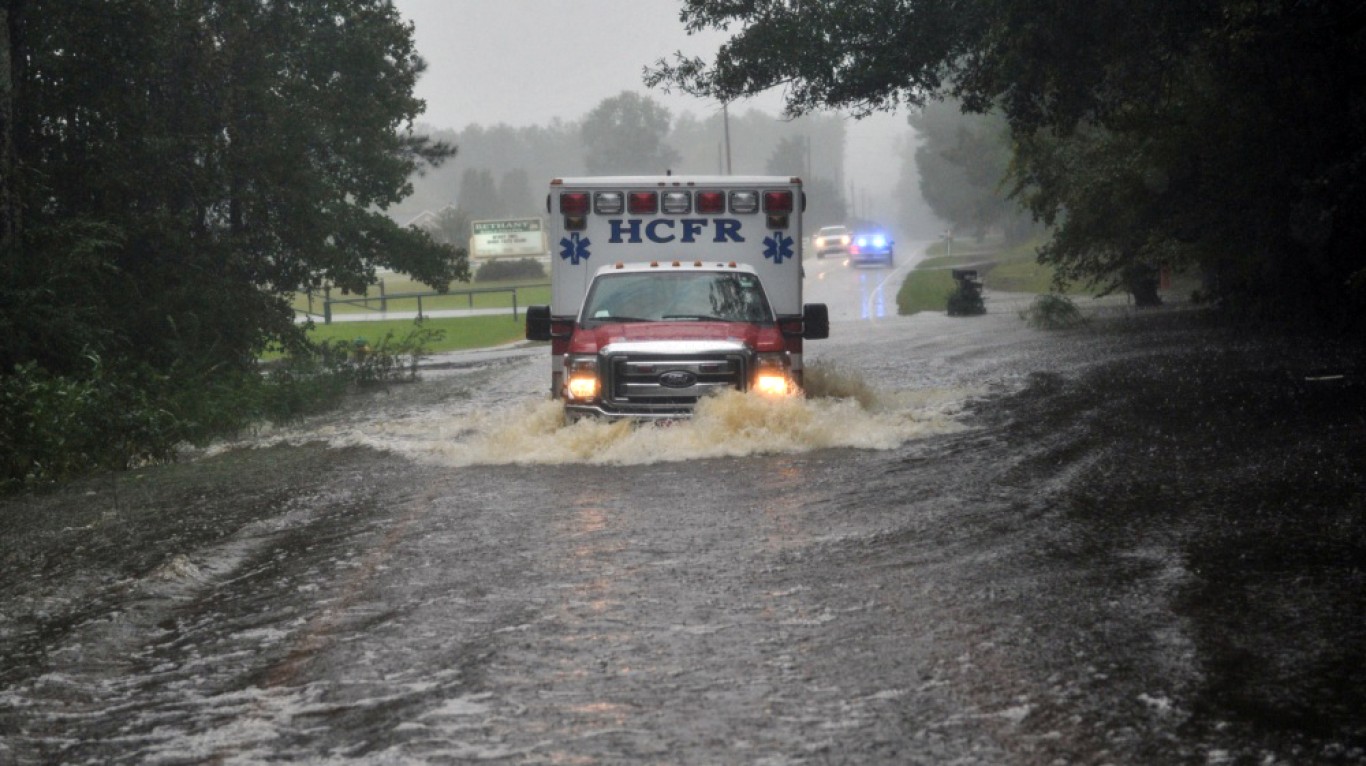
4. Horry County, SC
> Overall hurricane-vulnerability score: 66.31 out of 100
> Risk rank: #11 highest risk out of 318 counties
> Hurricane history rank: #2 highest risk out of 318 counties
> Financial impact rank: #11 highest impact out of 318 counties
> Population (2022): 363,008

3. Charleston County, SC
> Overall hurricane-vulnerability score: 68.17 out of 100
> Risk rank: #9 highest risk out of 318 counties
> Hurricane history rank: #2 highest risk out of 318 counties
> Financial impact rank: #8 highest impact out of 318 counties
> Population (2022): 417,129

2. Palm Beach County, FL
> Overall hurricane-vulnerability score: 72.09 out of 100
> Risk rank: #4 highest risk out of 318 counties
> Hurricane history rank: #26 highest risk out of 318 counties
> Financial impact rank: #3 highest impact out of 318 counties
> Population (2022): 1,525,570
[in-text-ad-2]
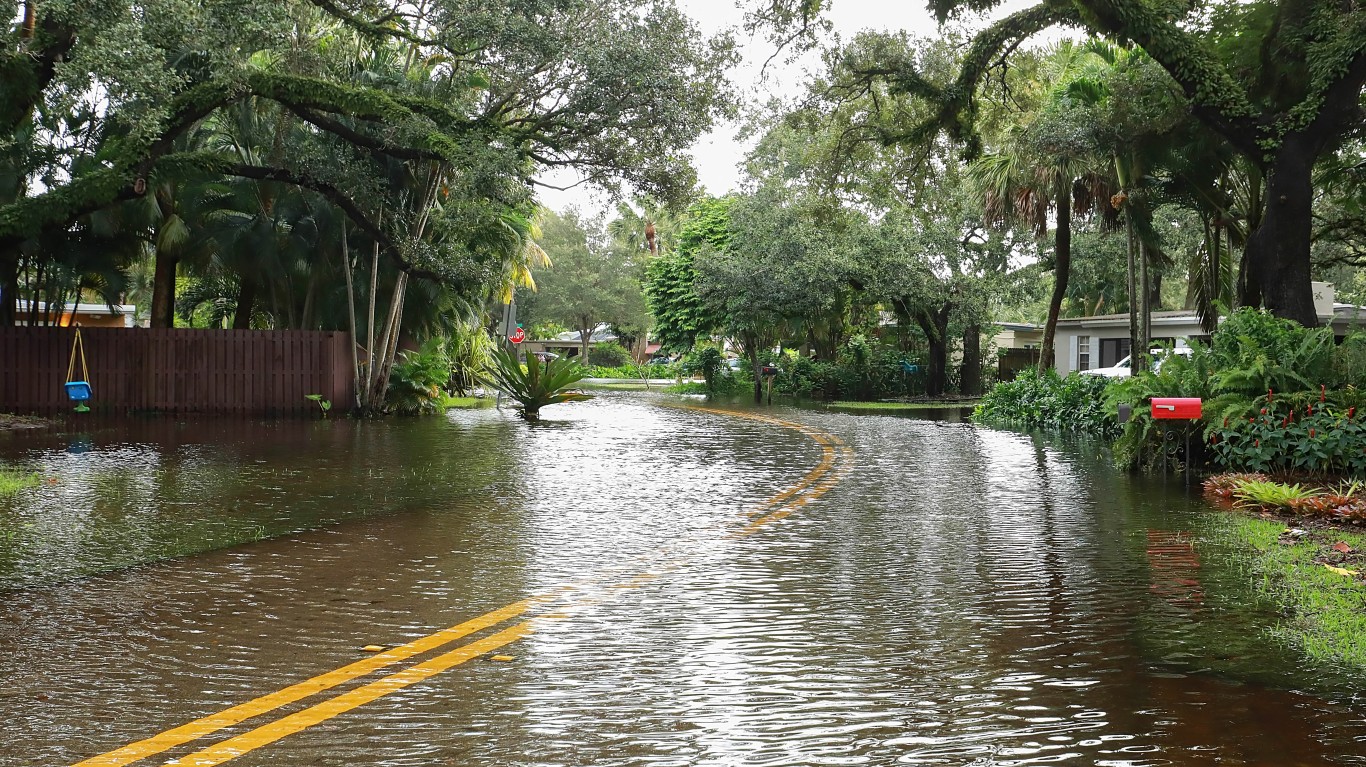
1. Broward County, FL
> Overall hurricane-vulnerability score: 72.7 out of 100
> Risk rank: #3 highest risk out of 318 counties
> Hurricane history rank: #26 highest risk out of 318 counties
> Financial impact rank: #2 highest impact out of 318 counties
> Population (2022): 1,984,988
Get Ready To Retire (Sponsored)
Start by taking a quick retirement quiz from SmartAsset that will match you with up to 3 financial advisors that serve your area and beyond in 5 minutes, or less.
Each advisor has been vetted by SmartAsset and is held to a fiduciary standard to act in your best interests.
Here’s how it works:
1. Answer SmartAsset advisor match quiz
2. Review your pre-screened matches at your leisure. Check out the advisors’ profiles.
3. Speak with advisors at no cost to you. Have an introductory call on the phone or introduction in person and choose whom to work with in the future
Get started right here.
Thank you for reading! Have some feedback for us?
Contact the 24/7 Wall St. editorial team.

 24/7 Wall St.


 24/7 Wall St.

