Special Report
American Cities With the Most Million-Dollar Homes
Published:
Last Updated:

San Francisco’s Bay Area was an affordable hippie and music enclave in the 1960s that later became a magnet for the gay community in the 1980s. The rise of the U.S. tech industry in the ’90s radically transformed the region, pricing out many people who were not attached to lucrative startups and established tech companies as housing prices in the area began to soar.
Today, the San Francisco metropolitan area and the neighboring San Jose, California, metro area are some of the least affordable places to live as the share of owner-occupied homes valued at $1 million or more is the highest nationwide, at 53% in and around San Francisco and 66% for the homes in the San Jose area. (Here are America’s 25 least affordable housing markets.)
To put that into perspective, the share of million-dollar-plus homes in Los Angeles, the global center of the movie business, is less than half that, at 26%. In New York City, one of the world’s financial centers, only 12% of homes are worth as much.
To identify the 50 cities with the most million-dollar homes, 24/7 Wall St. referenced online lending marketplace LendingTree’s report: “Share of Million-Dollar Homes Rising — Here Are the Metros Where They’re Most Prevalent.” The report uses the latest available census data to find the share of owner-occupied homes that have values of $1 million or more in the 50 largest U.S. metropolitan areas. Cities on this list are ordered by the share of owner-occupied homes that are valued at $1 million or more. All data is from LendingTree’s report.
Only seven metropolitan areas in the United States have more than 10% of owner-occupied homes that are worth a million dollars or more, a list that includes Boston, Seattle, and San Diego. (See if renting is more affordable in these cities: American cities where renting is least affordable.)
The median share of million-dollar-plus homes in these 50 cities is 2.63%, about the same as the shares found in Atlanta and Chicago. In four cities, the share of owner-occupied homes worth at least $1 million is less than 1%: Buffalo, New York; Cleveland; Pittsburgh; and Louisville, Kentucky.
Median home values in these 50 cities range from $184,500 in the Cleveland area to $1.23 million in and around San Jose. San Francisco is the only other city with a median home value topping $1 million.
Among the 13 largest metro area housing markets — ones with between 1 million and 4 million owner-occupied homes — Los Angeles, New York, and Boston are the only markets with shares of homes worth at least a million dollars that top 10%. Detroit, meanwhile, has the smallest shares of these homes at 1.2%.
The national median home sales price was $416,100 in the second quarter of 2023, down from an all-time high of $479,500 in the last three months of 2022, according to the Federal Reserve Bank of St. Louis.
Here are the cities with the largest share of homes worth at least a million dollars.
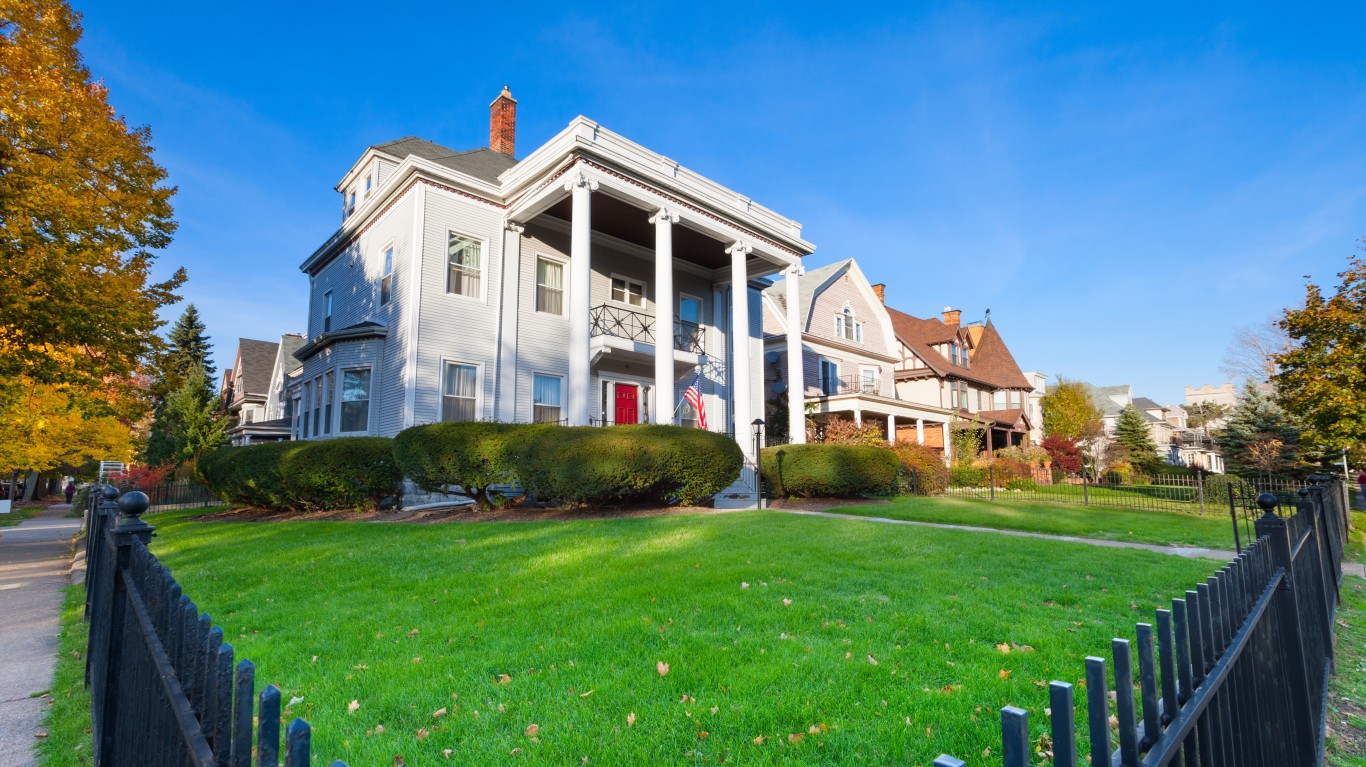
50. Buffalo, NY
> Pct. of homes worth $1 million or more: 0.75%
> Median home value: $192,000 — #47 highest out of 50 largest cities
> No. of $1 million+ homes: 2,545 — #50 most
> No. of owner-occupied homes: 341,086 — #45 most
[in-text-ad]

49. Cleveland, OH
> Pct. of homes worth $1 million or more: 0.83%
> Median home value: $184,500 — #50 highest out of 50 largest cities
> No. of $1 million+ homes: 4,819 — #45 most
> No. of owner-occupied homes: 584,025 — #28 most
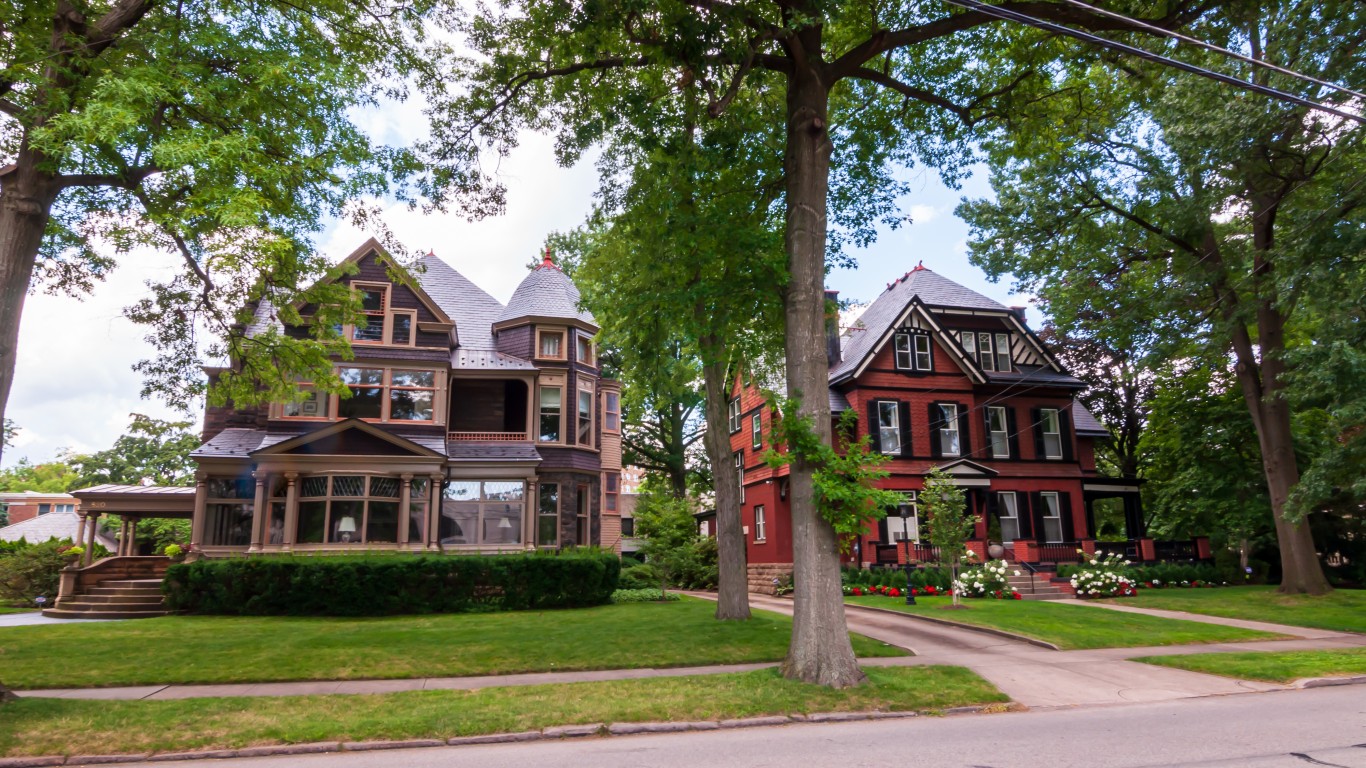
48. Pittsburgh, PA
> Pct. of homes worth $1 million or more: 0.90%
> Median home value: $190,000 — #49 highest out of 50 largest cities
> No. of $1 million+ homes: 6,581 — #41 most
> No. of owner-occupied homes: 732,879 — #21 most
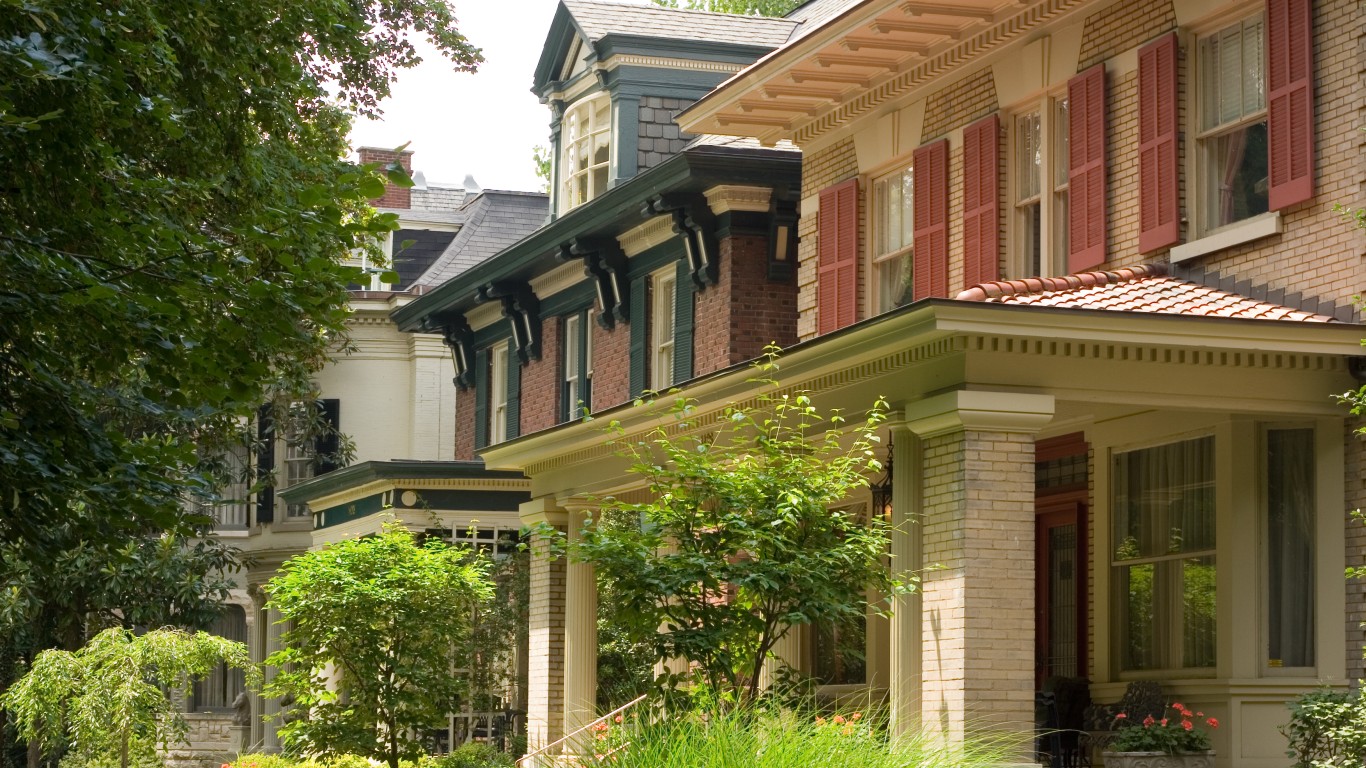
47. Louisville, KY
> Pct. of homes worth $1 million or more: 0.92%
> Median home value: $220,500 — #42 highest out of 50 largest cities
> No. of $1 million+ homes: 3,306 — #49 most
> No. of owner-occupied homes: 358,617 — #43 most
[in-text-ad-2]
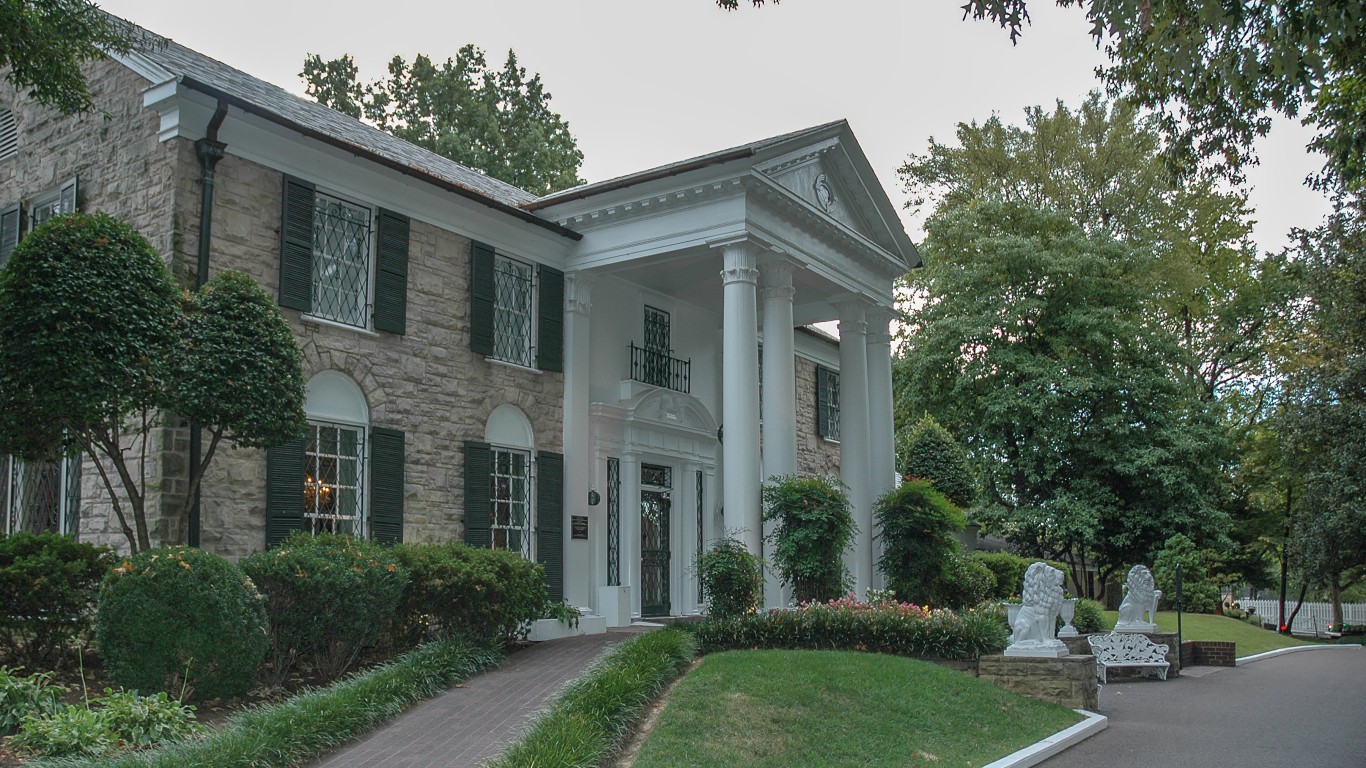
46. Memphis, TN
> Pct. of homes worth $1 million or more: 1.09%
> Median home value: $212,800 — #45 highest out of 50 largest cities
> No. of $1 million+ homes: 3,496 — #48 most
> No. of owner-occupied homes: 319,295 — #48 most
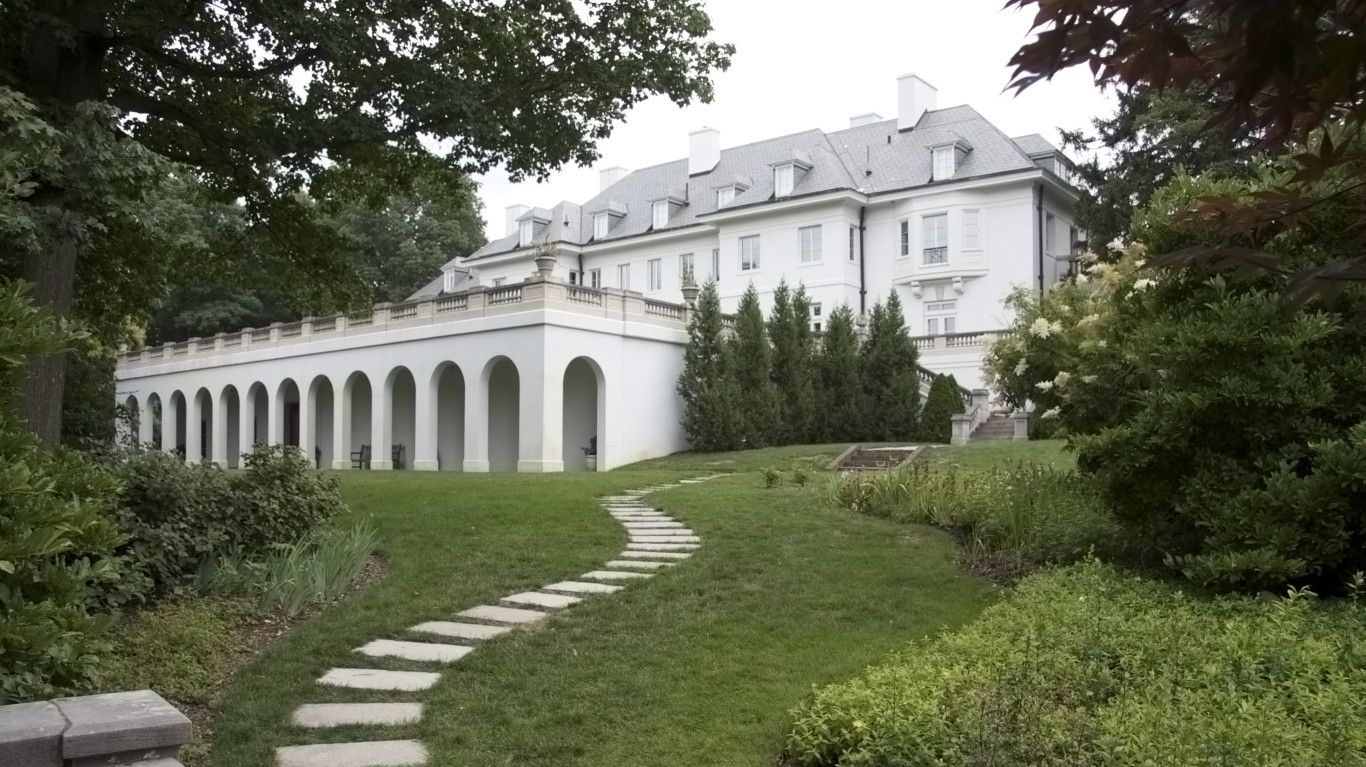
45. Indianapolis, IN
> Pct. of homes worth $1 million or more: 1.10%
> Median home value: $223,200 — #40 highest out of 50 largest cities
> No. of $1 million+ homes: 6,193 — #42 most
> No. of owner-occupied homes: 564,188 — #30 most
[in-text-ad]
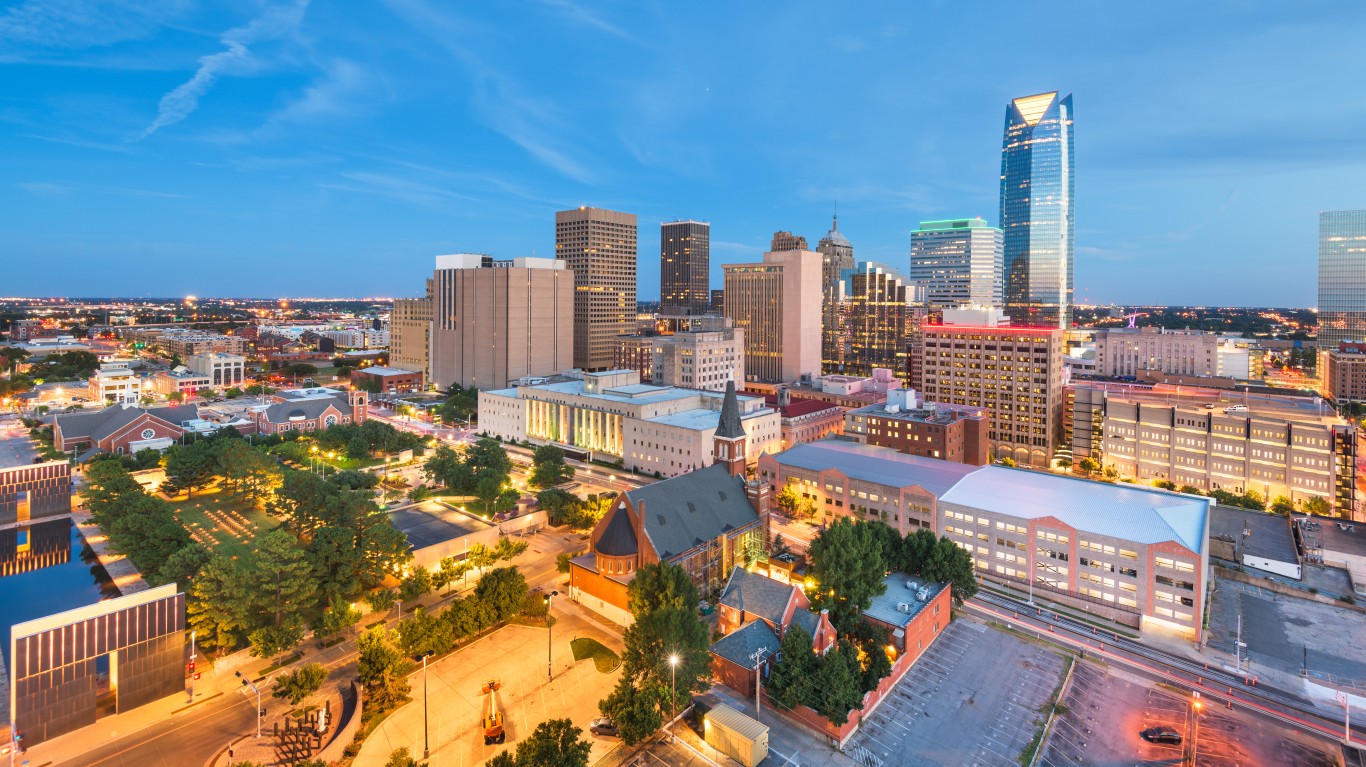
44. Oklahoma City, OK
> Pct. of homes worth $1 million or more: 1.17%
> Median home value: $190,800 — #48 highest out of 50 largest cities
> No. of $1 million+ homes: 4,216 — #46 most
> No. of owner-occupied homes: 361,134 — #42 most
43. Detroit, MI
> Pct. of homes worth $1 million or more: 1.22%
> Median home value: $220,900 — #41 highest out of 50 largest cities
> No. of $1 million+ homes: 15,284 — #28 most
> No. of owner-occupied homes: 1,256,798 — #10 most

42. Hartford, CT
> Pct. of homes worth $1 million or more: 1.23%
> Median home value: $278,500 — #33 highest out of 50 largest cities
> No. of $1 million+ homes: 4,070 — #47 most
> No. of owner-occupied homes: 331,352 — #46 most
[in-text-ad-2]
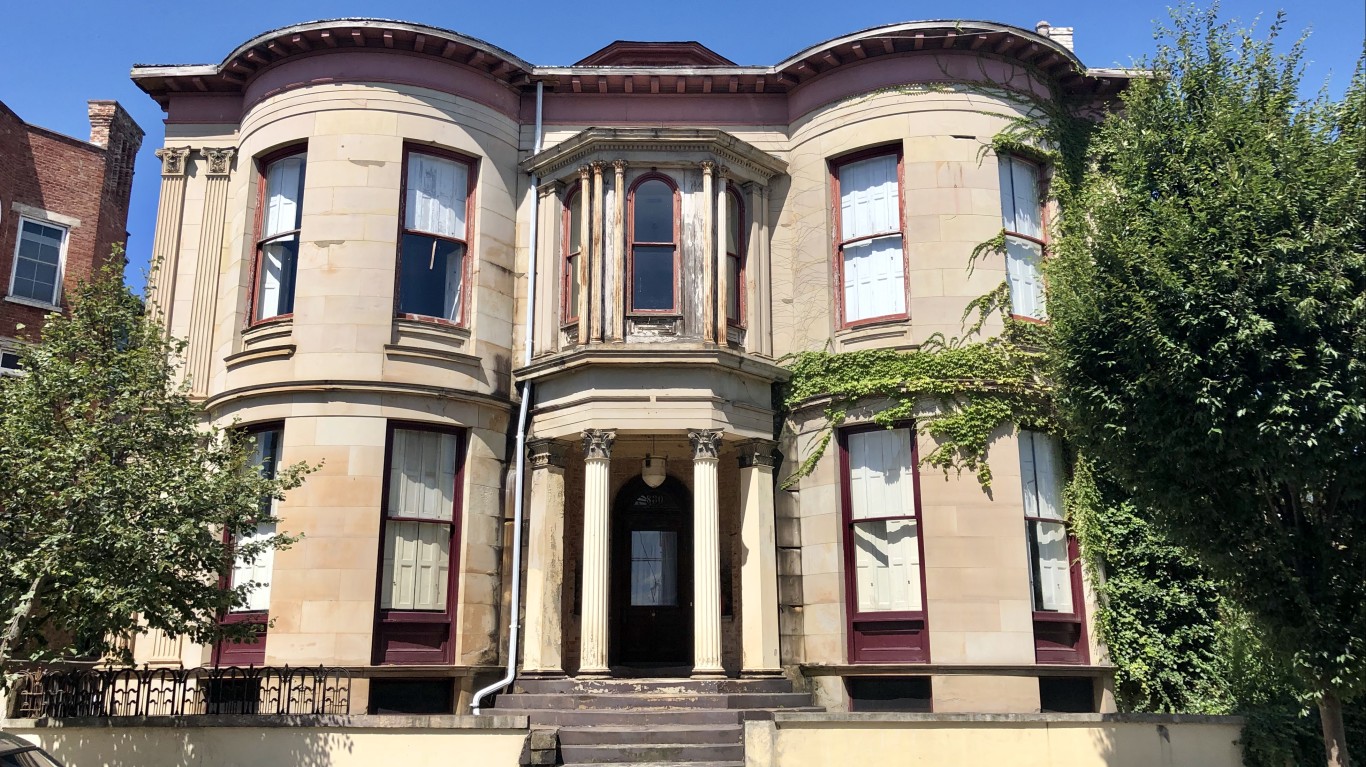
41. Cincinnati, OH
> Pct. of homes worth $1 million or more: 1.27%
> Median home value: $217,700 — #43 highest out of 50 largest cities
> No. of $1 million+ homes: 7,906 — #36 most
> No. of owner-occupied homes: 622,227 — #25 most

39 (tie). Columbus, OH
> Pct. of homes worth $1 million or more: 1.30%
> Median home value: $254,700 — #35 highest out of 50 largest cities
> No. of $1 million+ homes: 6,882 — #40 most
> No. of owner-occupied homes: 527,897 — #34 most
[in-text-ad]
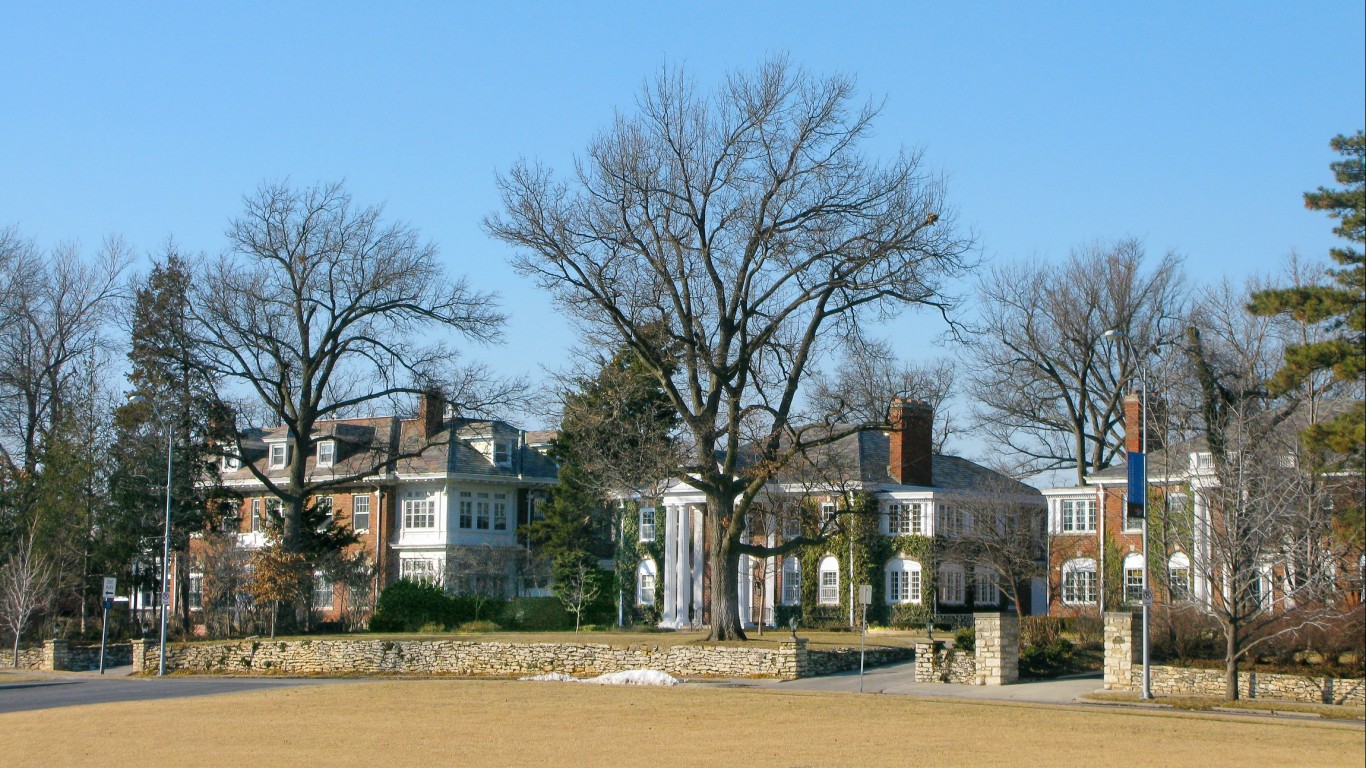
39 (tie). Kansas City, MO
> Pct. of homes worth $1 million or more: 1.30%
> Median home value: $247,000 — #37 highest out of 50 largest cities
> No. of $1 million+ homes: 7,555 — #37 most
> No. of owner-occupied homes: 583,245 — #29 most
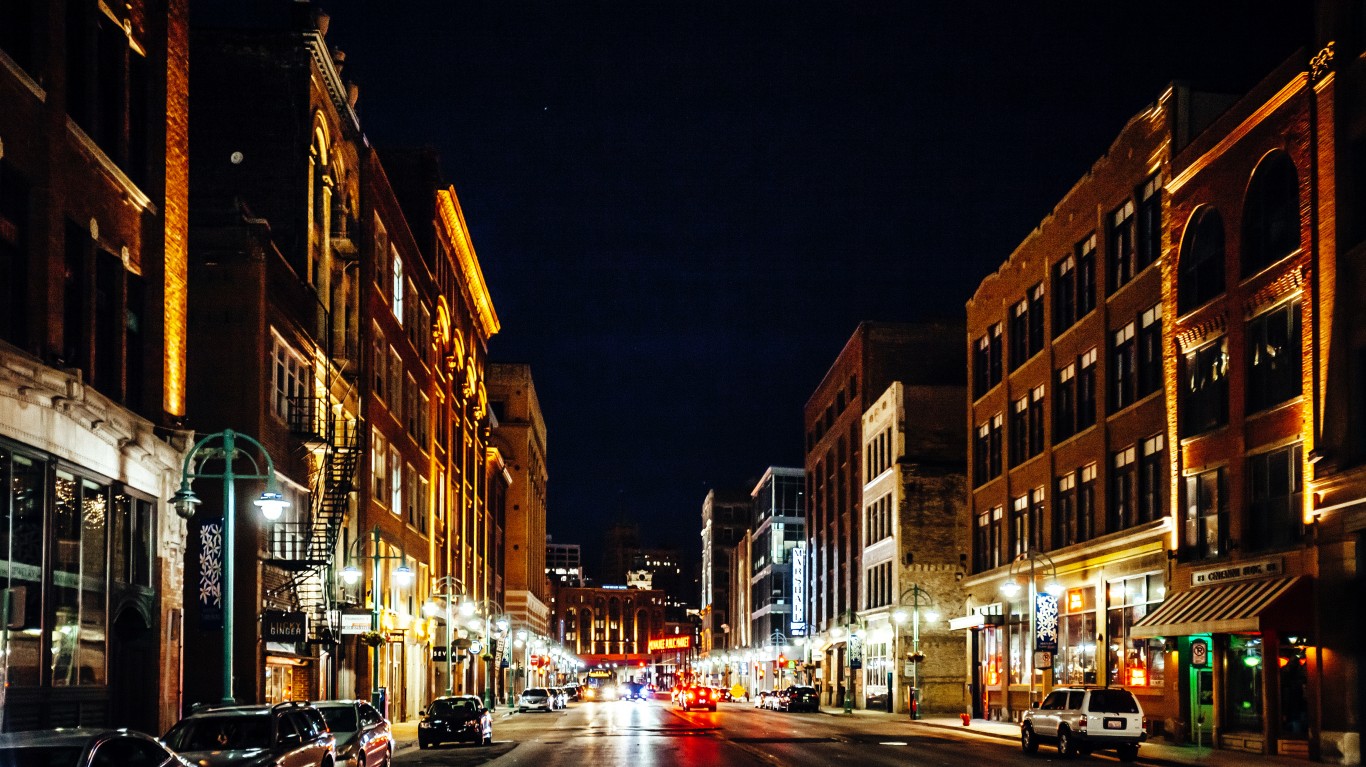
38. Milwaukee, WI
> Pct. of homes worth $1 million or more: 1.39%
> Median home value: $266,200 — #34 highest out of 50 largest cities
> No. of $1 million+ homes: 5,504 — #43 most
> No. of owner-occupied homes: 395,574 — #39 most
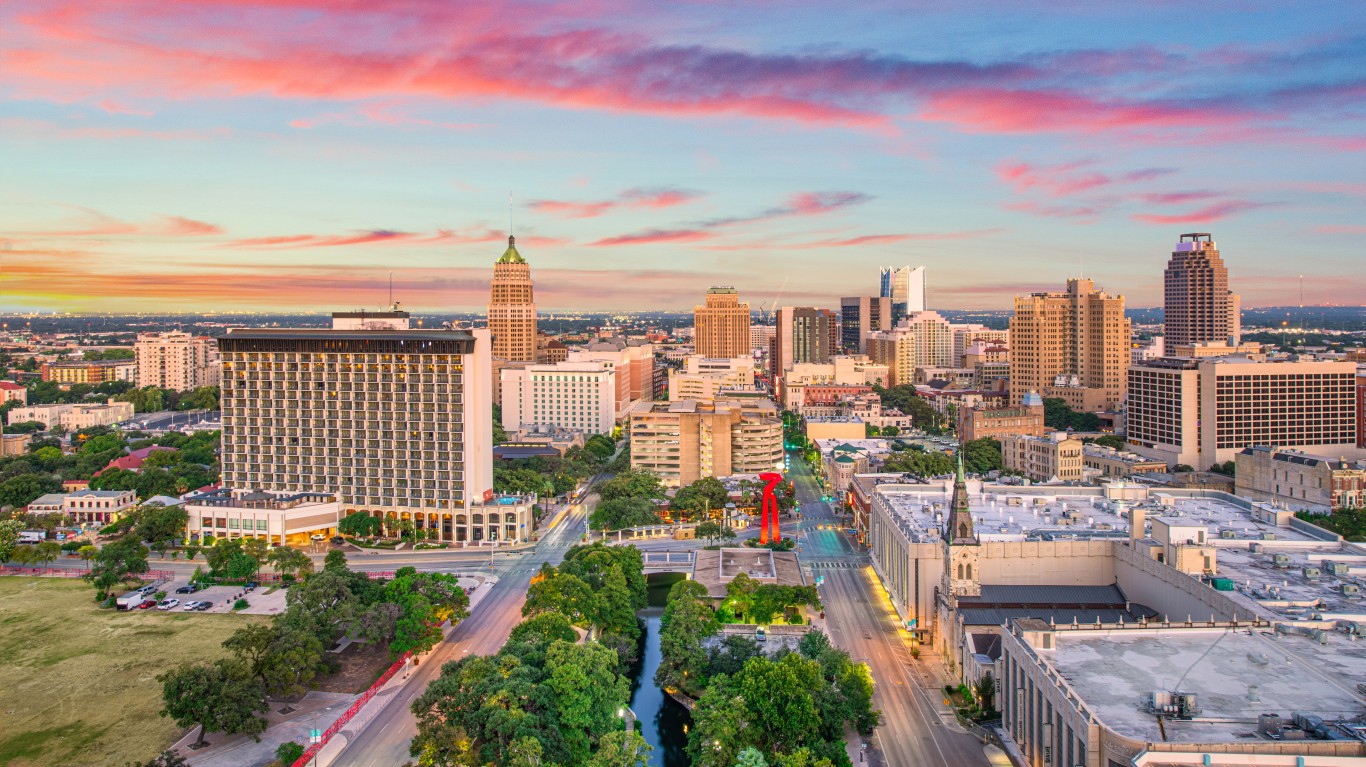
37. San Antonio, TX
> Pct. of homes worth $1 million or more: 1.66%
> Median home value: $233,500 — #39 highest out of 50 largest cities
> No. of $1 million+ homes: 9,995 — #33 most
> No. of owner-occupied homes: 602,176 — #27 most
[in-text-ad-2]
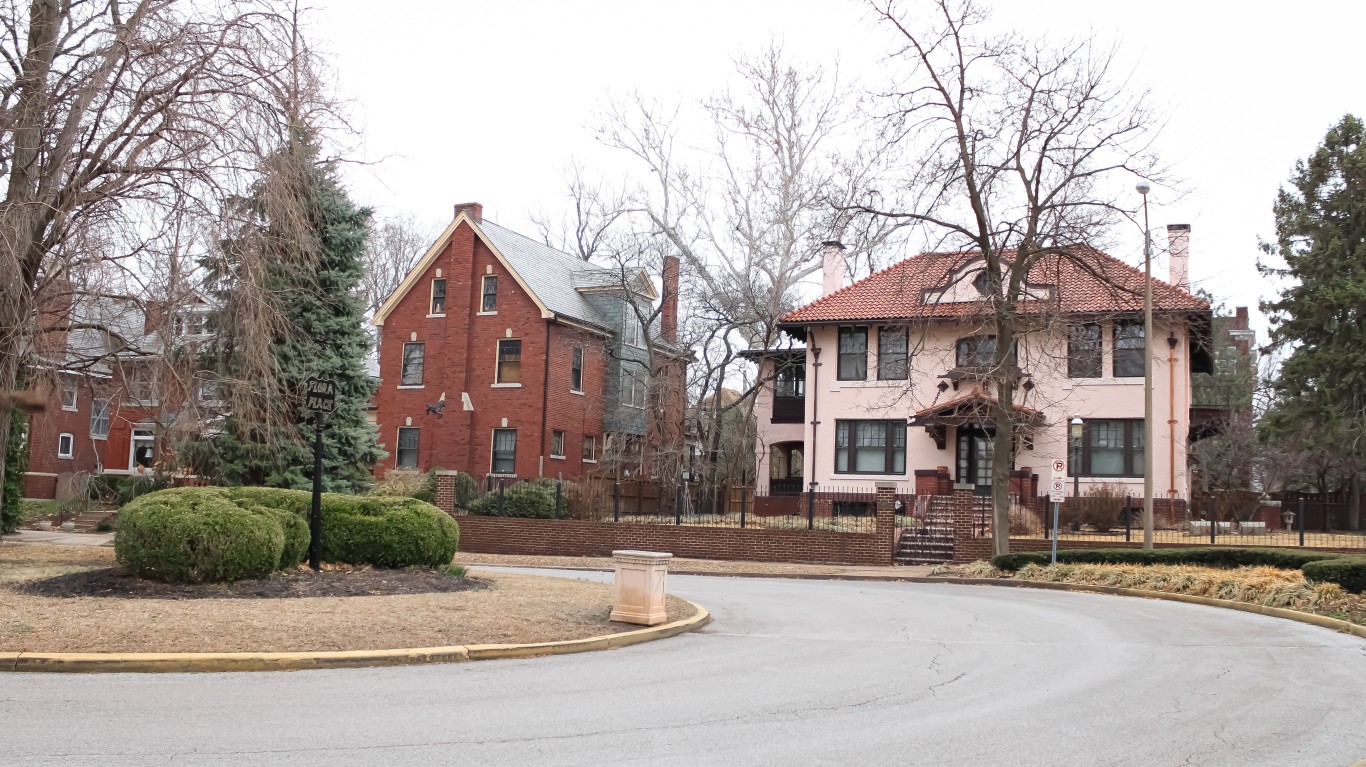
36. St. Louis, MO
> Pct. of homes worth $1 million or more: 1.73%
> Median home value: $215,700 — #44 highest out of 50 largest cities
> No. of $1 million+ homes: 14,124 — #30 most
> No. of owner-occupied homes: 814,805 — #18 most
35. Birmingham, AL
> Pct. of homes worth $1 million or more: 1.75%
> Median home value: $208,800 — #46 highest out of 50 largest cities
> No. of $1 million+ homes: 5,384 — #44 most
> No. of owner-occupied homes: 307,177 — #49 most
[in-text-ad]

34. Virginia Beach, VA
> Pct. of homes worth $1 million or more: 1.76%
> Median home value: $284,800 — #29 highest out of 50 largest cities
> No. of $1 million+ homes: 8,001 — #35 most
> No. of owner-occupied homes: 453,942 — #36 most
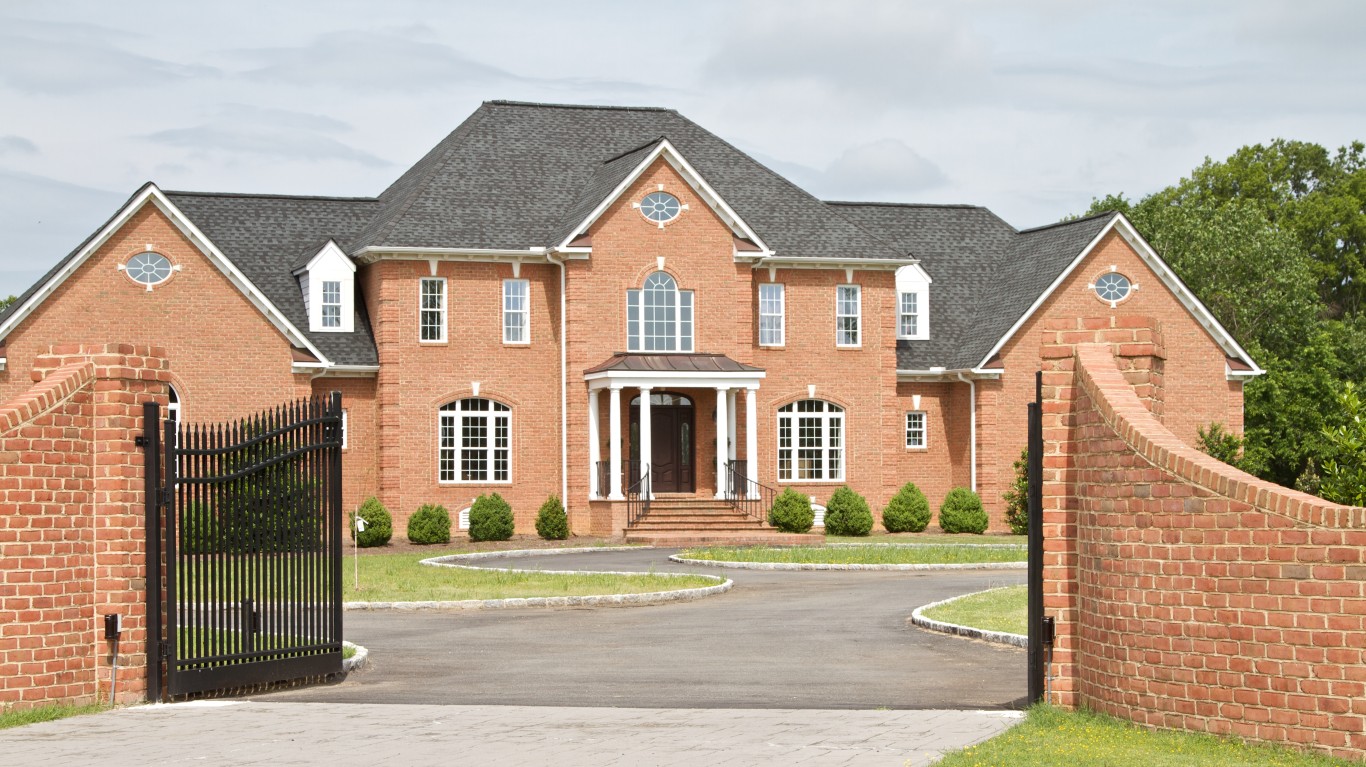
33. Richmond, VA
> Pct. of homes worth $1 million or more: 2.00%
> Median home value: $299,600 — #26 highest out of 50 largest cities
> No. of $1 million+ homes: 6,978 — #39 most
> No. of owner-occupied homes: 349,141 — #44 most
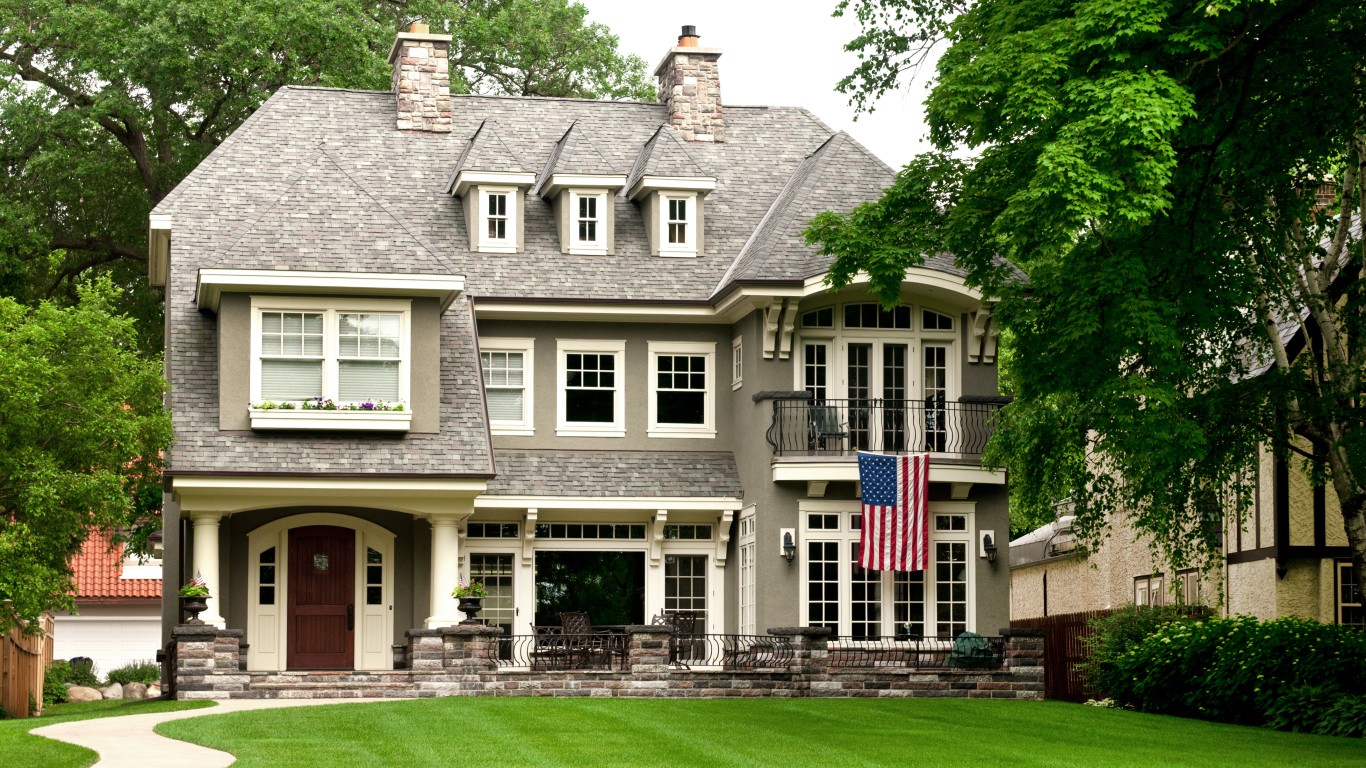
32. Minneapolis, MN
> Pct. of homes worth $1 million or more: 2.06%
> Median home value: $330,400 — #22 highest out of 50 largest cities
> No. of $1 million+ homes: 21,412 — #25 most
> No. of owner-occupied homes: 1,041,941 — #13 most
[in-text-ad-2]
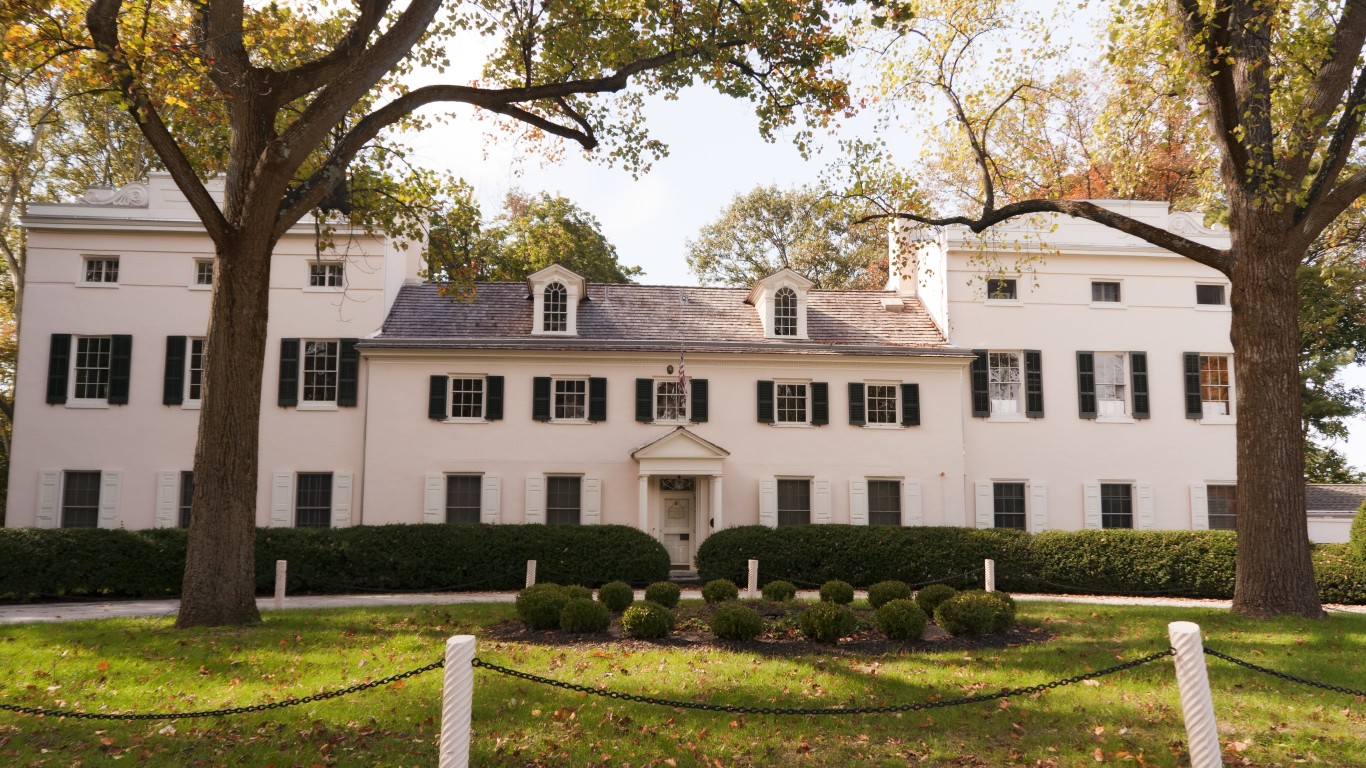
31. Philadelphia, PA
> Pct. of homes worth $1 million or more: 2.15%
> Median home value: $300,300 — #24 highest out of 50 largest cities
> No. of $1 million+ homes: 35,384 — #18 most
> No. of owner-occupied homes: 1,643,030 — #5 most
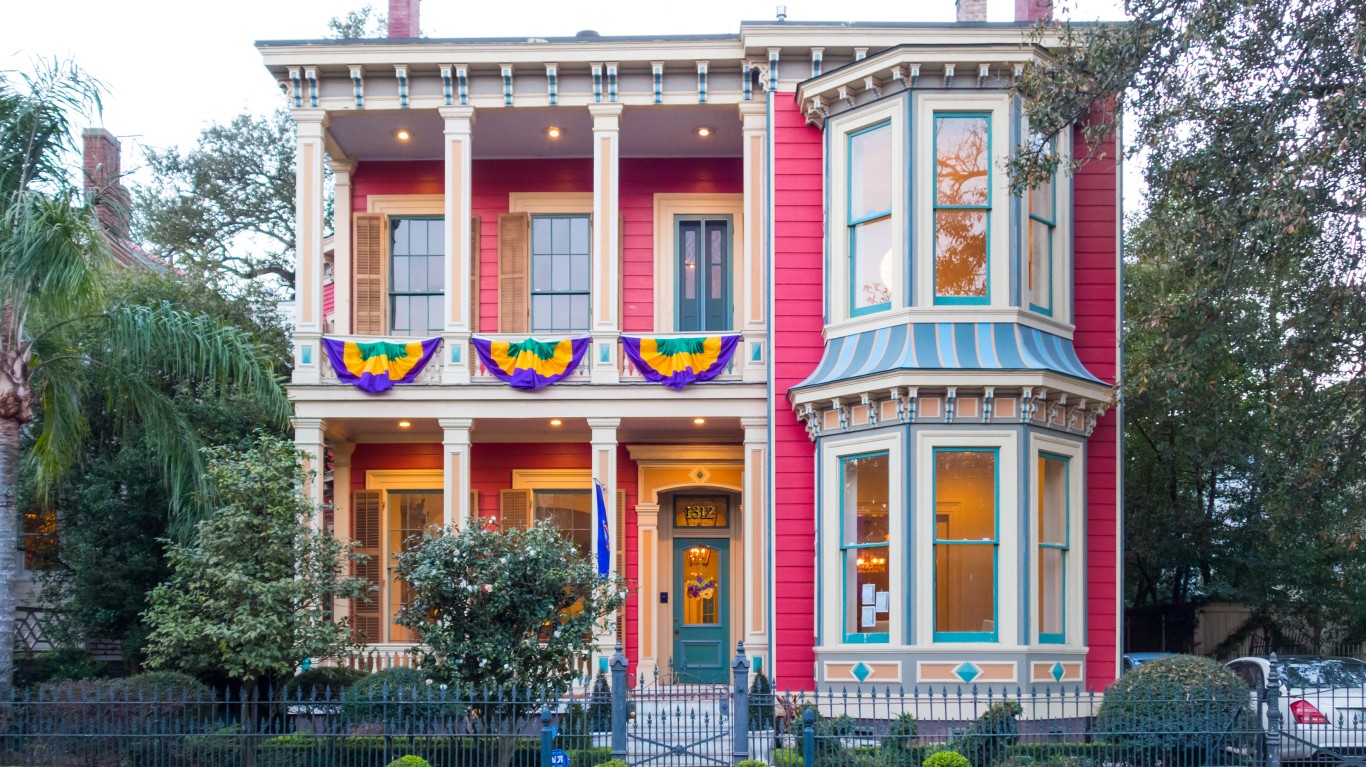
30. New Orleans, LA
> Pct. of homes worth $1 million or more: 2.19%
> Median home value: $236,100 — #38 highest out of 50 largest cities
> No. of $1 million+ homes: 7,267 — #38 most
> No. of owner-occupied homes: 331,108 — #47 most
[in-text-ad]
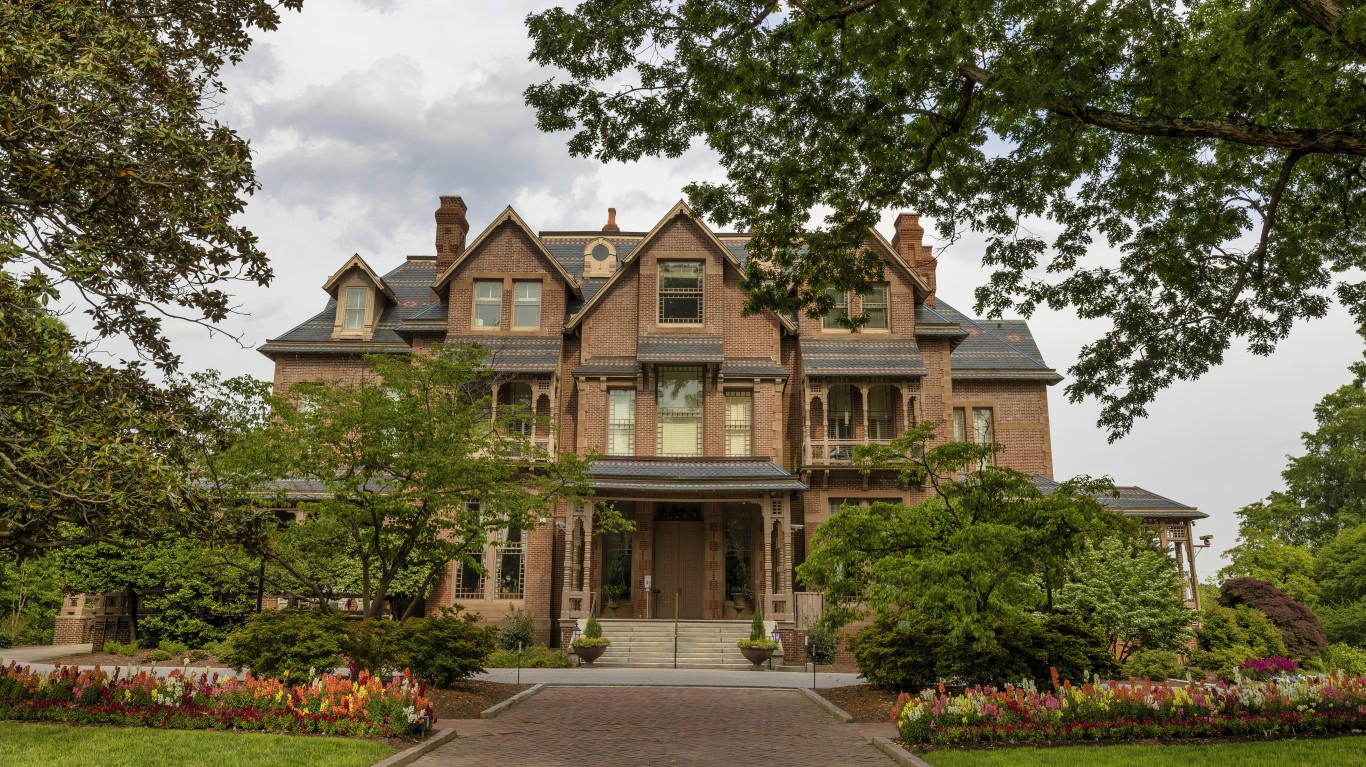
29. Raleigh, NC
> Pct. of homes worth $1 million or more: 2.46%
> Median home value: $346,400 — #20 highest out of 50 largest cities
> No. of $1 million+ homes: 9,131 — #34 most
> No. of owner-occupied homes: 371,855 — #41 most
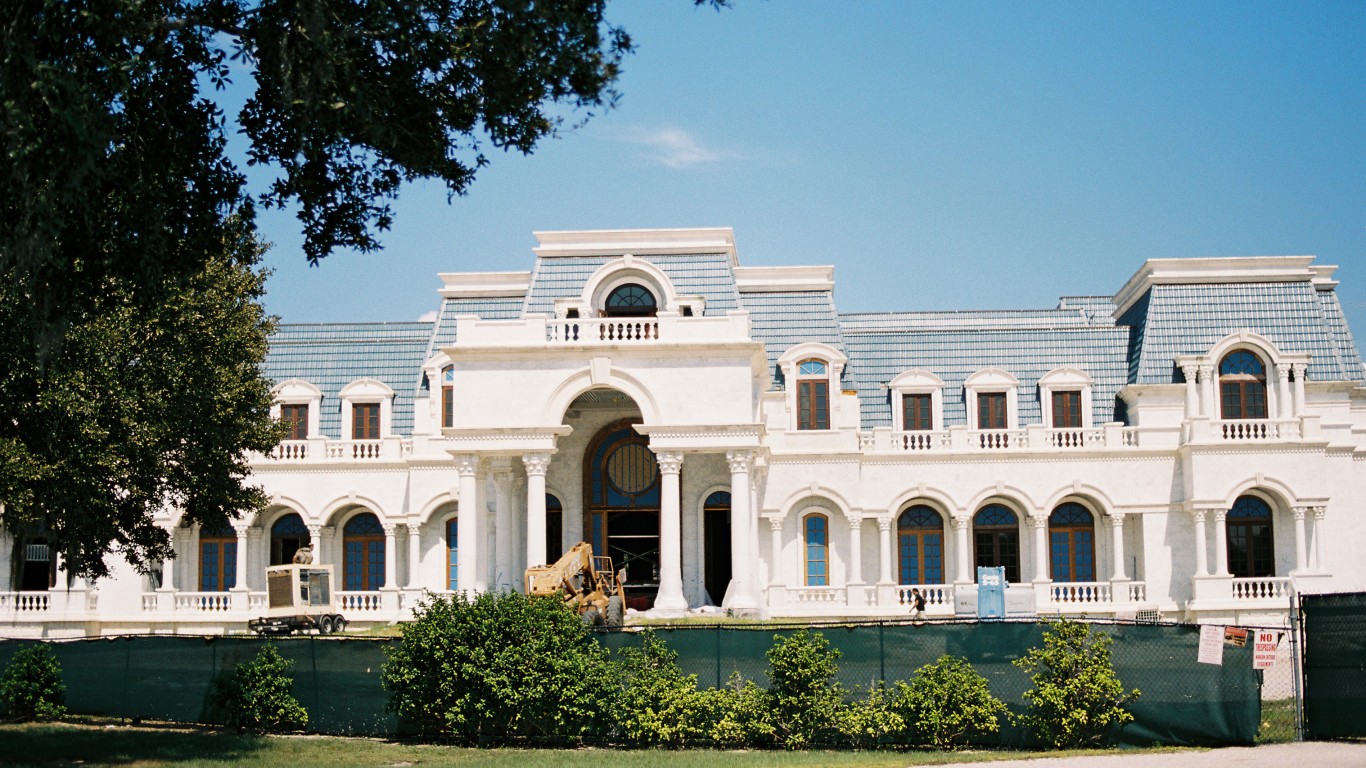
27 (tie). Orlando, FL
> Pct. of homes worth $1 million or more: 2.49%
> Median home value: $303,300 — #23 highest out of 50 largest cities
> No. of $1 million+ homes: 15,621 — #27 most
> No. of owner-occupied homes: 626,752 — #24 most
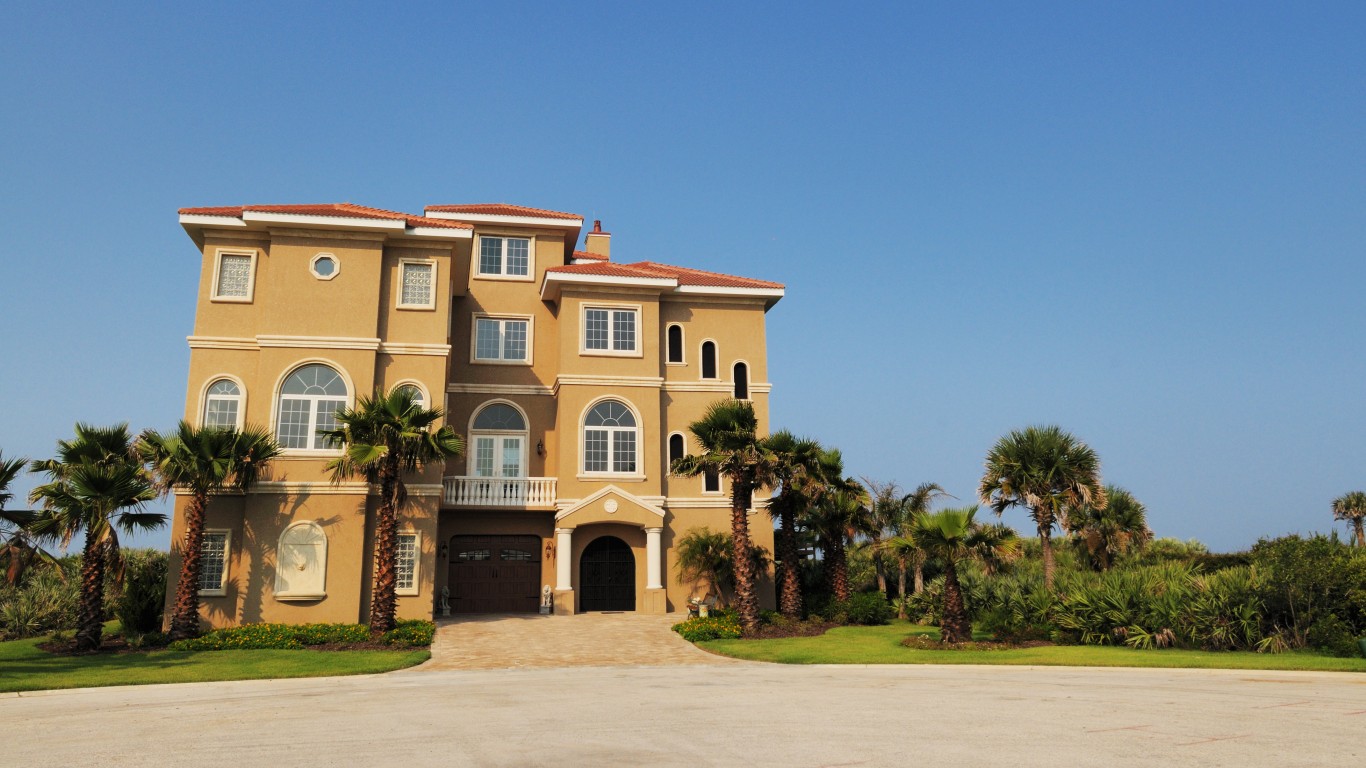
27 (tie). Jacksonville, FL
> Pct. of homes worth $1 million or more: 2.49%
> Median home value: $280,600 — #31 highest out of 50 largest cities
> No. of $1 million+ homes: 10,666 — #32 most
> No. of owner-occupied homes: 428,180 — #37 most
[in-text-ad-2]
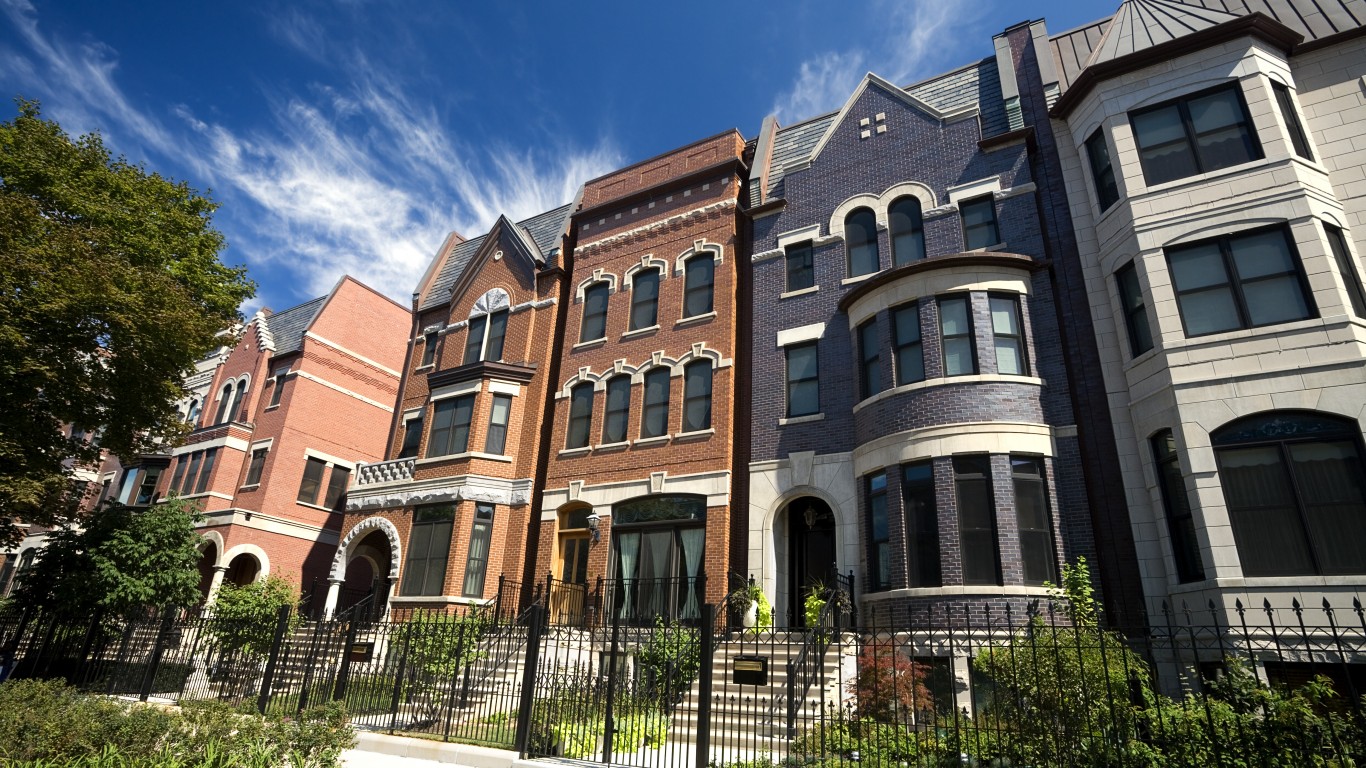
26. Chicago, IL
> Pct. of homes worth $1 million or more: 2.60%
> Median home value: $281,100 — #30 highest out of 50 largest cities
> No. of $1 million+ homes: 62,954 — #10 most
> No. of owner-occupied homes: 2,420,225 — #2 most
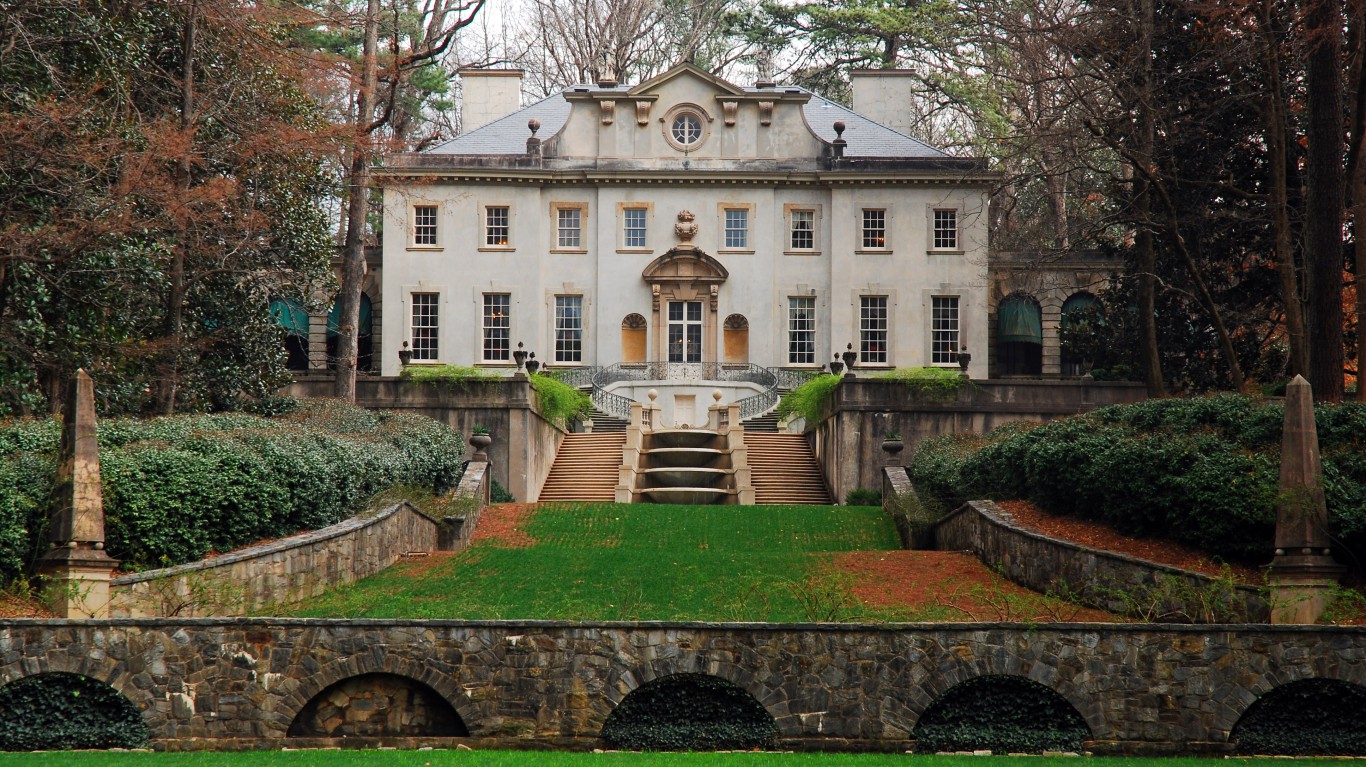
25. Atlanta, GA
> Pct. of homes worth $1 million or more: 2.65%
> Median home value: $300,000 — #25 highest out of 50 largest cities
> No. of $1 million+ homes: 40,459 — #15 most
> No. of owner-occupied homes: 1,524,042 — #8 most
[in-text-ad]
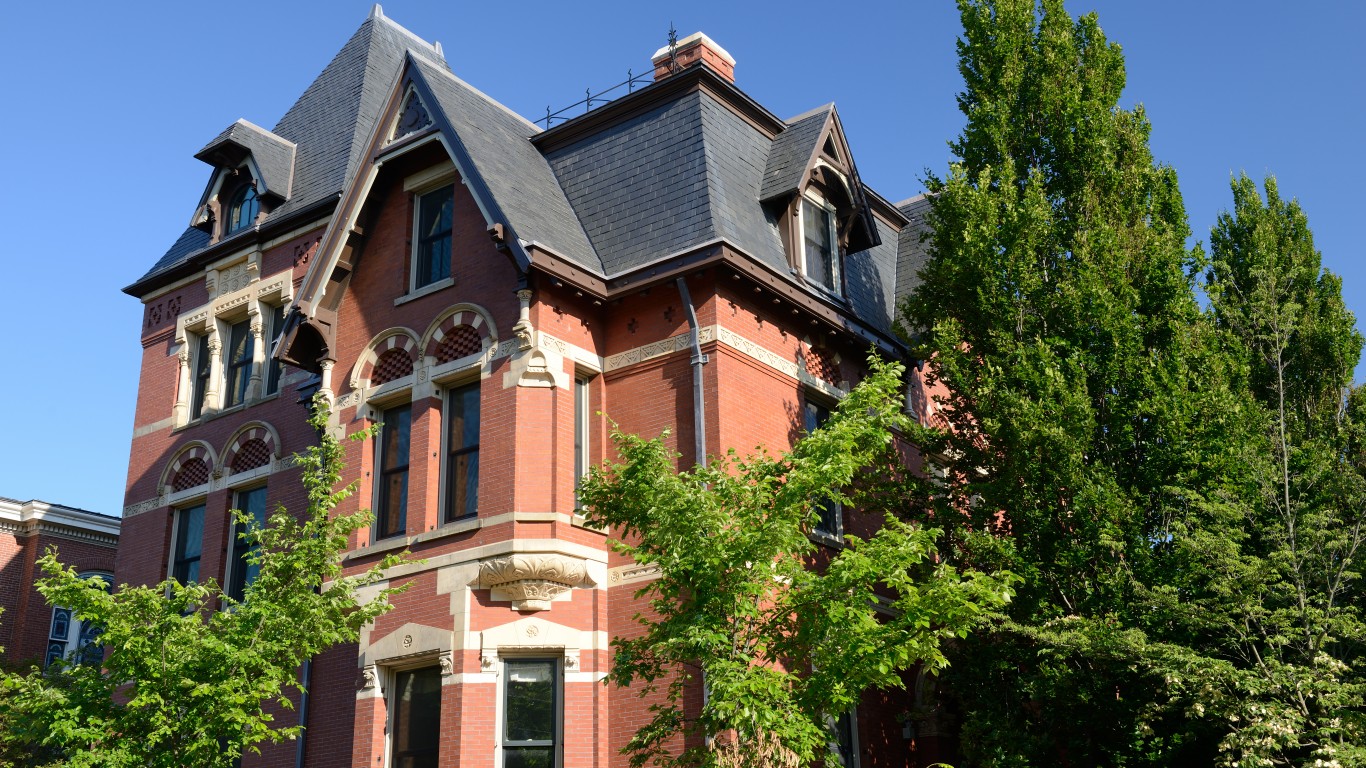
24. Providence, RI
> Pct. of homes worth $1 million or more: 2.67%
> Median home value: $364,000 — #17 highest out of 50 largest cities
> No. of $1 million+ homes: 11,264 — #31 most
> No. of owner-occupied homes: 422,590 — #38 most
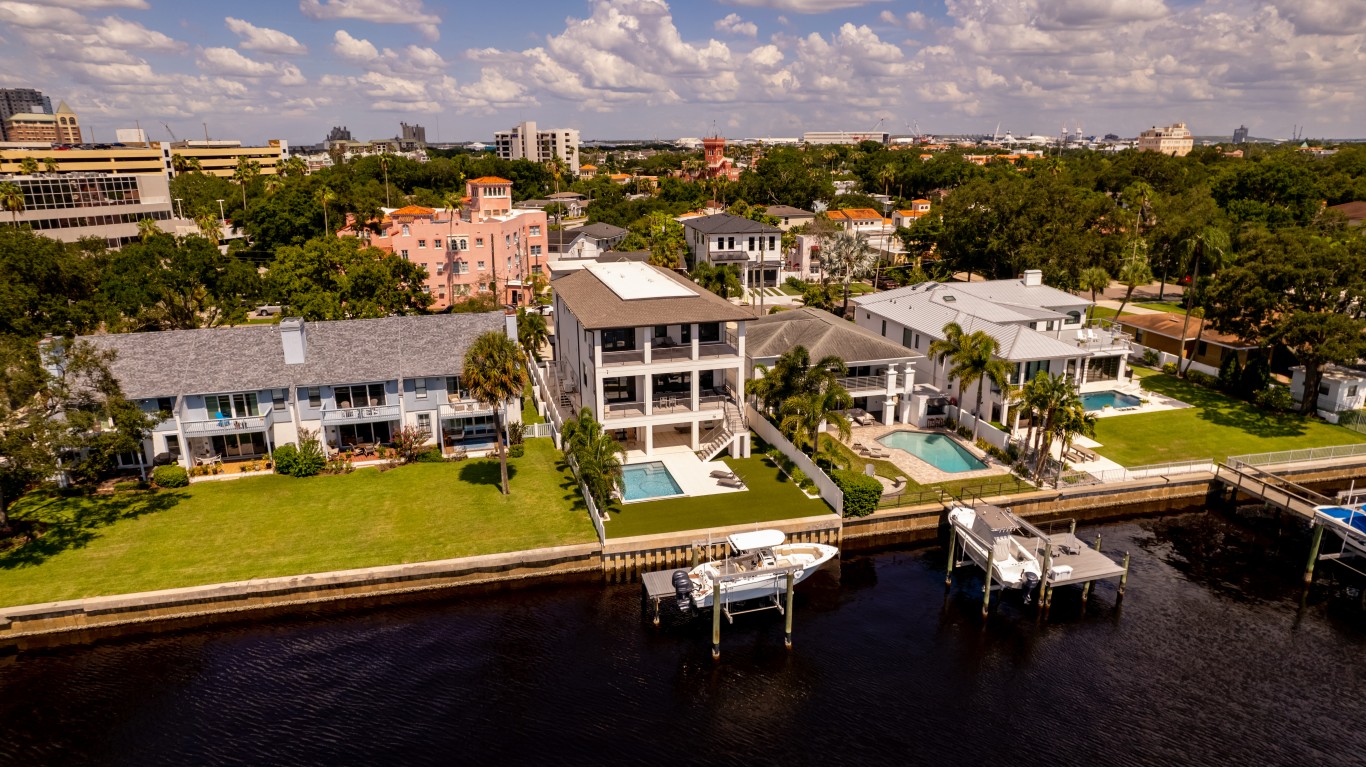
23. Tampa, FL
> Pct. of homes worth $1 million or more: 2.79%
> Median home value: $279,600 — #32 highest out of 50 largest cities
> No. of $1 million+ homes: 24,737 — #22 most
> No. of owner-occupied homes: 887,680 — #17 most
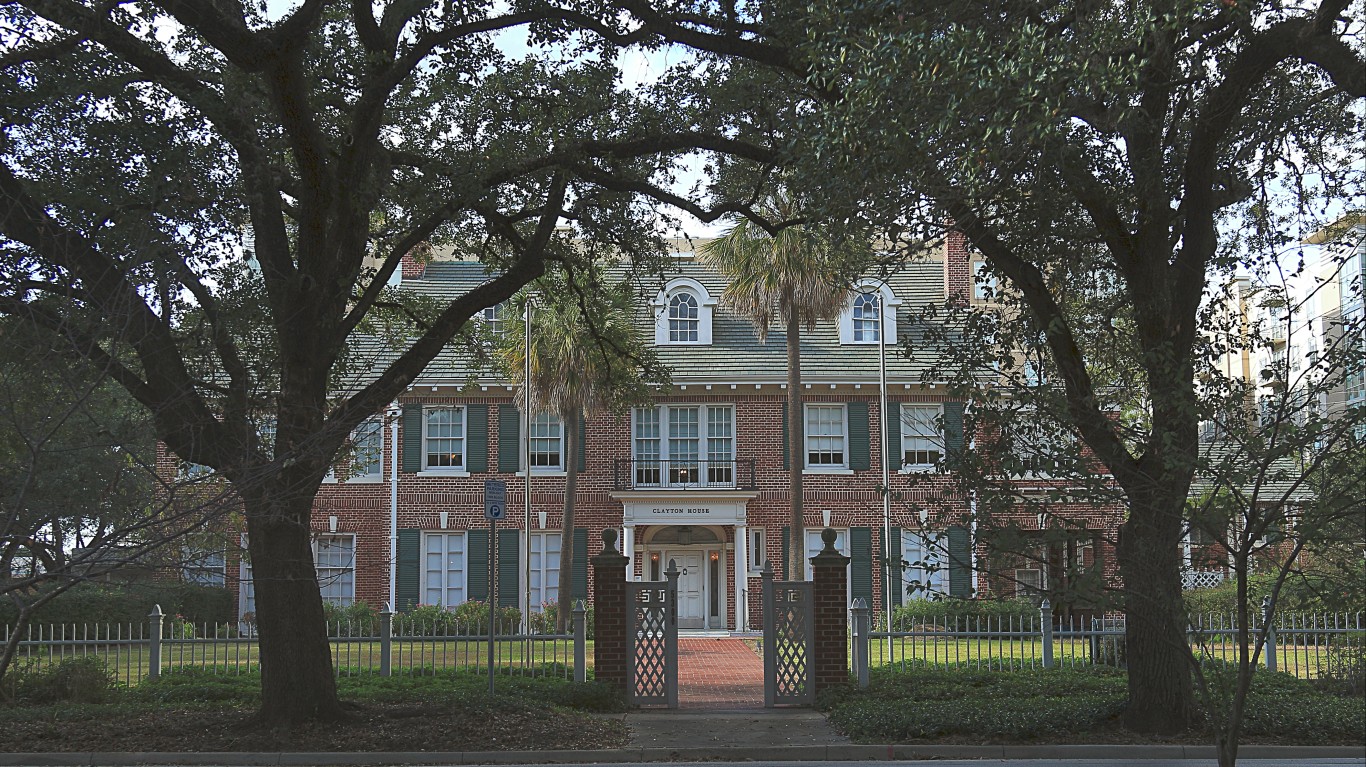
22. Houston, TX
> Pct. of homes worth $1 million or more: 2.82%
> Median home value: $252,300 — #36 highest out of 50 largest cities
> No. of $1 million+ homes: 45,095 — #14 most
> No. of owner-occupied homes: 1,599,497 — #6 most
[in-text-ad-2]
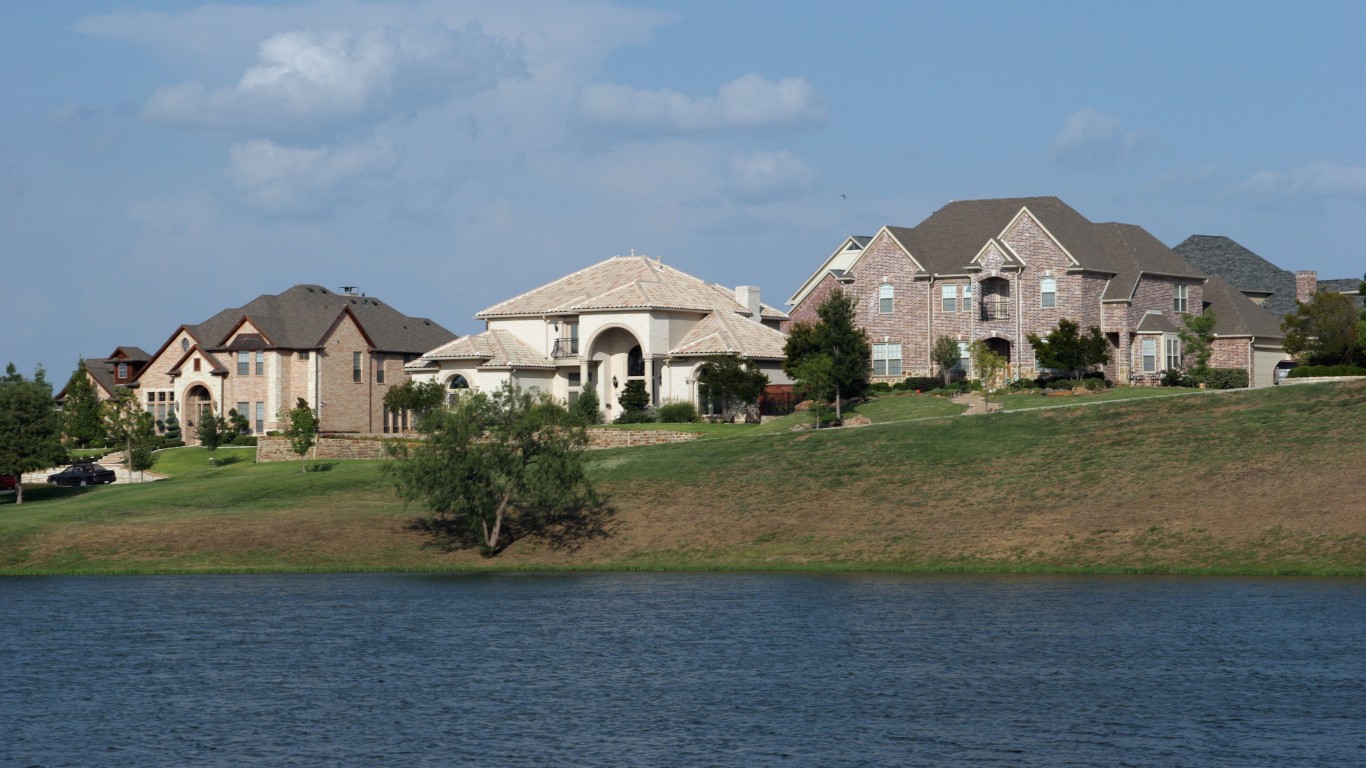
21. Dallas, TX
> Pct. of homes worth $1 million or more: 3.02%
> Median home value: $294,900 — #27 highest out of 50 largest cities
> No. of $1 million+ homes: 51,327 — #13 most
> No. of owner-occupied homes: 1,696,901 — #4 most

20. Charlotte, NC
> Pct. of homes worth $1 million or more: 3.13%
> Median home value: $286,600 — #28 highest out of 50 largest cities
> No. of $1 million+ homes: 21,905 — #24 most
> No. of owner-occupied homes: 698,980 — #22 most
[in-text-ad]
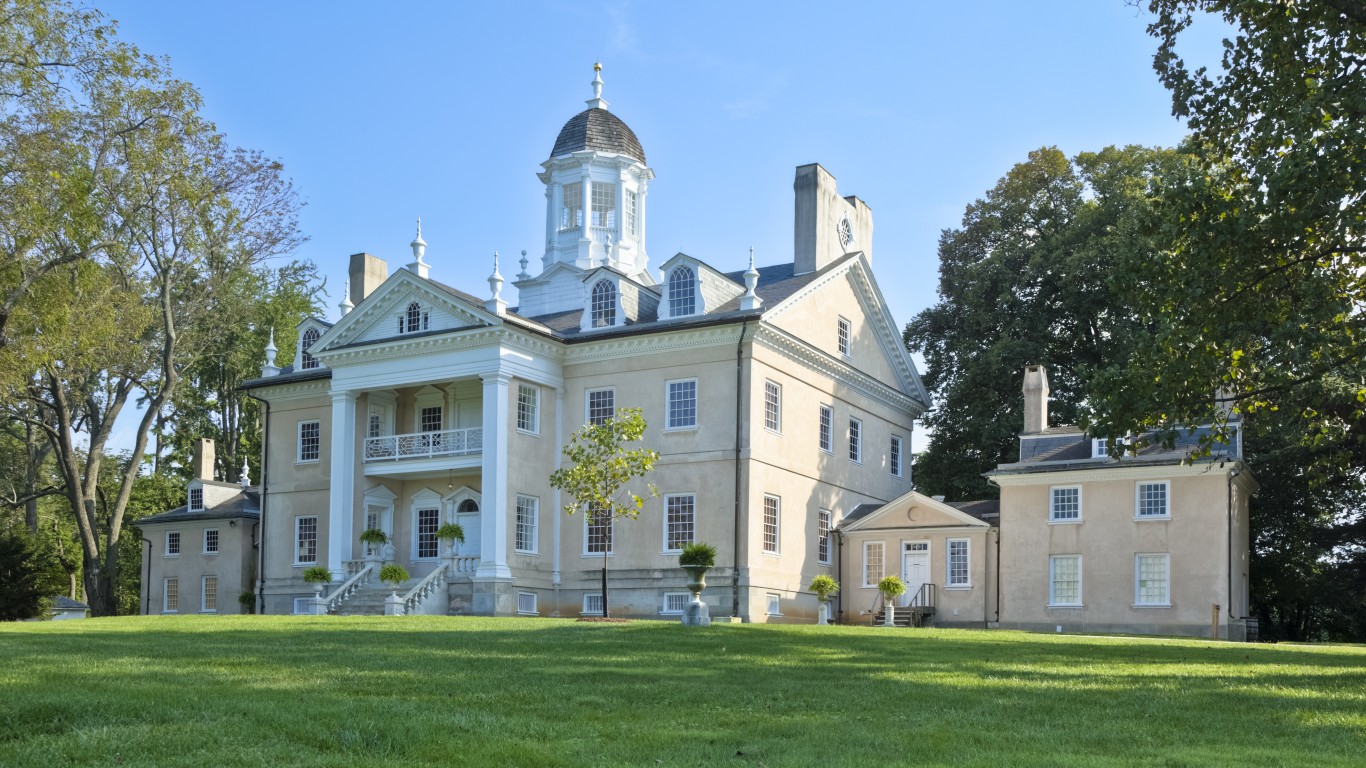
19. Baltimore, MD
> Pct. of homes worth $1 million or more: 3.16%
> Median home value: $351,200 — #19 highest out of 50 largest cities
> No. of $1 million+ homes: 23,820 — #23 most
> No. of owner-occupied homes: 753,741 — #20 most
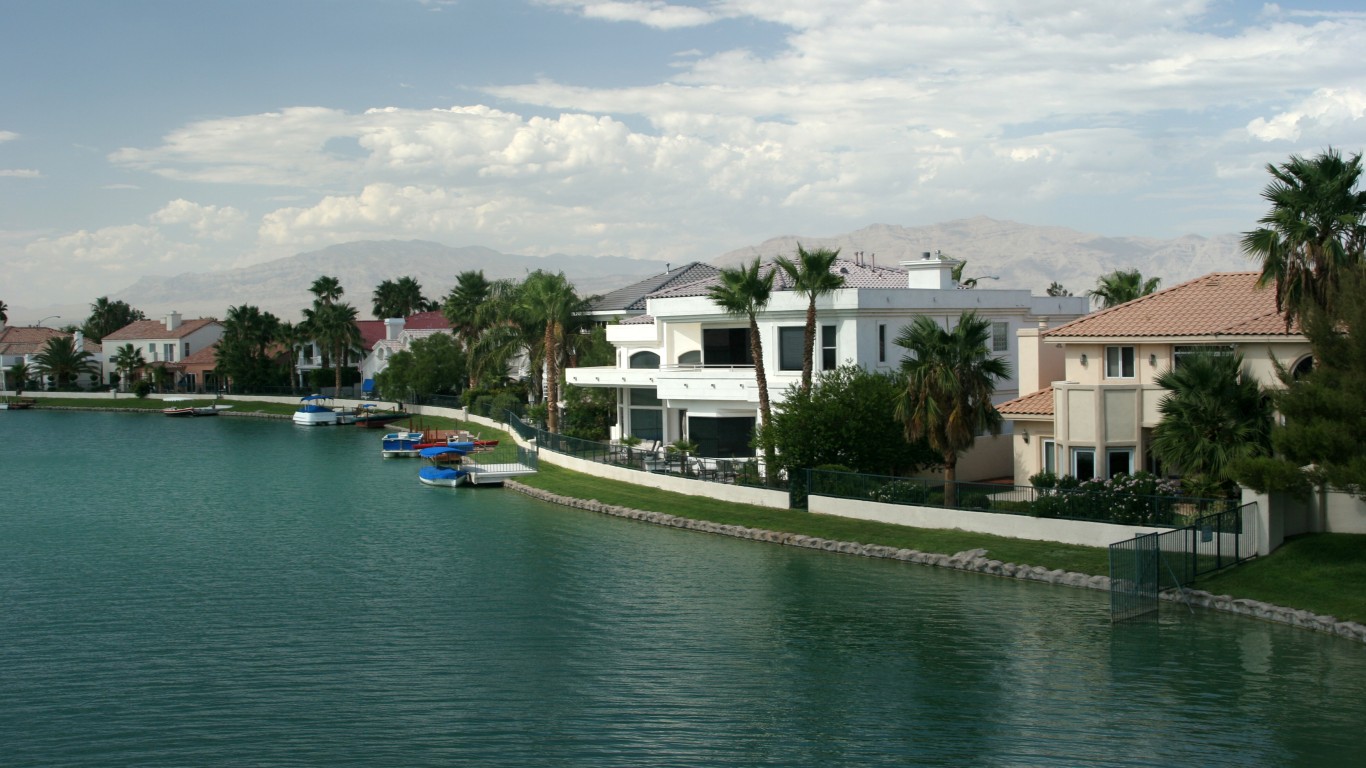
18. Las Vegas, NV
> Pct. of homes worth $1 million or more: 3.42%
> Median home value: $365,800 — #16 highest out of 50 largest cities
> No. of $1 million+ homes: 16,543 — #26 most
> No. of owner-occupied homes: 484,085 — #35 most

17. Riverside, CA
> Pct. of homes worth $1 million or more: 3.53%
> Median home value: $453,000 — #12 highest out of 50 largest cities
> No. of $1 million+ homes: 33,186 — #19 most
> No. of owner-occupied homes: 940,029 — #16 most
[in-text-ad-2]
16. Phoenix, AZ
> Pct. of homes worth $1 million or more: 4.35%
> Median home value: $374,100 — #15 highest out of 50 largest cities
> No. of $1 million+ homes: 54,430 — #12 most
> No. of owner-occupied homes: 1,250,606 — #11 most

15. Nashville, TN
> Pct. of homes worth $1 million or more: 5.06%
> Median home value: $344,900 — #21 highest out of 50 largest cities
> No. of $1 million+ homes: 26,863 — #21 most
> No. of owner-occupied homes: 531,346 — #33 most
[in-text-ad]
13 (tie). Portland, OR
> Pct. of homes worth $1 million or more: 5.11%
> Median home value: $483,000 — #11 highest out of 50 largest cities
> No. of $1 million+ homes: 31,760 — #20 most
> No. of owner-occupied homes: 621,448 — #26 most
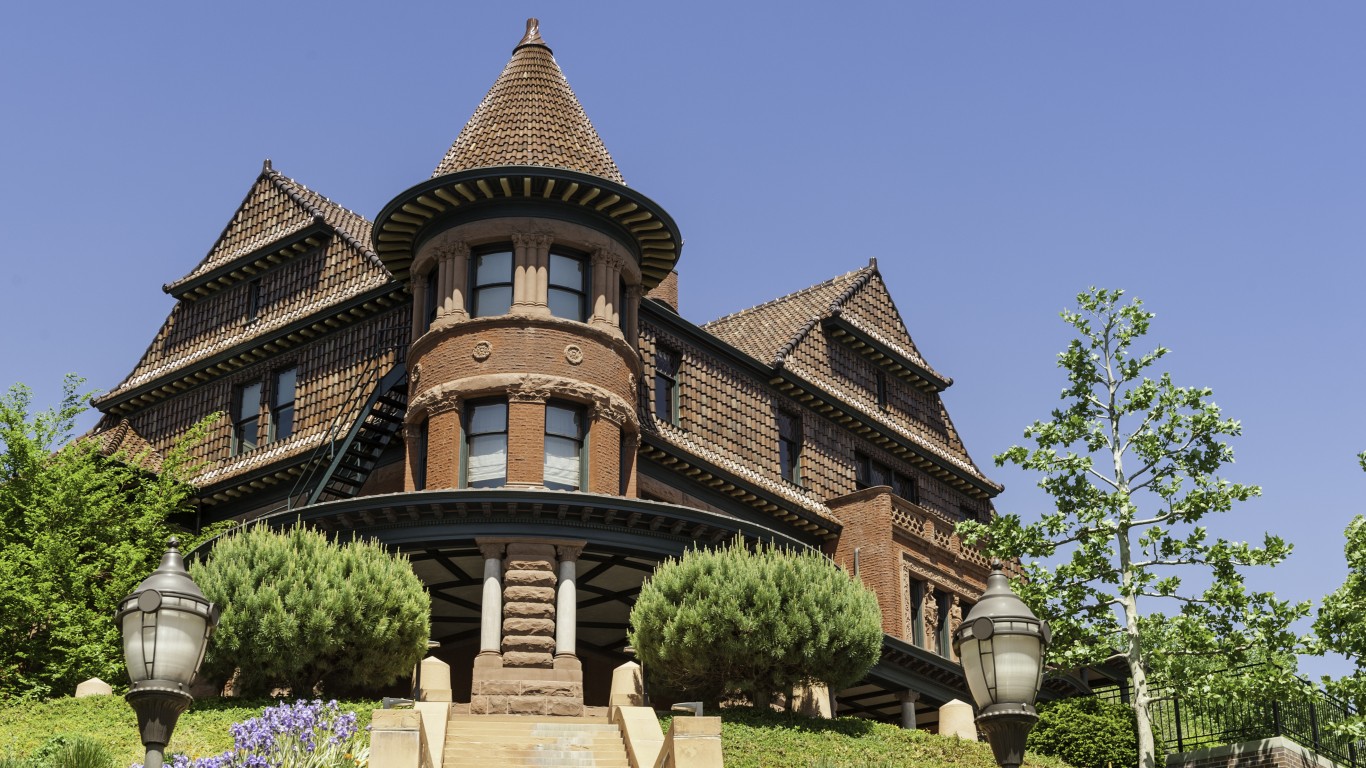
13 (tie). Salt Lake City, UT
> Pct. of homes worth $1 million or more: 5.11%
> Median home value: $444,200 — #13 highest out of 50 largest cities
> No. of $1 million+ homes: 15,179 — #29 most
> No. of owner-occupied homes: 297,148 — #50 most

12. Miami, FL
> Pct. of homes worth $1 million or more: 5.91%
> Median home value: $362,500 — #18 highest out of 50 largest cities
> No. of $1 million+ homes: 82,624 — #9 most
> No. of owner-occupied homes: 1,398,254 — #9 most
[in-text-ad-2]
11. Austin, TX
> Pct. of homes worth $1 million or more: 6.32%
> Median home value: $397,100 — #14 highest out of 50 largest cities
> No. of $1 million+ homes: 35,505 — #17 most
> No. of owner-occupied homes: 561,771 — #31 most

10. Sacramento, CA
> Pct. of homes worth $1 million or more: 6.54%
> Median home value: $513,600 — #9 highest out of 50 largest cities
> No. of $1 million+ homes: 35,831 — #16 most
> No. of owner-occupied homes: 547,793 — #32 most
[in-text-ad]
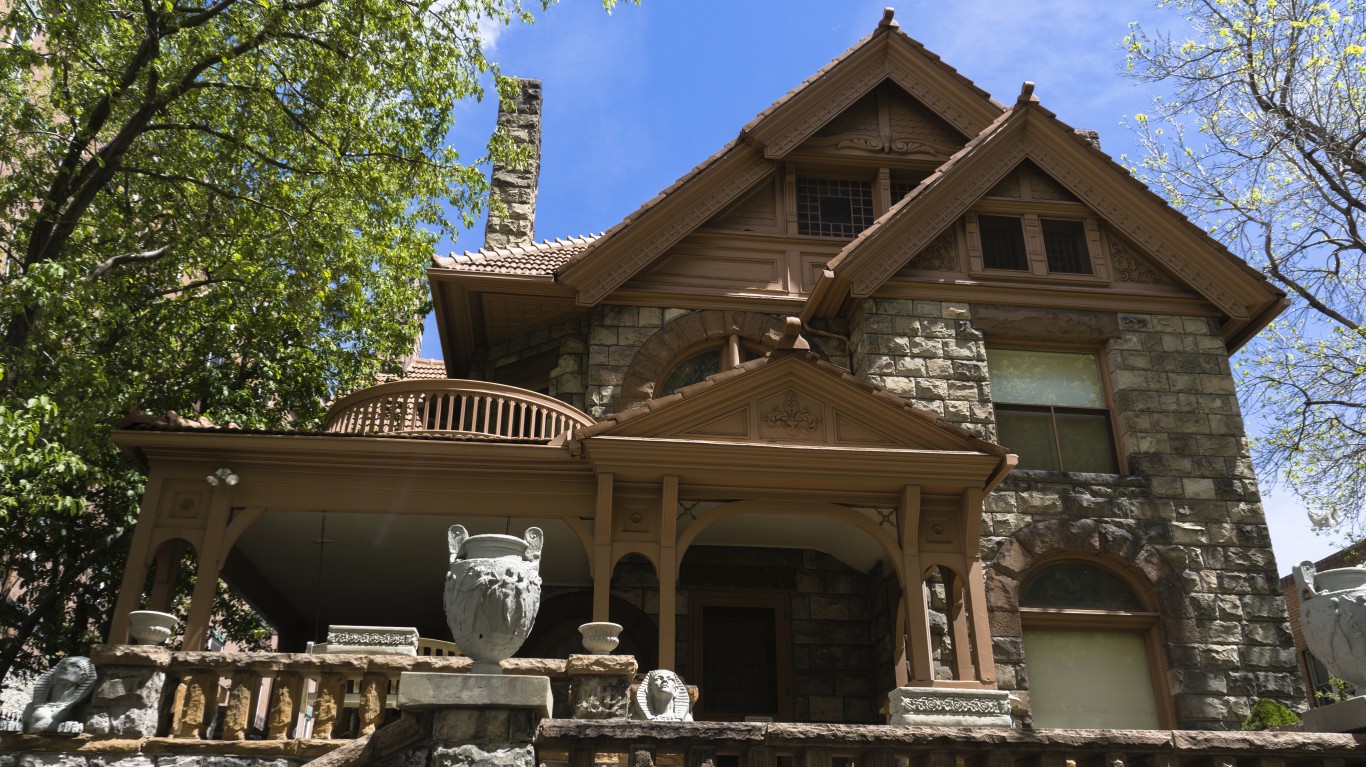
9. Denver, CO
> Pct. of homes worth $1 million or more: 7.79%
> Median home value: $519,600 — #8 highest out of 50 largest cities
> No. of $1 million+ homes: 60,653 — #11 most
> No. of owner-occupied homes: 778,989 — #19 most
8. Washington, DC
> Pct. of homes worth $1 million or more: 9.71%
> Median home value: $497,800 — #10 highest out of 50 largest cities
> No. of $1 million+ homes: 149,015 — #6 most
> No. of owner-occupied homes: 1,535,252 — #7 most
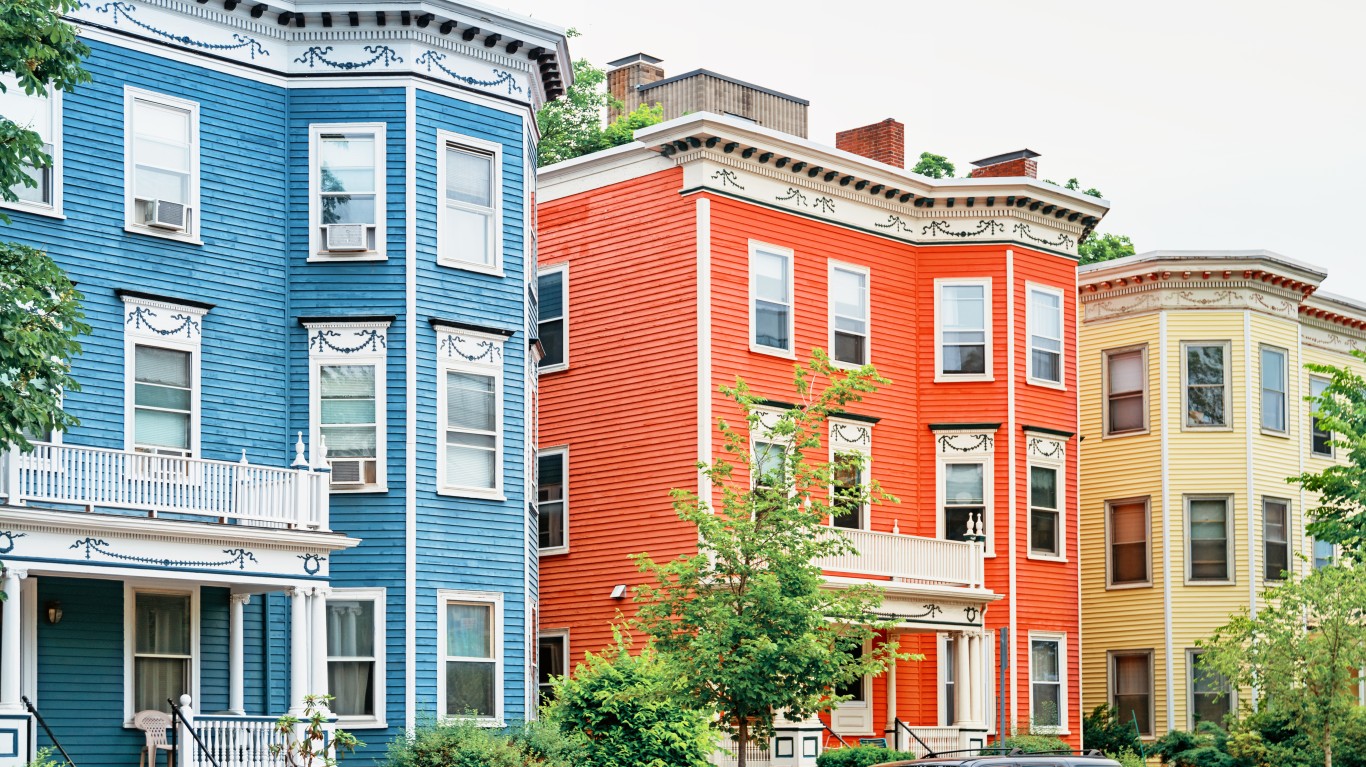
7. Boston, MA
> Pct. of homes worth $1 million or more: 11.82%
> Median home value: $561,500 — #6 highest out of 50 largest cities
> No. of $1 million+ homes: 141,245 — #8 most
> No. of owner-occupied homes: 1,195,386 — #12 most
[in-text-ad-2]
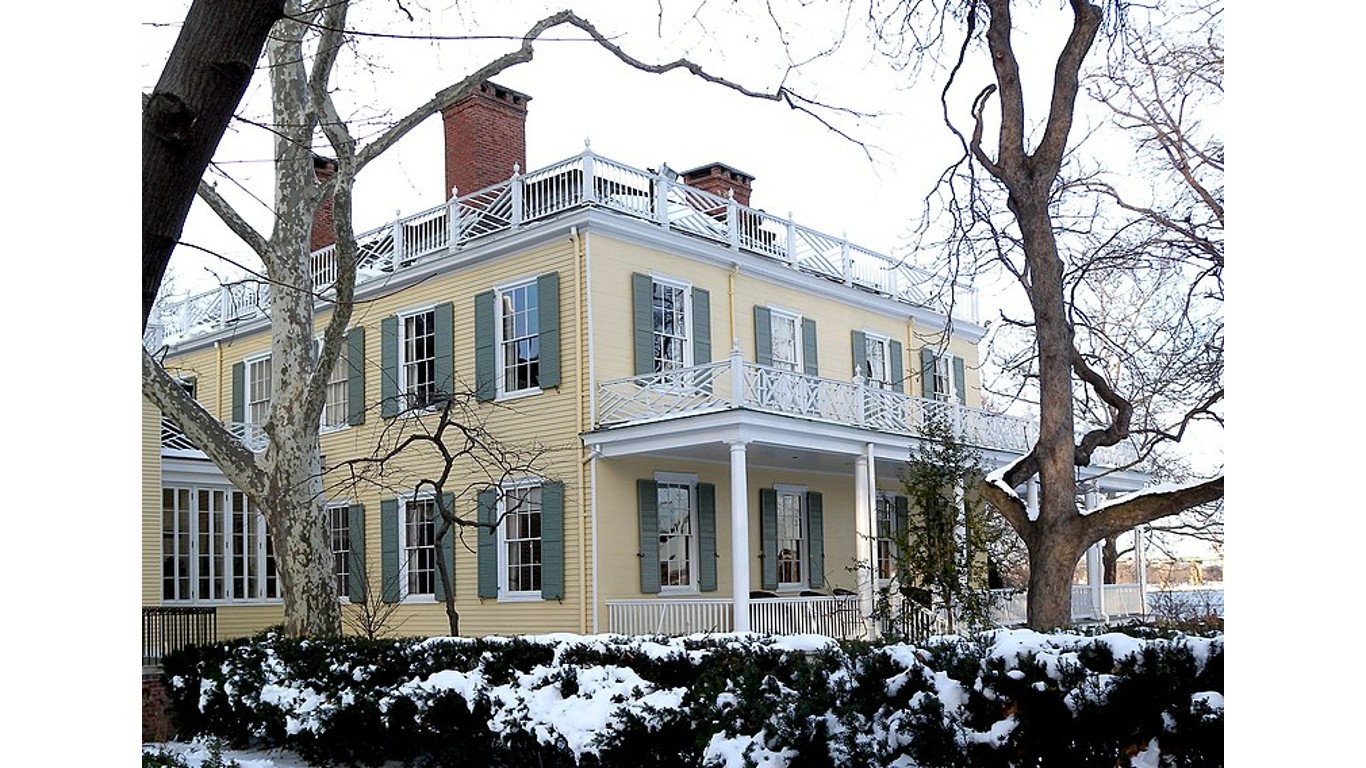
6. New York, NY
> Pct. of homes worth $1 million or more: 11.94%
> Median home value: $533,700 — #7 highest out of 50 largest cities
> No. of $1 million+ homes: 460,865 — #3 most
> No. of owner-occupied homes: 3,860,279 — #1 most

5. Seattle, WA
> Pct. of homes worth $1 million or more: 18.70%
> Median home value: $638,400 — #5 highest out of 50 largest cities
> No. of $1 million+ homes: 180,804 — #5 most
> No. of owner-occupied homes: 966,991 — #14 most
[in-text-ad]

4. San Diego, CA
> Pct. of homes worth $1 million or more: 23.15%
> Median home value: $722,200 — #4 highest out of 50 largest cities
> No. of $1 million+ homes: 146,224 — #7 most
> No. of owner-occupied homes: 631,760 — #23 most
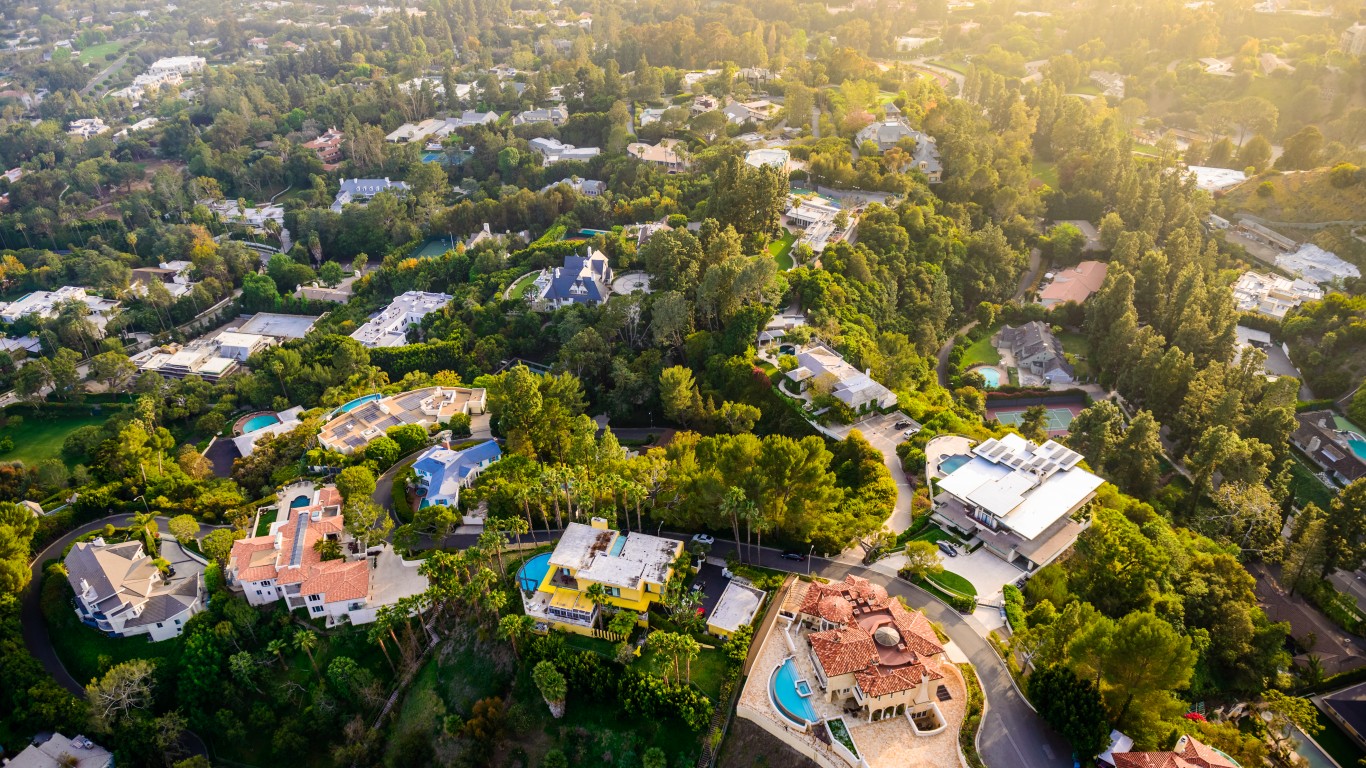
3. Los Angeles, CA
> Pct. of homes worth $1 million or more: 26.48%
> Median home value: $748,700 — #3 highest out of 50 largest cities
> No. of $1 million+ homes: 576,537 — #1 most
> No. of owner-occupied homes: 2,176,998 — #3 most
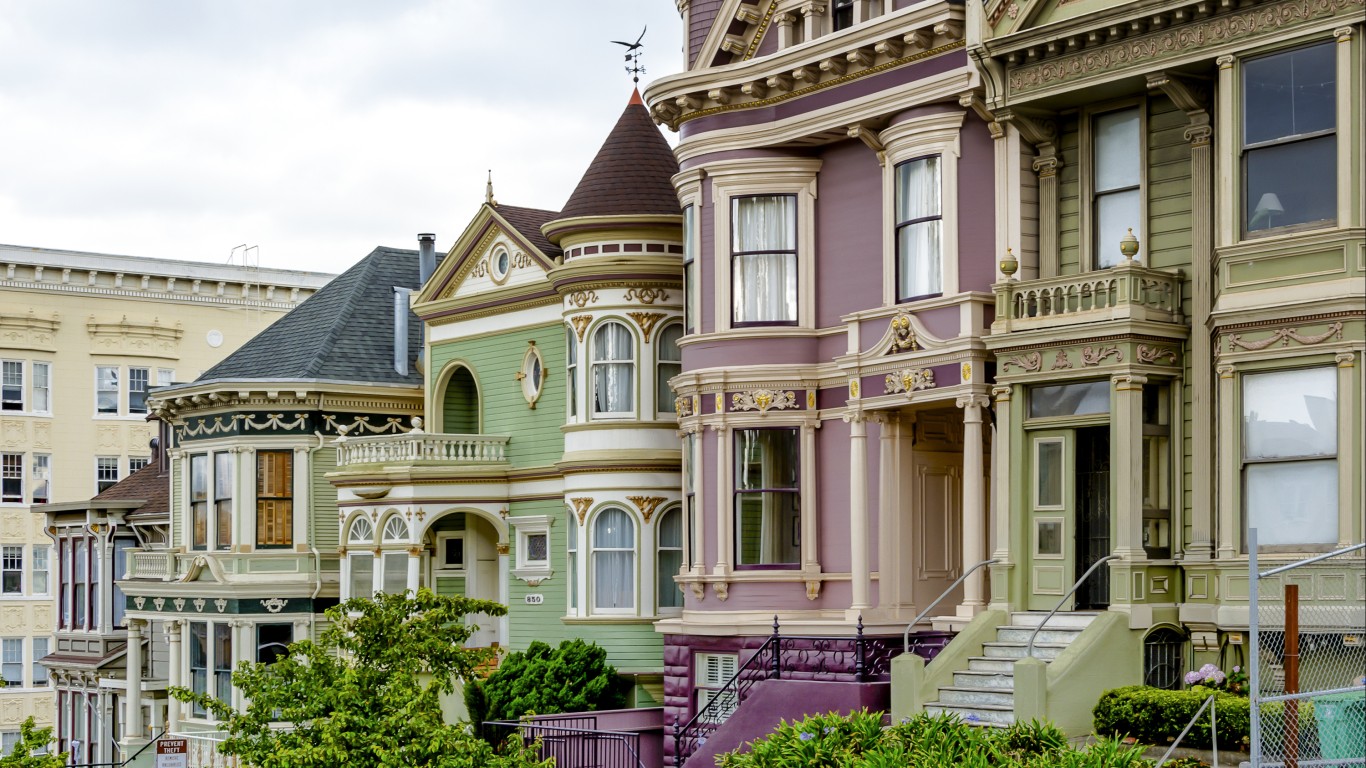
2. San Francisco, CA
> Pct. of homes worth $1 million or more: 52.91%
> Median home value: $1,042,300 — #2 highest out of 50 largest cities
> No. of $1 million+ homes: 507,914 — #2 most
> No. of owner-occupied homes: 959,987 — #15 most
[in-text-ad-2]

1. San Jose, CA
> Pct. of homes worth $1 million or more: 66.28%
> Median home value: $1,237,800 — #1 highest out of 50 largest cities
> No. of $1 million+ homes: 250,179 — #4 most
> No. of owner-occupied homes: 377,447 — #40 most
If you’re like many Americans and keep your money ‘safe’ in a checking or savings account, think again. The average yield on a savings account is a paltry .4% today, and inflation is much higher. Checking accounts are even worse.
Every day you don’t move to a high-yield savings account that beats inflation, you lose more and more value.
But there is good news. To win qualified customers, some accounts are paying 9-10x this national average. That’s an incredible way to keep your money safe, and get paid at the same time. Our top pick for high yield savings accounts includes other one time cash bonuses, and is FDIC insured.
Click here to see how much more you could be earning on your savings today. It takes just a few minutes and your money could be working for you.
Thank you for reading! Have some feedback for us?
Contact the 24/7 Wall St. editorial team.