The United States generated nearly $25.5 trillion in economic output in 2022, more than the combined gross domestic products of European and Central Asian countries, and about $7.5 trillion more than China, a country home to over four times as many people. However, the U.S. is also home to high levels of income inequality, and across the country, millions of Americans are not sharing in the country’s prosperity.
Indicators related to health outcomes, financial security, and educational attainment offer a more comprehensive assessment of quality of life and development at the individual level than economic output alone. When taken together, these measures reveal, in many parts of the United States, a standard of living much lower than what might be expected in a highly-developed economy.
Using data from a range of sources, including the U.S. Census Bureau and the Centers for Disease Control and Prevention, 24/7 Wall St. identified the worst U.S. counties to live in. Counties and county equivalents were ranked on an equally weighted index of three measures – the poverty rate, the share of adults with a bachelor’s degree, and average life expectancy at birth. The measures chosen for the ranking were inspired by the United Nations Development Programme’s Human Development Index.
In every county or county equivalent on this list, residents are far more likely to live below the poverty line than the typical American, and adults are less likely to have a college education. In the United States, both financial security and educational attainment are linked to health outcomes, and in each of the 40 places on this list, life expectancy at birth is over six years below the national average.
These counties are overwhelmingly concentrated in the South and the Midwest, while only three are in the West, and none are in the Northeast.
Home to 12 of the worst counties to live in, Kentucky appears more times on this list than any other state. Most of these Kentucky counties, as well as several in West Virginia, have economies largely based around coal extraction, an industry that has been in decline for years. Between 2001 and 2021, U.S. coal production east of the Mississippi River declined by 56%. Today, much of Appalachian coal country has been devastated by poverty and hit especially hard by the opioid epidemic. (These are the counties in each state where the most people live in poverty.)
Several other counties on this list, mostly in the Midwest, are home to Native American reservations. Due to a number of historical and contemporary factors, many Native American reservations are among the poorest communities in the United States. In these places, economic opportunities are limited, serious financial hardship is widespread, and health outcomes are well below average. (These are the states with the shortest life expectancy.)
Click here to see the worst counties to live in.
To determine the worst U.S. counties to live in, 24/7 Wall St. constructed an index of three measures: poverty, bachelor’s degree attainment among adults, and average life expectancy at birth. The selection of these three measures was inspired by the United Nations’ Human Development Index.
Only counties or county equivalents with populations of at least 1,000 were considered. To better ensure geographic diversity, we only considered the lowest-ranking county in a given metropolitan area.
Data on the share of individuals living below the poverty line, as well as the share of adults 25 and older with at least a bachelor’s degree came from the 2021 U.S. Census Bureau’s American Community Survey and are five-year estimates.
Data on average life expectancy at birth came from the Institute for Health Metrics and Evaluation of the University of Washington and are for 2019.
Supplemental data on population, median household income, and uninsured rate are five-year estimates from the ACS. Data on the number of annual drug overdose deaths per 100,000 residents came from the Centers for Disease Control and Prevention and is for the years 2018 to 2021.
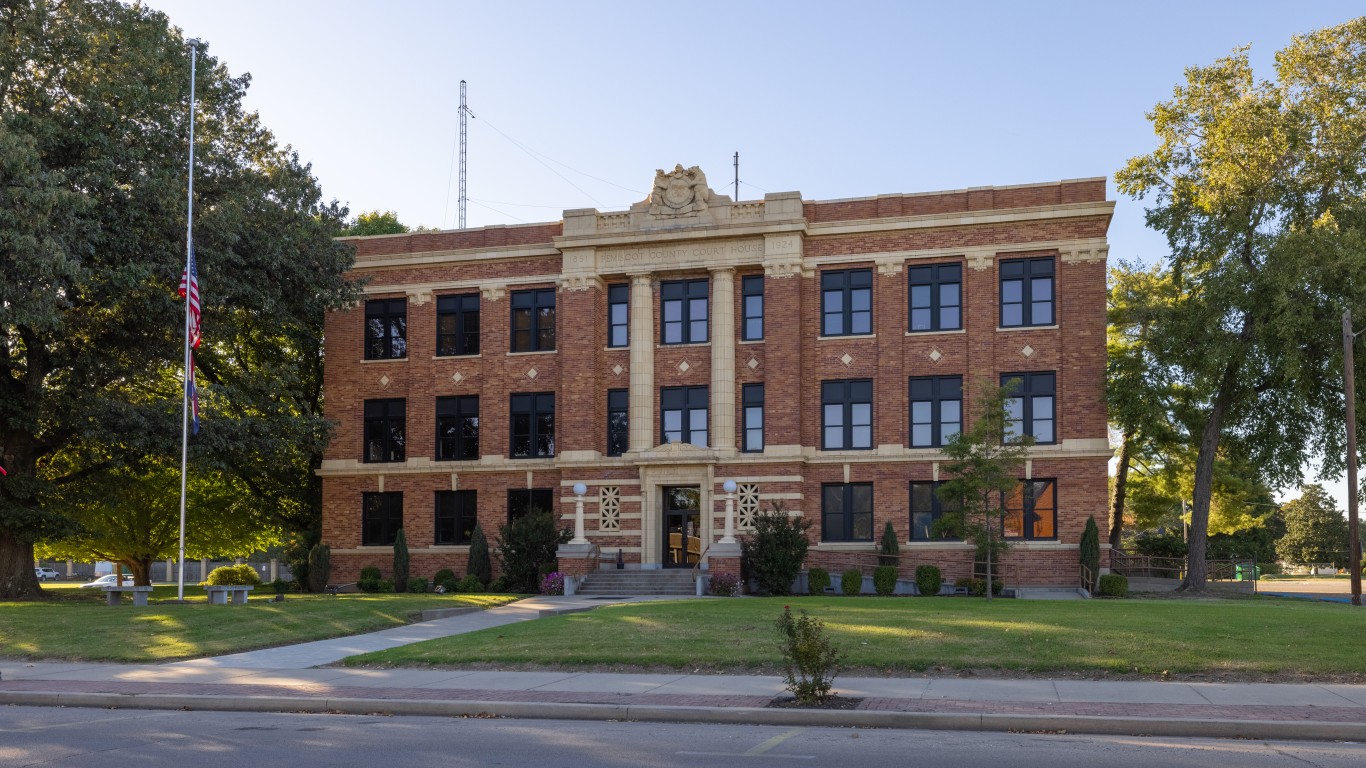
40. Pemiscot County, Missouri
> Poverty rate: 27.5% (#105 of 3,142 counties)
> Adults with a bachelor’s degree: 11.7% (#2,959 of 3,142 counties)
> Life expectancy at birth: 71.4 years (#3,071 of 3,111 counties)
> Median household income: $35,865 (#3,032 of 3,142 counties)
> County seat: Caruthersville
Pemiscot ranks as the worst county to live in in Missouri, and one of the worst nationwide. The local poverty rate of 27.5% is more than double the 12.6% U.S. poverty rate. Health outcomes are also lagging in the county. Life expectancy at birth in Pemiscot is just 71.4 years, compared to the 79.1 year average across the United States.
Like many U.S. counties lagging in key socioeconomic indicators, Pemiscot County’s population is shrinking. From 2015 to 2021, the number of people living there fell by 10.6%, even as Missouri’s population expanded by 1.6% and the U.S. population grew by 4.9%.
[in-text-ad]
39. Okfuskee County, Oklahoma
> Poverty rate: 27.6% (#104 of 3,142 counties)
> Adults with a bachelor’s degree: 10.7% (#3,043 of 3,142 counties)
> Life expectancy at birth: 71.6 years (#3,067 of 3,111 counties)
> Median household income: $43,000 (#2,748 of 3,142 counties)
> County seat: Okemah
With widespread financial hardship and markedly poor health outcomes, Okfuskee County, located in east-central Oklahoma, ranks among the worst U.S. counties to live in. Major employers in the area include several manufacturing factories and a correctional facility, but jobs appear to be low paying. The typical household in the county earns just $43,000 a year, and 27.6% of the local population live below the poverty line – compared to a median household income of $69,021 and a poverty rate of 12.6% across the U.S. as a whole.
Health outcomes tend to improve with financial security, both for individuals and across broad populations. Of the 77 counties in Oklahoma, Okfuskee has the lowest life expectancy at birth, at just 71.6 years. Meanwhile, life expectancy at birth in Oklahoma is 76.1 years.
38. Morehouse Parish, Louisiana
> Poverty rate: 30.1% (#58 of 3,142 counties)
> Adults with a bachelor’s degree: 11.5% (#2,981 of 3,142 counties)
> Life expectancy at birth: 71.8 years (#3,057 of 3,111 counties)
> Median household income: $33,758 (#3,073 of 3,142 counties)
> County seat: Bastrop
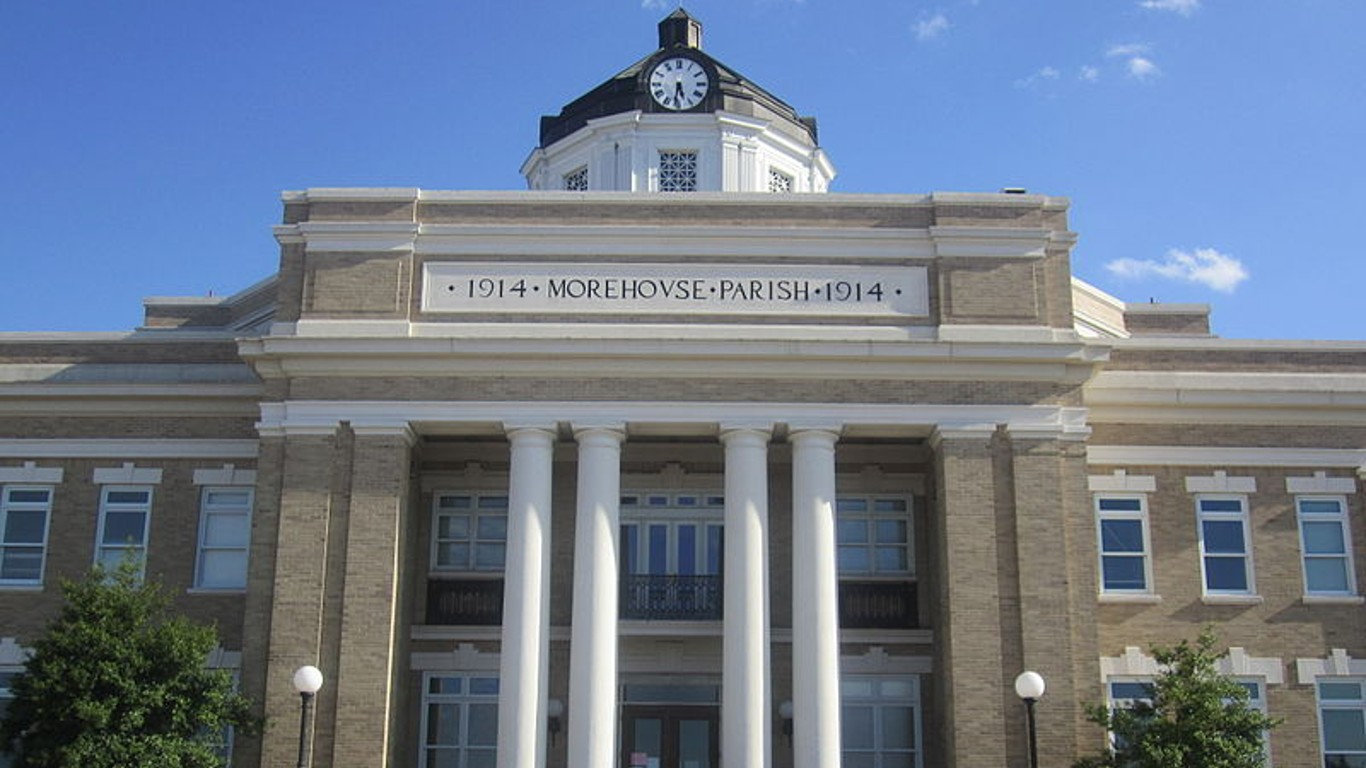
Morehouse is one of three Louisiana parishes to rank on this list. While no corner of the country has been spared by the opioid epidemic, Morehouse Parish has been hit especially hard. There were 40.2 fatal drug overdoses reported for every 100,000 people in the parish from 2018 to 2021, compared to the national overdose fatality rate of 26.8 per 100,000. Partially as a result, at just 71.8 years, life expectancy at birth in the Morehouse Parish is over seven years below the national average.
An economically disadvantaged area, Morhouse’s 30.1% poverty rate is more than double the U.S. poverty rate. Additionally, the local five-year average unemployment rate stands at 9.2%. A lack of economic opportunity may be driving people away from the parish, as Morehouse’s population contracted by 4.3% between 2015 and 2021.
37. McKinley County, New Mexico
> Poverty rate: 34.0% (#30 of 3,142 counties)
> Adults with a bachelor’s degree: 12.2% (#2,911 of 3,142 counties)
> Life expectancy at birth: 72.3 years (#3,031 of 3,111 counties)
> Median household income: $40,262 (#2,881 of 3,142 counties)
> County seat: Gallup
McKinley County, located in northwestern New Mexico encompassing parts of the Navajo Nation and Zuni Pueblo, ranks as the worst place to live in the state and one of the worst places to live in the country. Due to a number of historical and contemporary factors, many Native American reservations are among the poorest communities in the United States – and McKinley County is no exception. An estimated 34.0% of the population live below the poverty line, more than double the 12.6% national poverty rate. Widespread financial insecurity in the county is partially attributable to a weak job market. An average of 10.9% of the local labor force were unemployed over the last five years, roughly double the comparable national jobless rate of 5.5%.
Health outcomes in the county are also indicative of inadequate access to medical care and to healthy lifestyles. At just 72.3 years, life expectancy at birth in McKinley County is nearly seven years lower than the U.S. average.
[in-text-ad-2]
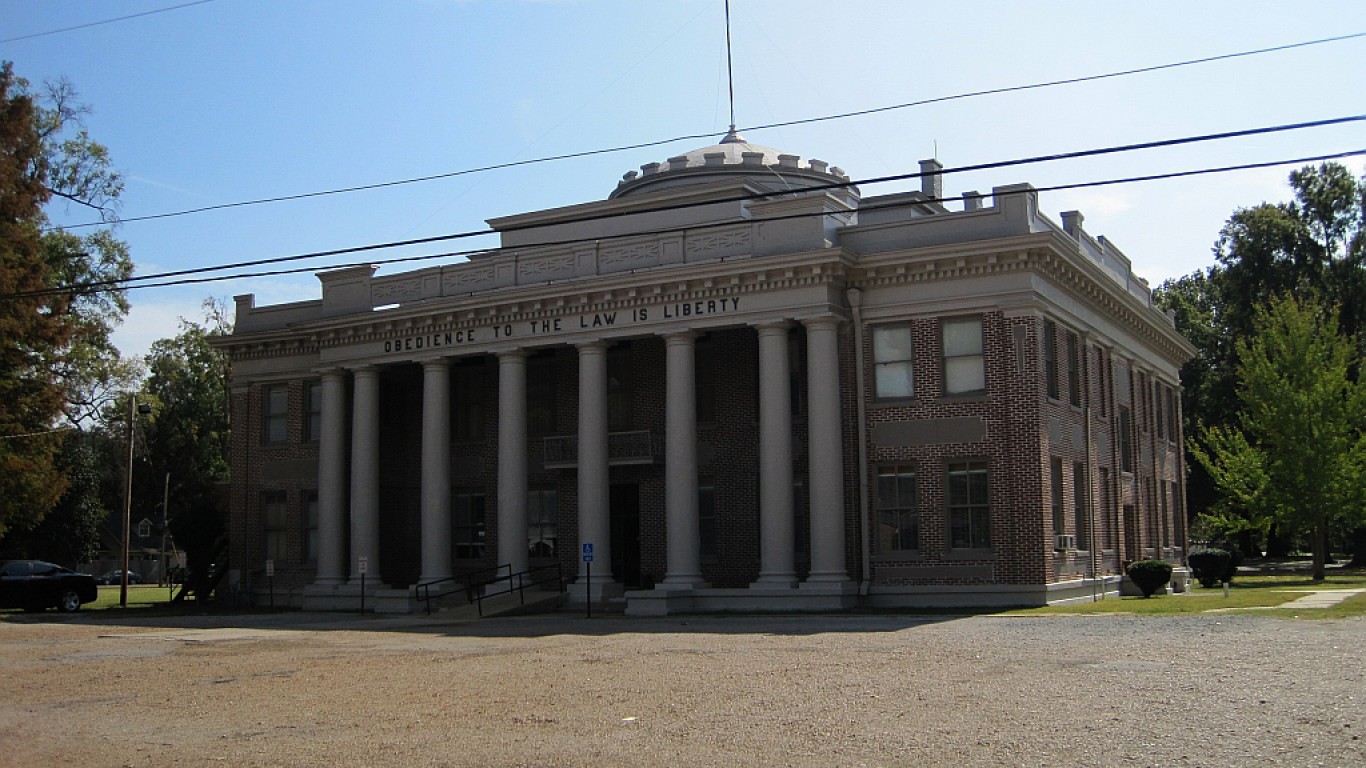
36. Madison Parish, Louisiana
> Poverty rate: 35.0% (#22 of 3,142 counties)
> Adults with a bachelor’s degree: 15.1% (#2,541 of 3,142 counties)
> Life expectancy at birth: 72.0 years (#3,048 of 3,111 counties)
> Median household income: $36,875 (#3,008 of 3,142 counties)
> County seat: Tallulah
Madison Parish, located in northeastern Louisiana along the Mississippi River, ranks among the worst places to live largely because of widespread financial hardship. The local poverty rate of 35.0% is more than double the 12.6% U.S. poverty rate. Additionally, the typical household in the parish earns just $36,875 a year, about $32,000 less than the typical U.S. household. Incomes tend to rise with educational attainment, and in Madison Parish, only 15.1% of adults have a bachelor’s degree and 75.4% have a high school diploma, well below the respective national shares of 33.7% and 88.9%.
As is the case in many places on this list, Madison Parish’s population is shrinking rapidly. Between 2015 and 2021, the number of people living there fell by 13.3%.
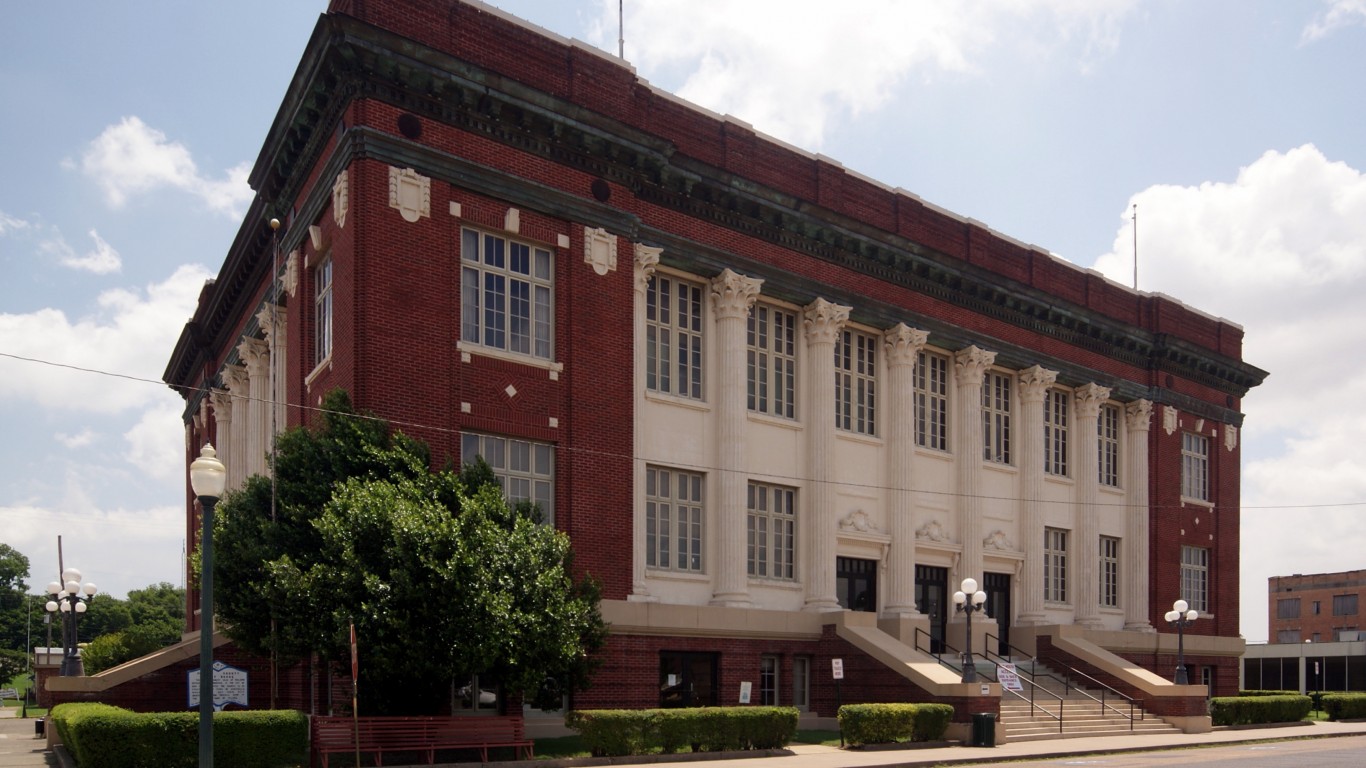
35. Phillips County, Arkansas
> Poverty rate: 33.3% (#36 of 3,142 counties)
> Adults with a bachelor’s degree: 14.3% (#2,660 of 3,142 counties)
> Life expectancy at birth: 71.7 years (#3,063 of 3,111 counties)
> Median household income: $32,235 (#3,097 of 3,142 counties)
> County seat: Helena
Located in Arkansas’ Delta region, the county is a former agricultural and transportation hub with a history of racial tensions and violence. Suffering from decades of economic decline, Phillips County’s 33.3% poverty rate is among the highest in the United States – and is attributable in part to a weak job market. The county’s average unemployment rate over the last five years was 15.2%, well more than double the comparable U.S. jobless rate.
As is often the case in parts of the country with high poverty and limited economic opportunity, the population is declining in Phillips County. Since 2015, the number of people living in the county has fallen by 17.0%, even as the U.S. population expanded by 4.9%.
[in-text-ad]
34. Marlboro County, South Carolina
> Poverty rate: 28.0% (#93 of 3,142 counties)
> Adults with a bachelor’s degree: 8.0% (#3,126 of 3,142 counties)
> Life expectancy at birth: 71.7 years (#3,062 of 3,111 counties)
> Median household income: $32,136 (#3,098 of 3,142 counties)
> County seat: Bennettsville
South Carolina is one of the fastest growing states in the country, reporting 6.3% population growth between 2015 and 2021. Marlboro County, however, located along the North Carolina border, is bucking the trend, reporting a 3.9% population decline over the same period.
Population decline in the area is likely due in part to limited economic opportunities. The local five-year unemployment rate of 8.9% is well above the comparable 5.5% national rate, and many Marlboro County residents are suffering as a result. The 28.0% local poverty rate is more than double the 12.6% national jobless rate. Health outcomes tend to be worse in poorer communities, and at just 71.7 years, average life expectancy at birth in Marlboro County is over seven years below the national average.
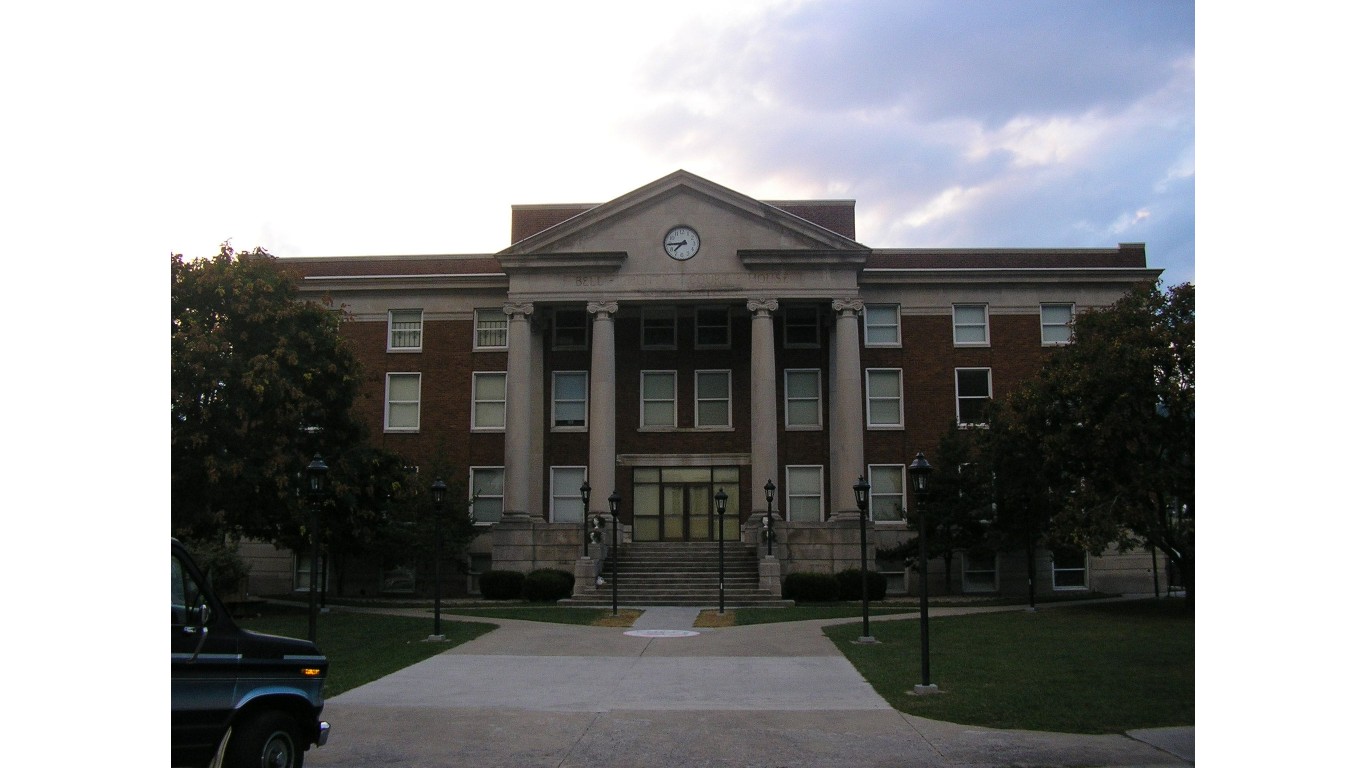
33. Bell County, Kentucky
> Poverty rate: 28.3% (#87 of 3,142 counties)
> Adults with a bachelor’s degree: 9.9% (#3,081 of 3,142 counties)
> Life expectancy at birth: 71.4 years (#3,074 of 3,111 counties)
> Median household income: $32,123 (#3,100 of 3,142 counties)
> County seat: Pineville
Bell County, located in Kentucky’s southeastern corner, is one of many coal-producing counties in Appalachia to rank among the worst places to live. As is the case in much of the region, Bell County is home to widespread financial hardship and poor public health outcomes. The local poverty rate stands at 28.3%, more than double the 12.6% national rate. Additionally, life expectancy at birth in the county is about 71.4 years, over seven years below the national average.
The low average life expectancy is partially attributable not only to widespread poverty, but also the opioid epidemic, which has hit Bell County particularly hard. According to the CDC, there were 52 drug overdose deaths for every 100,000 people in the area from 2018 to 2021, nearly double the national overdose fatality rate of 26.8 per 100,000.

32. Sunflower County, Mississippi
> Poverty rate: 31.3% (#47 of 3,142 counties)
> Adults with a bachelor’s degree: 16.1% (#2,369 of 3,142 counties)
> Life expectancy at birth: 70.9 years (#3,083 of 3,111 counties)
> Median household income: $32,608 (#3,090 of 3,142 counties)
> County seat: Indianola
Sunflower is one of five counties in Mississippi to rank on this list. With a 31.3% poverty rate and median household income of just $32,608, Sunflower County is one of the poorest places in the United States. Widespread financial hardship is partially the result of a weak job market, as an average of 11.3% of the local labor force were unemployed over the last five years.
Lower-income Americans tend to have worse health outcomes than more financially secure populations. In Sunflower County, average life expectancy at birth is just 70.9 years, about eight years below the national average.
[in-text-ad-2]
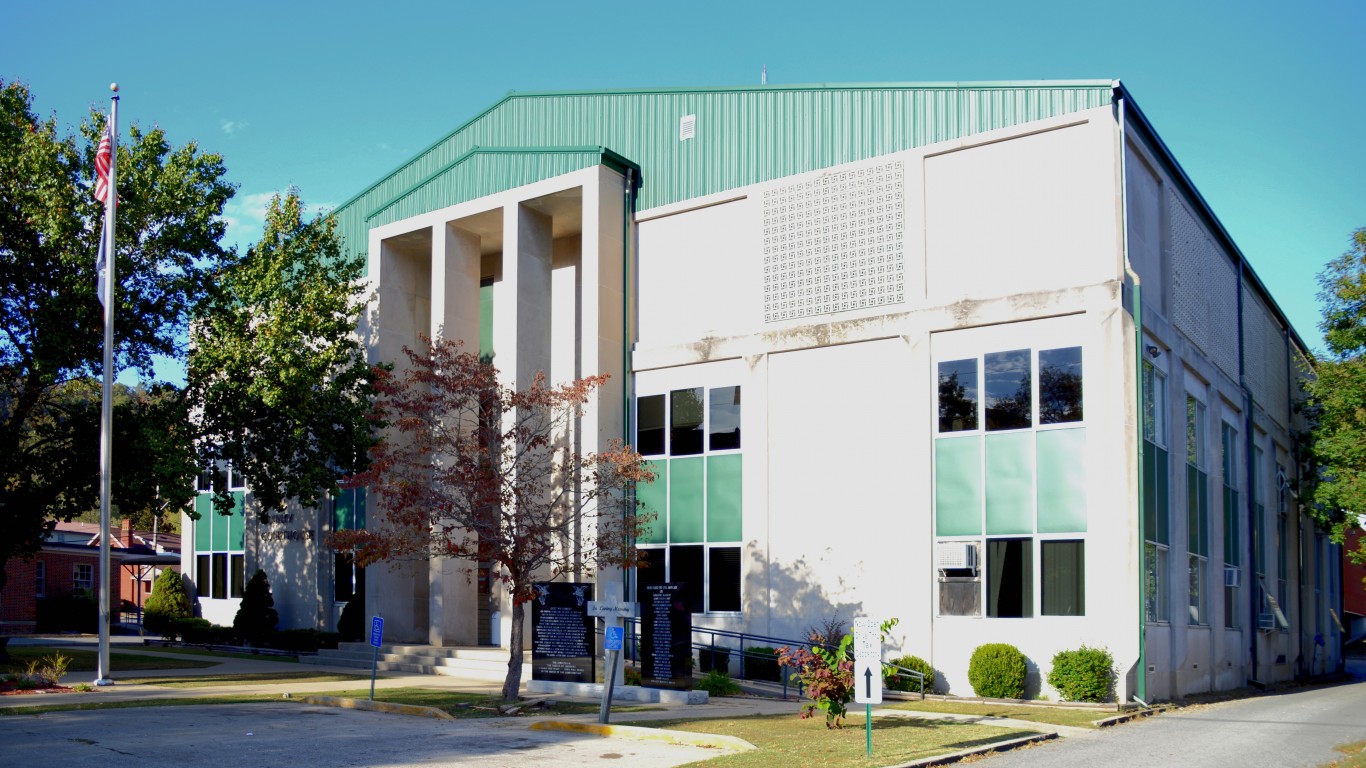
31. Floyd County, Kentucky
> Poverty rate: 29.0% (#77 of 3,142 counties)
> Adults with a bachelor’s degree: 12.6% (#2,874 of 3,142 counties)
> Life expectancy at birth: 71.0 years (#3,082 of 3,111 counties)
> Median household income: $37,360 (#2,998 of 3,142 counties)
> County seat: Prestonsburg
Floyd County, located in eastern Kentucky, is one of the worst places to live in the United States. Coal extraction has long been an economic pillar in the county, but as U.S. energy production has shifted away from coal, places in eastern Kentucky and other parts of Appalachia have suffered economically. In Floyd County, 29.0% of the population live below the poverty line, and most households earn less than $38,000 annually.
As coal mining was a way many could earn a living without a college education, relatively few in Floyd County have the education necessary for many high-paying jobs more common today. Just 12.6% of the local 25 and older population have a bachelor’s degree, well below half the comparable share of adults nationwide with a four-year degree.
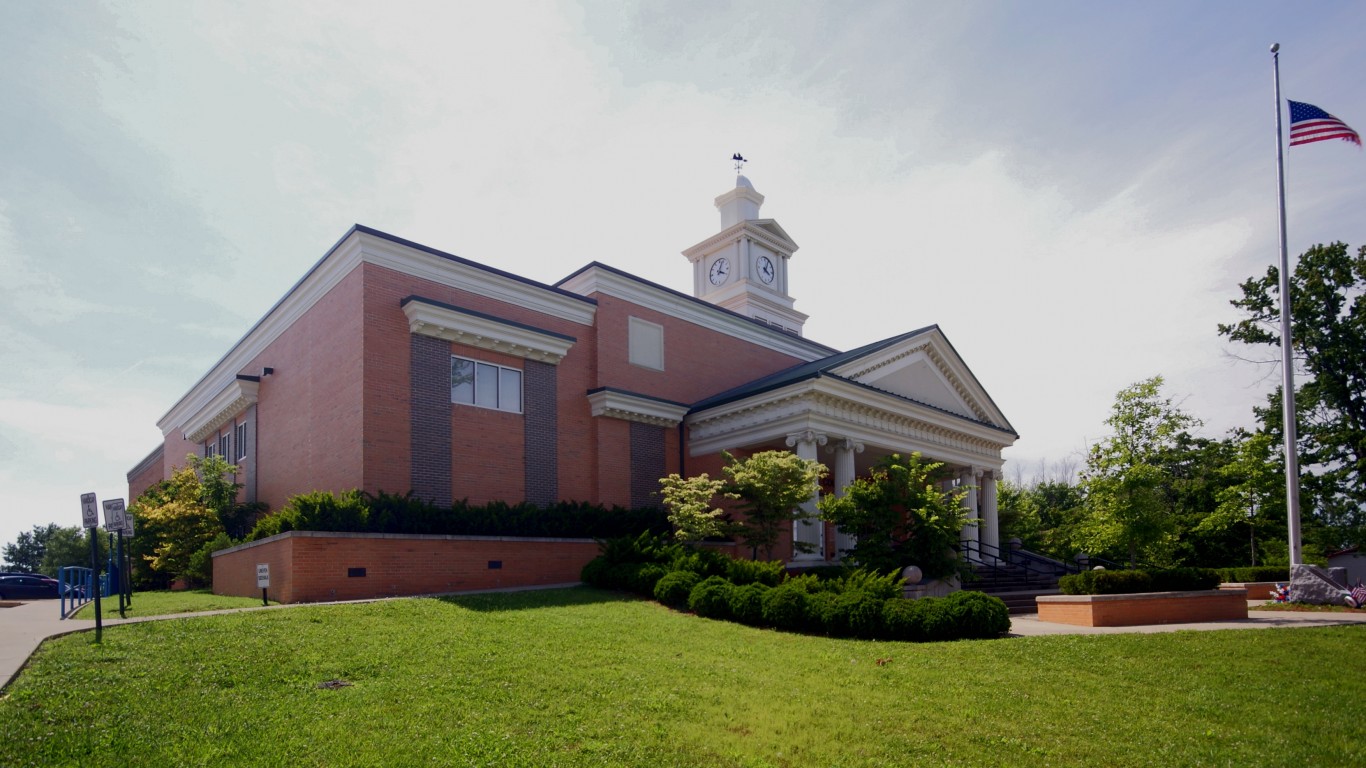
30. McCreary County, Kentucky
> Poverty rate: 30.0% (#61 of 3,142 counties)
> Adults with a bachelor’s degree: 7.0% (#3,132 of 3,142 counties)
> Life expectancy at birth: 71.9 years (#3,050 of 3,111 counties)
> Median household income: $33,939 (#3,068 of 3,142 counties)
> County seat: Whitley City
McCreary County, Kentucky, is one of many in Appalachia with economic fortunes that are closely tied to the U.S. coal industry. Coal mining jobs once offered a living wage in the region without requiring a postsecondary education, and now, as U.S. energy production continues to shift away from coal, mining jobs in and around McCreary County have all but vanished. Throughout the early and mid-20th century, over two dozen coal mines in the county employed hundreds of local residents. Even as recently as 2012, the county produced nearly 32,000 tons of coal. Now, coal production has ground to a halt in the county.
Nearly one in every three of the 17,000 people living in McCreary County live below the poverty line, and economic opportunities are limited for many in the area partly also because of the limited educational attainment in the county. Only 7.0% of area adults have a bachelor’s degree, and 78.0% have a high school diploma, well below the respective national shares of 33.7% and 88.9%.
[in-text-ad]
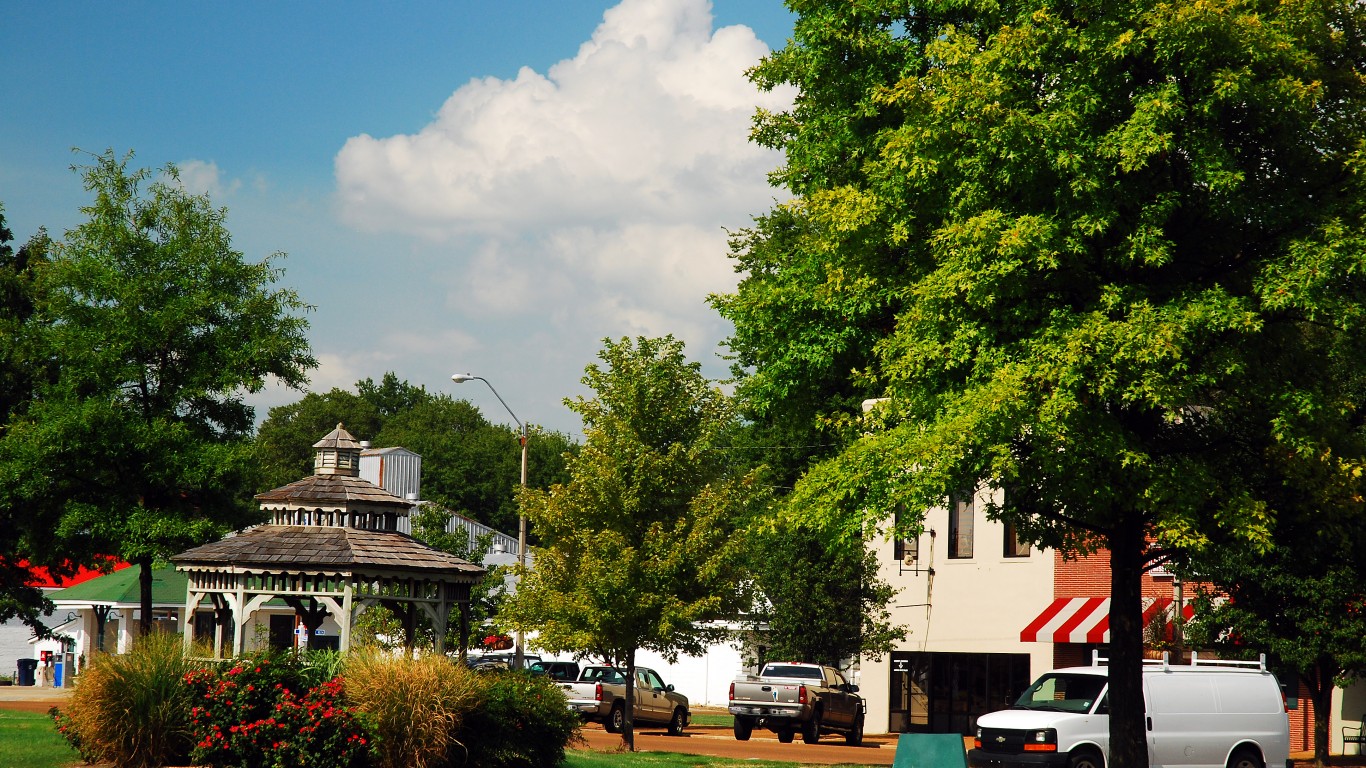
29. Tunica County, Mississippi
> Poverty rate: 32.4% (#39 of 3,142 counties)
> Adults with a bachelor’s degree: 15.8% (#2,431 of 3,142 counties)
> Life expectancy at birth: 70.9 years (#3,084 of 3,111 counties)
> Median household income: $41,176 (#2,840 of 3,142 counties)
> County seat: Tunica
Tunica County, Mississippi, ranks among the worst counties to live in largely because of widespread financial hardship. Nearly a third of the local population live below the poverty line, and the local five-year unemployment rate stands at 13.1%. Lower-income Americans typically have worse health outcomes than more financially secure populations, and in Tunica County, life expectancy at birth is just 70.9 years, well below the national average of 79.1 years.
Like most counties on this list, including each of the five Mississippi counties, Tunica County’s population has shrunk in recent years. Between 2015 and 2021, the number of people living there declined by 5%.
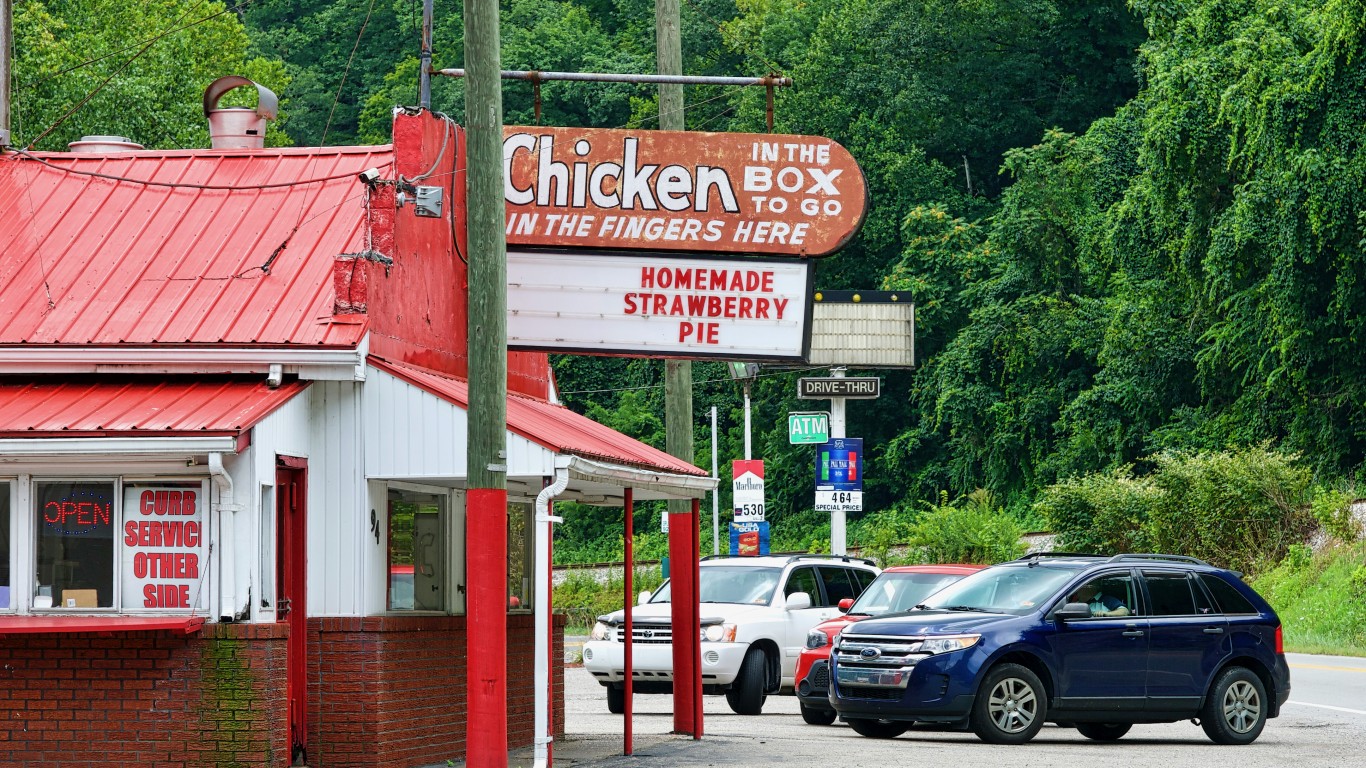
28. Logan County, West Virginia
> Poverty rate: 25.7% (#153 of 3,142 counties)
> Adults with a bachelor’s degree: 11.2% (#3,000 of 3,142 counties)
> Life expectancy at birth: 70.4 years (#3,092 of 3,111 counties)
> Median household income: $38,493 (#2,961 of 3,142 counties)
> County seat: Logan
No corner of the country has been spared by the opioid epidemic, but parts of Appalachia have been hit especially hard – particularly Logan County, West Virginia. There were 132.6 fatal drug overdoses reported for every 100,000 people in the county from 2018 to 2021, nearly five times the national overdose fatality rate of 26.8 per 100,000. Partially as a result, at just 70.4 years, life expectancy at birth in Logan County is nearly nine years below the national average.
Logan County is also an economically depressed area. Over a quarter of the local population live below the poverty line, and the local five-year unemployment rate stands at 15.8%.
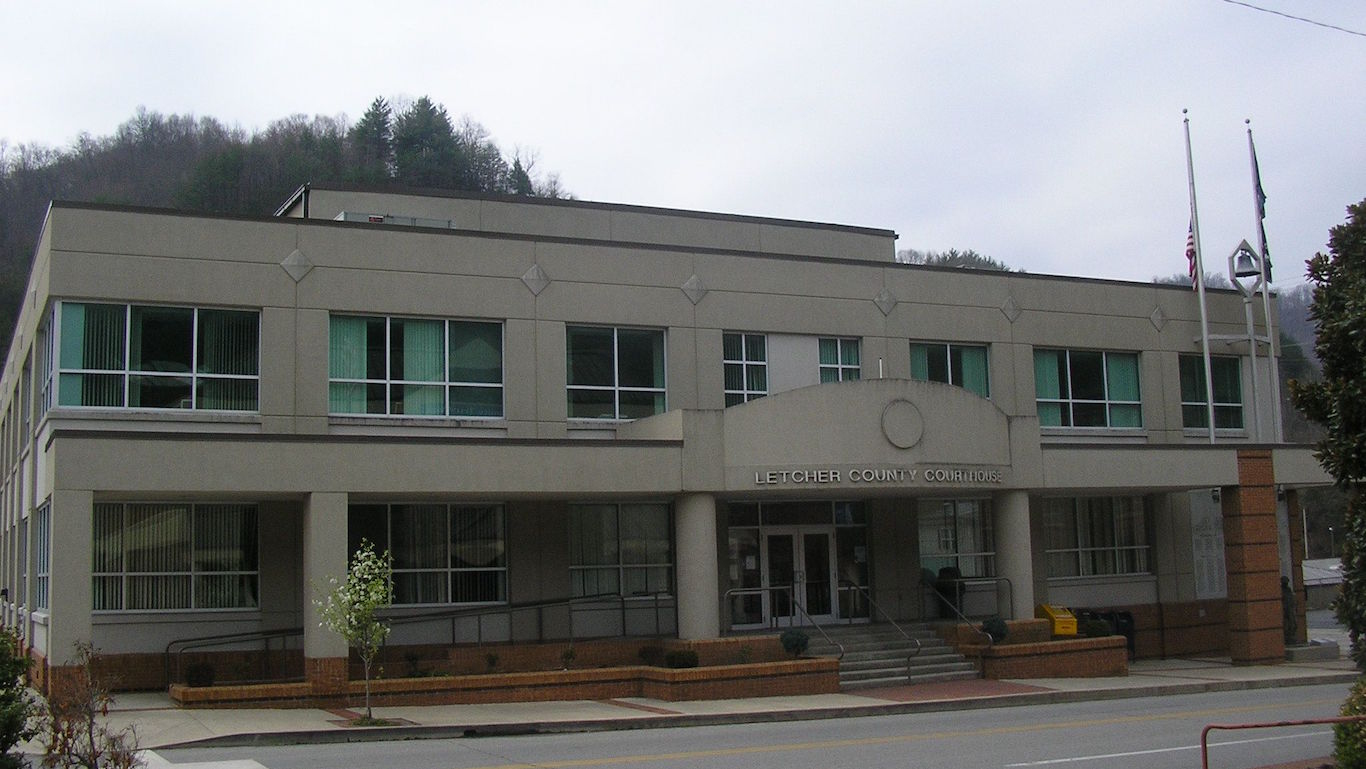
27. Letcher County, Kentucky
> Poverty rate: 31.2% (#48 of 3,142 counties)
> Adults with a bachelor’s degree: 10.3% (#3,065 of 3,142 counties)
> Life expectancy at birth: 71.4 years (#3,073 of 3,111 counties)
> Median household income: $35,278 (#3,044 of 3,142 counties)
> County seat: Whitesburg
Letcher County, Kentucky, is one of several counties in the state’s eastern coalfield region to rank among the worst places to live in the United States. As is the case in other nearby counties, many in Letcher County are struggling financially. Nearly a third of the population live below the poverty line, and over half of all area households earn less than $36,000 a year, making the county one of the poorest in the United States.
Incomes tend to rise with educational attainment, and in Letcher County, only 10.3% of adults have a bachelor’s degree, and 77.0% have a high school diploma – well below the comparable national shares of 33.7% and 88.9%, respectively. Job opportunities are limited as well in the area, as the local five-year average unemployment rate stands at 10%.
[in-text-ad-2]
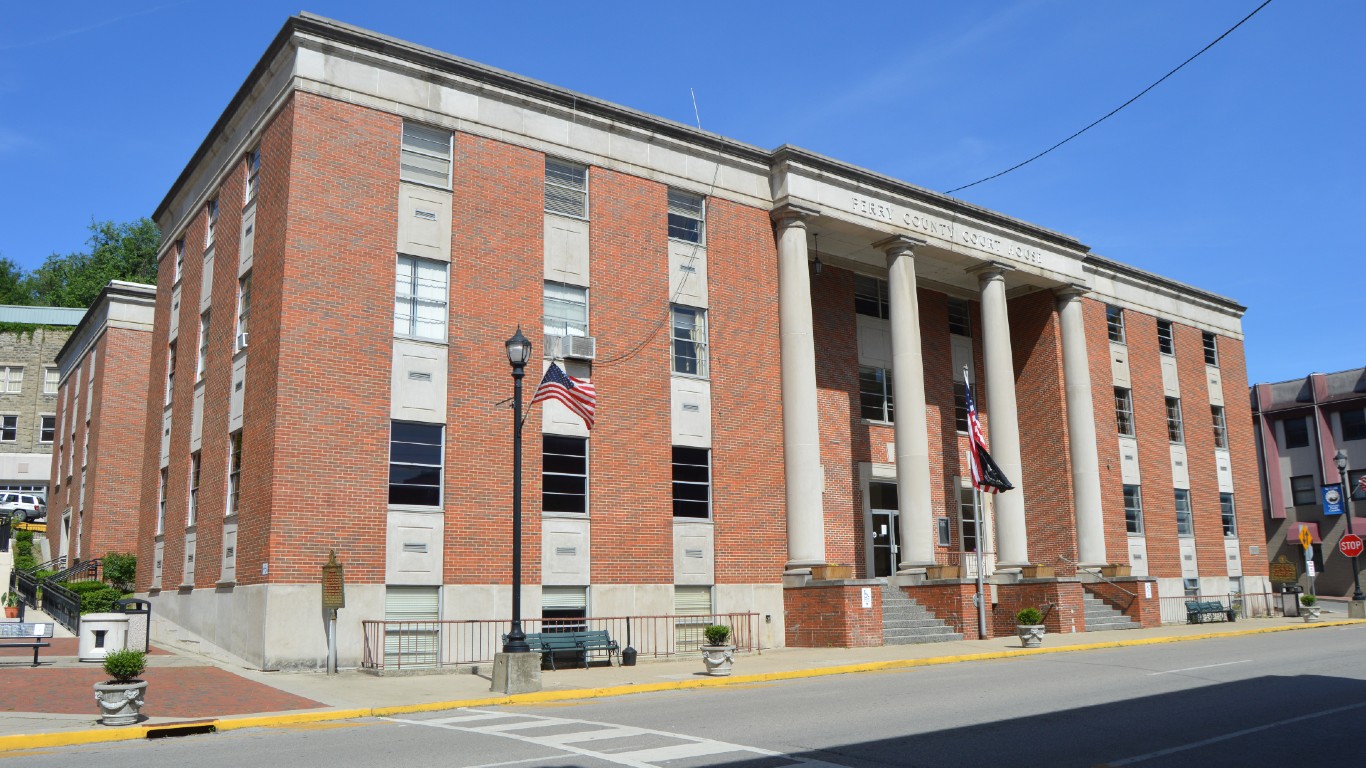
26. Perry County, Kentucky
> Poverty rate: 21.5% (#374 of 3,142 counties)
> Adults with a bachelor’s degree: 14.0% (#2,711 of 3,142 counties)
> Life expectancy at birth: 69.1 years (#3,103 of 3,111 counties)
> Median household income: $40,577 (#2,873 of 3,142 counties)
> County seat: Hazard
Perry is one of a dozen Kentucky counties to rank on this list, and like most of them, it is located in the state’s eastern coalfield region. Kentucky’s coal production has fallen steeply in recent years, and places with economies built around resource extraction, like Perry County, have suffered. The average five-year jobless rate in the county stands at 10.6%, and more than one in every four local residents live below the poverty line.
Like many parts of Appalachia, Perry County has been devastated by the opioid epidemic. There were 70.3 drug overdose deaths for every 100,000 people in the county from 2018 to 2021, more than double the national rate and one of the highest of any U.S. county. Partially as a result, life expectancy at birth in Perry County is only 69.1 years, a decade below the national average.
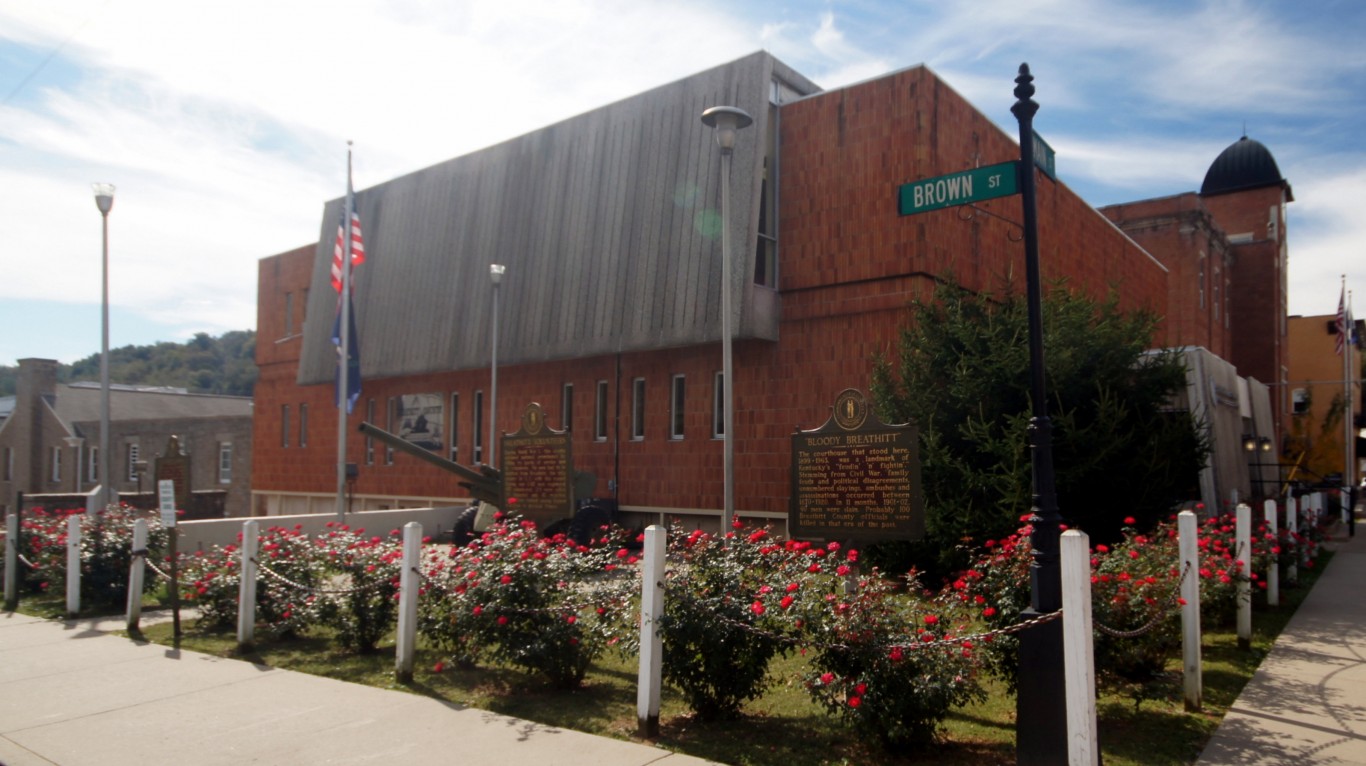
25. Breathitt County, Kentucky
> Poverty rate: 31.3% (#46 of 3,142 counties)
> Adults with a bachelor’s degree: 16.9% (#2,227 of 3,142 counties)
> Life expectancy at birth: 70.3 years (#3,094 of 3,111 counties)
> Median household income: $32,259 (#3,096 of 3,142 counties)
> County seat: Jackson
Breathitt County, Kentucky, is one of the worst places to live in the United States largely because of the relatively poor health outcomes in the area. The county is located in the state’s eastern coalfield region in the Appalachian Mountains, and average life expectancy at birth there is just 70.3 years, nearly nine years below the national average. As is the case in much of Appalachia, Breathitt County has been severely affected by the opioid epidemic. There were 50.5 overdose deaths for every 100,000 people in the county between 2018 and 2021, compared to 26.8 per 100,000 nationwide.
Poor health outcomes are also due to widespread financial hardship. The local poverty rate in Breathitt County stands at 31.3% — more than double the 12.6% national poverty rate.
[in-text-ad]
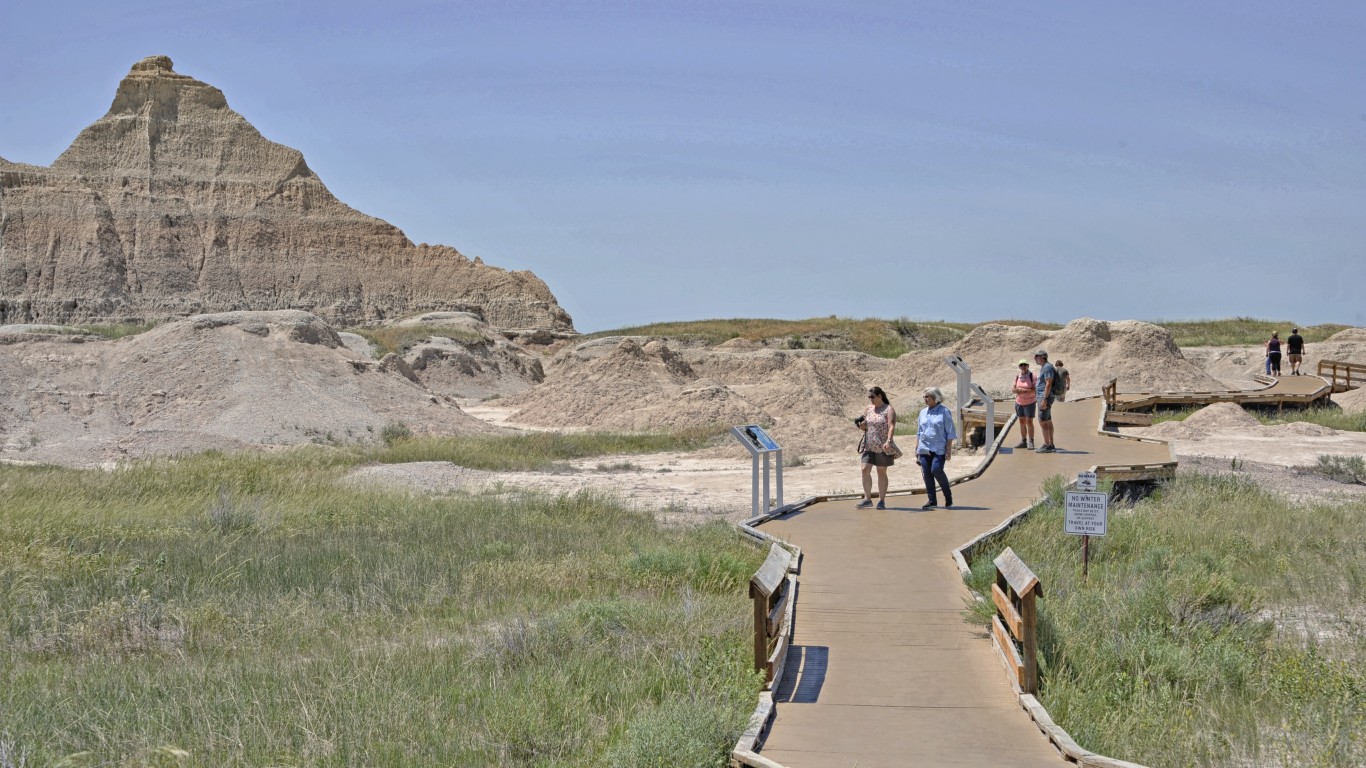
24. Jackson County, South Dakota
> Poverty rate: 44.4% (#7 of 3,142 counties)
> Adults with a bachelor’s degree: 14.2% (#2,683 of 3,142 counties)
> Life expectancy at birth: 72.8 years (#2,995 of 3,111 counties)
> Median household income: $25,357 (#3,135 of 3,142 counties)
> County seat: Kadoka
Covering part of the Pine Ridge Indian Reservation in South Dakota, Jackson County is one of several counties to rank among the worst places to live that encompass tribal territory. Due to a number of historical and contemporary factors, Native American reservations are typically economically depressed areas — and Jackson County is no exception. Nearly 45% of the local population live below the poverty line, a larger share than in all but six other counties and county equivalents nationwide.
Health outcomes among county residents are worse than they are in much of the rest of the country. This is especially pronounced in some critical measures like average life expectancy, which at just 72.8 years at birth is over six years below the national average.
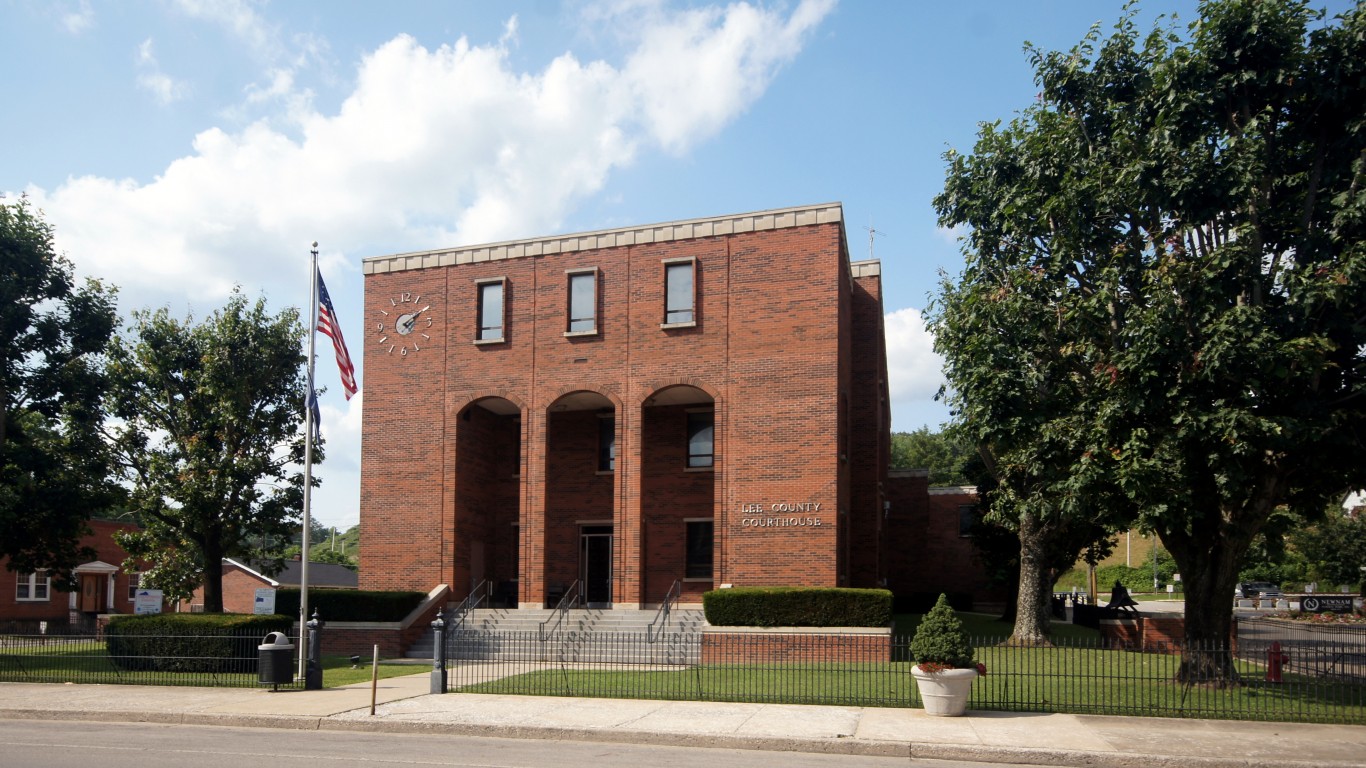
23. Lee County, Kentucky
> Poverty rate: 30.0% (#64 of 3,142 counties)
> Adults with a bachelor’s degree: 7.9% (#3,127 of 3,142 counties)
> Life expectancy at birth: 71.2 years (#3,076 of 3,111 counties)
> Median household income: $29,817 (#3,116 of 3,142 counties)
> County seat: Beattyville
Lee County, Kentucky, is located in the state’s Eastern Coalfield region. Like many coal-producing regions of the United States, Lee County is struggling with severe economic and public health problems. For example, 30% of the local population live below the poverty line, and most households earn less than $30,000 a year.
Lee County has been severely affected by the opioid epidemic. There were 96 drug overdose deaths for every 100,000 people in the county between 2018 and 2021, more than triple the national rate of 26.8 deaths per 100,000 people. Partially as a result, life expectancy is only 71.2 years in the county, about eight years below the national average.
22. Mingo County, West Virginia
> Poverty rate: 28.2% (#90 of 3,142 counties)
> Adults with a bachelor’s degree: 9.0% (#3,112 of 3,142 counties)
> Life expectancy at birth: 70.7 years (#3,088 of 3,111 counties)
> Median household income: $35,349 (#3,042 of 3,142 counties)
> County seat: Williamson
In Mingo County, located in southwestern West Virginia, fewer than one in every 10 adults have a bachelor’s degree, less than one-third of the comparable share nationwide. Incomes tend to rise with educational attainment, and 28.2% of the nearly 24,000 people in the county live below the poverty line.
Mingo County has been hit especially hard by the social and economic problems much of the country is currently grappling with. The five-year average unemployment in the area stands at 11.3%, and few places have been affected more than Mingo County by the opioid crisis. There were 84.8 drug overdose deaths in the county for every 100,000 people between 2018 and 2021, more than triple the national overdose fatality rate.
[in-text-ad-2]
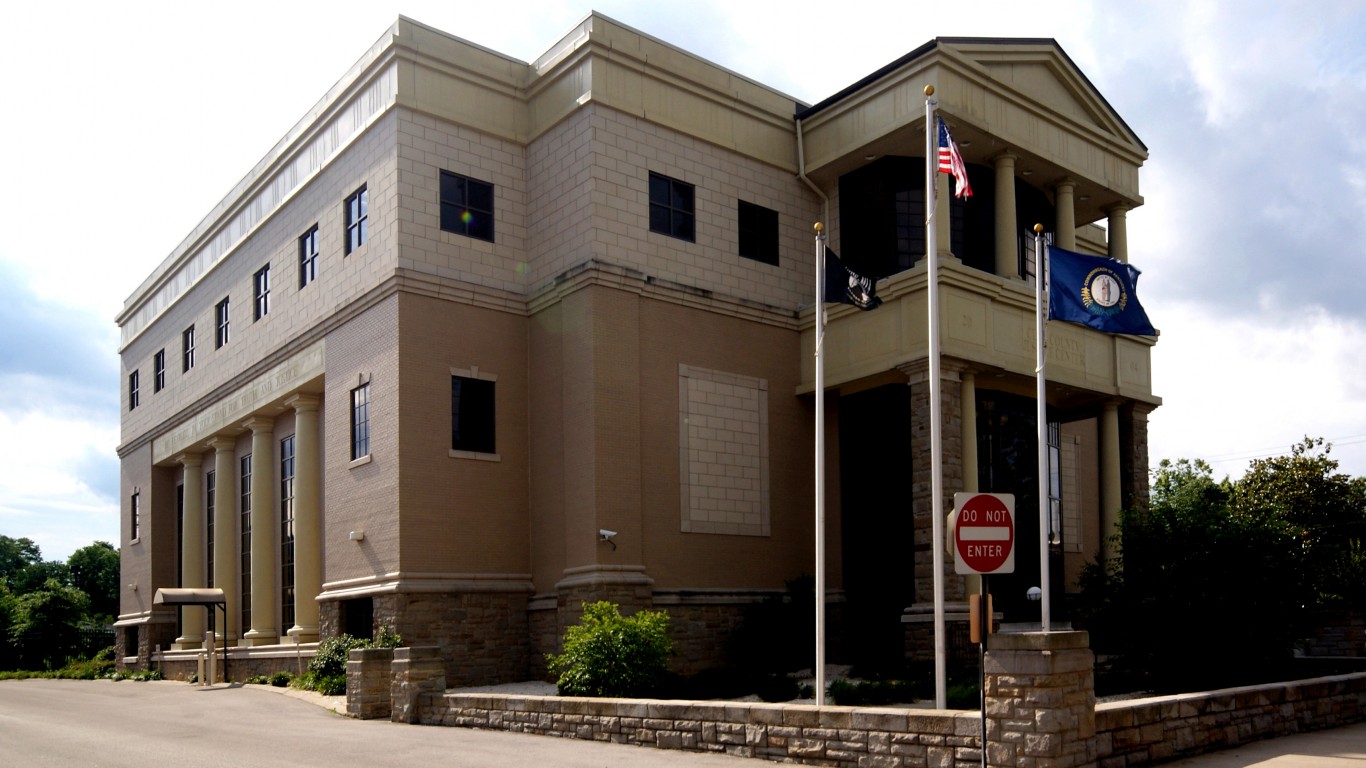
21. Clay County, Kentucky
> Poverty rate: 33.6% (#35 of 3,142 counties)
> Adults with a bachelor’s degree: 11.5% (#2,979 of 3,142 counties)
> Life expectancy at birth: 71.1 years (#3,077 of 3,111 counties)
> Median household income: $33,399 (#3,079 of 3,142 counties)
> County seat: Manchester
Clay County, Kentucky, borders four other counties in the state that also rank among the worst places to live in the United States. As is the case in some of its neighboring counties in Kentucky’s eastern coalfield region, adults in Clay are far less likely than most Americans to have a college education. Just 11.5% of area residents 25 and older have a bachelor’s degree or higher compared to 33.7% of adults nationwide.
Adults who have completed college have greater access to economic opportunities and are more likely to have a healthier lifestyle. In Clay County, 33.6% of the population live in poverty, and life expectancy at birth is just 71.1 years — compared to the 12.6% national poverty rate and the 79.1 year average national life expectancy.
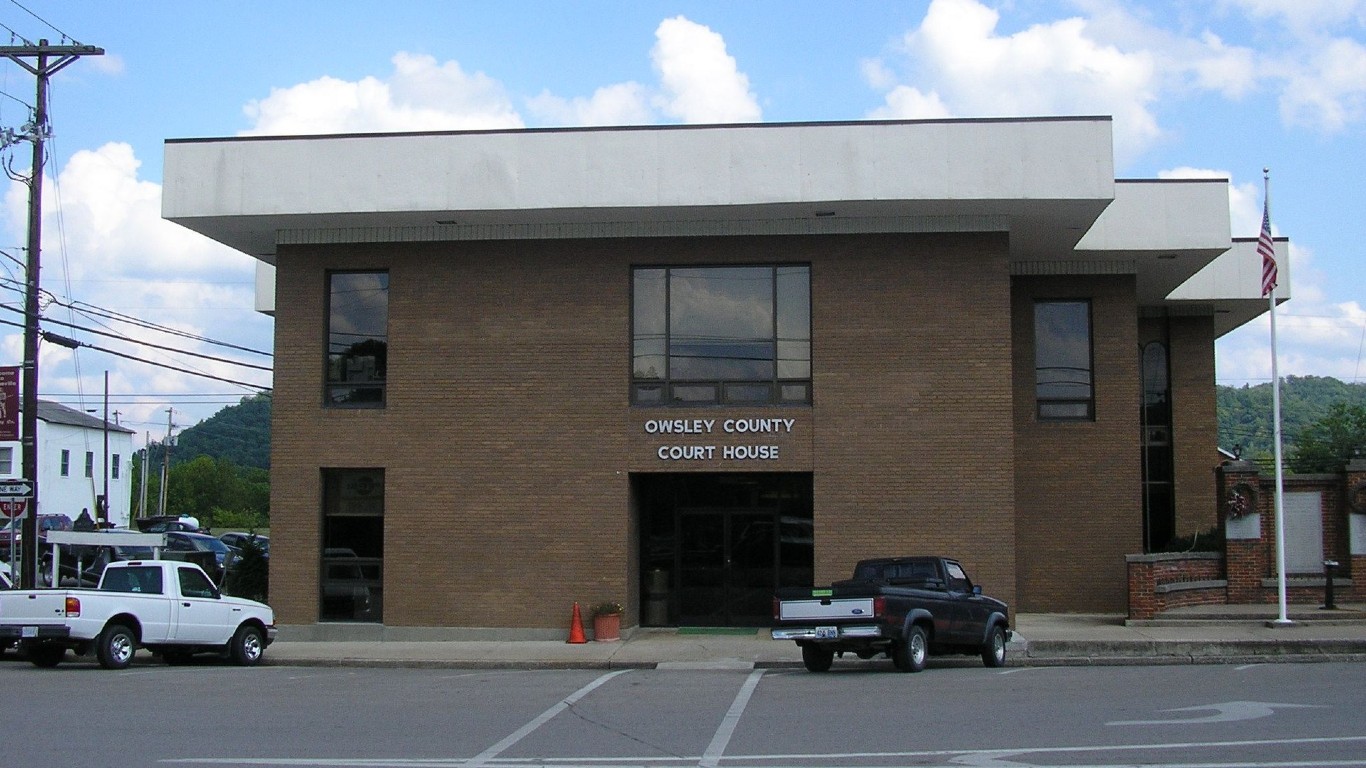
20. Owsley County, Kentucky
> Poverty rate: 27.7% (#102 of 3,142 counties)
> Adults with a bachelor’s degree: 11.5% (#2,974 of 3,142 counties)
> Life expectancy at birth: 70.1 years (#3,097 of 3,111 counties)
> Median household income: $29,340 (#3,120 of 3,142 counties)
> County seat: Booneville
Owsley County, Kentucky, which includes the city of Booneville, ranks as one of the worst places to live in the United States largely because of poor health outcomes. Life expectancy at birth in the county is just 70.1 years, nine years below the national average. Americans living below the poverty line are more likely to report poor health outcomes — and in Owsley County, 27.7% residents do.
The local poverty rate would likely decline with an improved job market. Over the last five years, an average of 15.7% of the area’s labor force were unemployed. The worse than average health outcomes are also due in part to the opioid epidemic – which has hit the region especially hard. There were 75.7 drug overdose deaths in the county for every 100,000 people between 2018 and 2021, nearly triple the national overdose fatality rate.
[in-text-ad]
19. Martinsville, Virginia
> Poverty rate: 25.4% (#173 of 3,142 counties)
> Adults with a bachelor’s degree: 22.1% (#1,350 of 3,142 counties)
> Life expectancy at birth: 67.9 years (#3,107 of 3,111 counties)
> Median household income: $36,832 (#3,009 of 3,142 counties)
> County seat: N/A
Of the 134 counties and county equivalents in Virginia, the independent city of Martinsville, located just above the North Carolina border, is the only one to rank on this list. More than one in every four Martinsville residents live below the poverty line, and at just 67.9 years, average life expectancy at birth in the city is over a decade below the U.S. average.
As is often the case in places with similarly poor socioeconomic conditions, Martinsville is losing residents faster than it is drawing them in. Between 2015 and 2021, the number of people living there fell by 1.1%, even as Virginia’s population expanded by 3.9%.
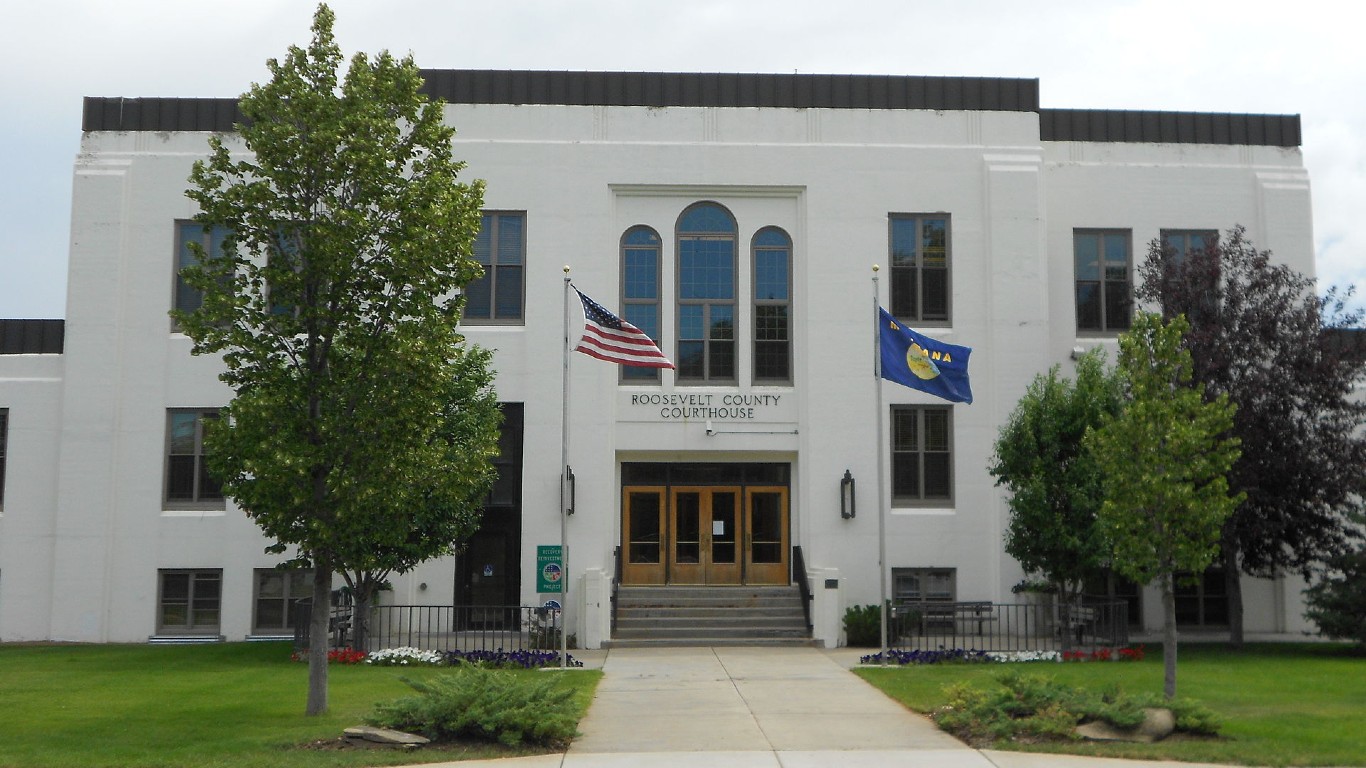
18. Roosevelt County, Montana
> Poverty rate: 32.3% (#40 of 3,142 counties)
> Adults with a bachelor’s degree: 19.4% (#1,765 of 3,142 counties)
> Life expectancy at birth: 69.5 years (#3,100 of 3,111 counties)
> Median household income: $47,182 (#2,426 of 3,142 counties)
> County seat: Wolf Point
Roosevelt County is located near the northeast corner of Montana, largely within the Fort Peck Indian Reservation. Due to a number of historical and contemporary factors, many Native American reservations are among the poorest communities in the United States — and Roosevelt is no exception. An estimated 32.3% of the population live below the poverty line, more than double the national poverty rate of 12.6%.
Health outcomes in the county are also far worse than average in the county. Life expectancy at birth in Roosevelt is just 69.5 years, making it one of only 14 U.S. counties and county equivalents where average life expectancy is below 70 years.

17. Coahoma County, Mississippi
> Poverty rate: 37.5% (#12 of 3,142 counties)
> Adults with a bachelor’s degree: 18.4% (#1,949 of 3,142 counties)
> Life expectancy at birth: 70.2 years (#3,095 of 3,111 counties)
> Median household income: $31,312 (#3,109 of 3,142 counties)
> County seat: Clarksdale
Coahoma County, located in Mississippi’s Delta region, is one of the worst places to live in the country largely because of widespread poverty. Nearly 38% of the area’s 21,800 residents live below the poverty line, and most households earn less than $32,000 a year.
Limited job availability partially explains the widespread poverty in Coahoma County. Over the last five years, an average of 9.5% of the area’s labor force were unemployed. Americans with low levels of financial security are more likely to experience negative health outcomes than wealthier Americans, and in Coahoma, average life expectancy at birth is just 70.2 years, about nine years below the national average.
[in-text-ad-2]
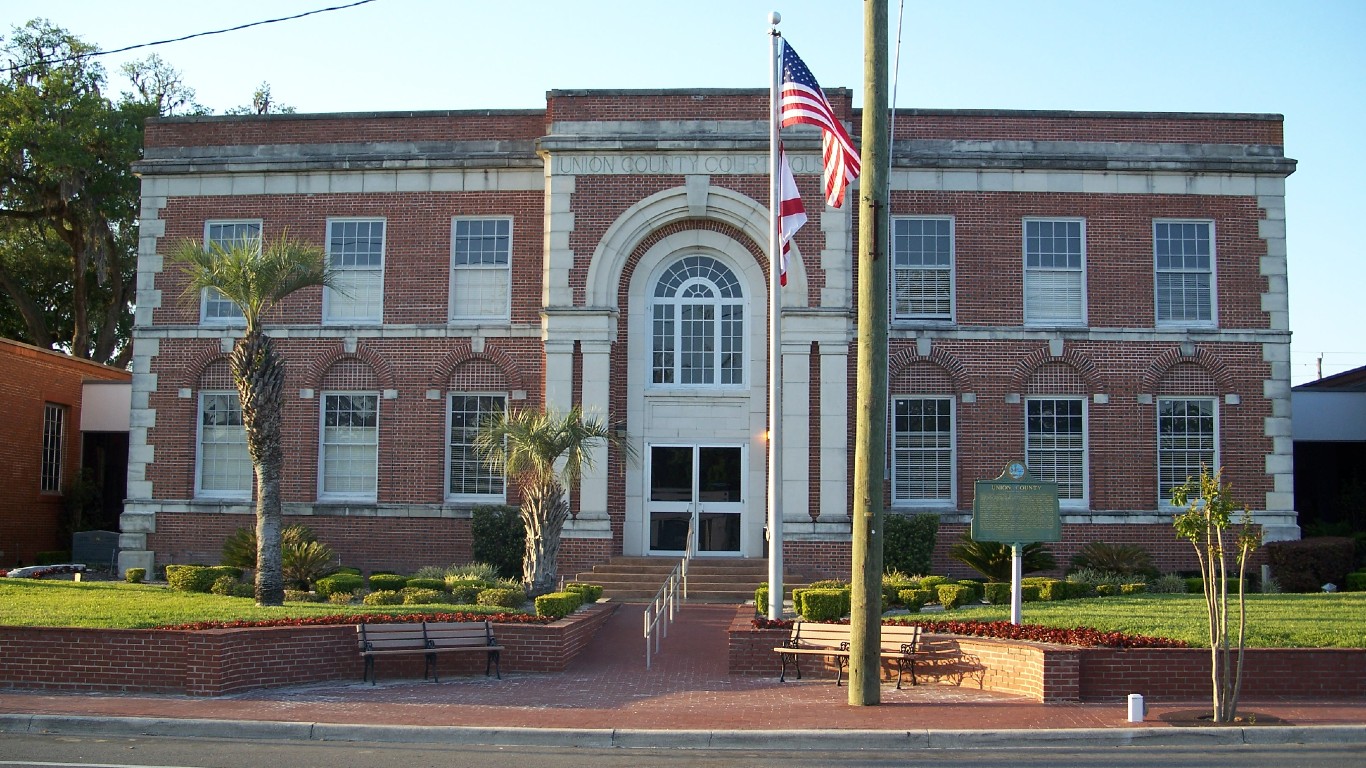
16. Union County, Florida
> Poverty rate: 17.0% (#870 of 3,142 counties)
> Adults with a bachelor’s degree: 11.0% (#3,016 of 3,142 counties)
> Life expectancy at birth: 67.7 years (#3,108 of 3,111 counties)
> Median household income: $55,463 (#1,626 of 3,142 counties)
> County seat: Lake Butler
Union County is located in the central part of Florida, just north of Gainesville. At just 67.7 years, Union is the only county in Florida with a life expectancy below 70 years. The low average life expectancy is due in part to a high rate of drug deaths. There were 37.3 fatal drug overdoses for every 100,000 people in the county between 2018 and 2021, one of the higher overdose death rates of any of Florida’s 67 counties, and well above the national rate of 26.8 per 100,000.
Health outcomes tend to improve with educational attainment, and in Union County, only 11.0% of adults have a bachelor’s degree, compared to 33.7% of adults across the country.
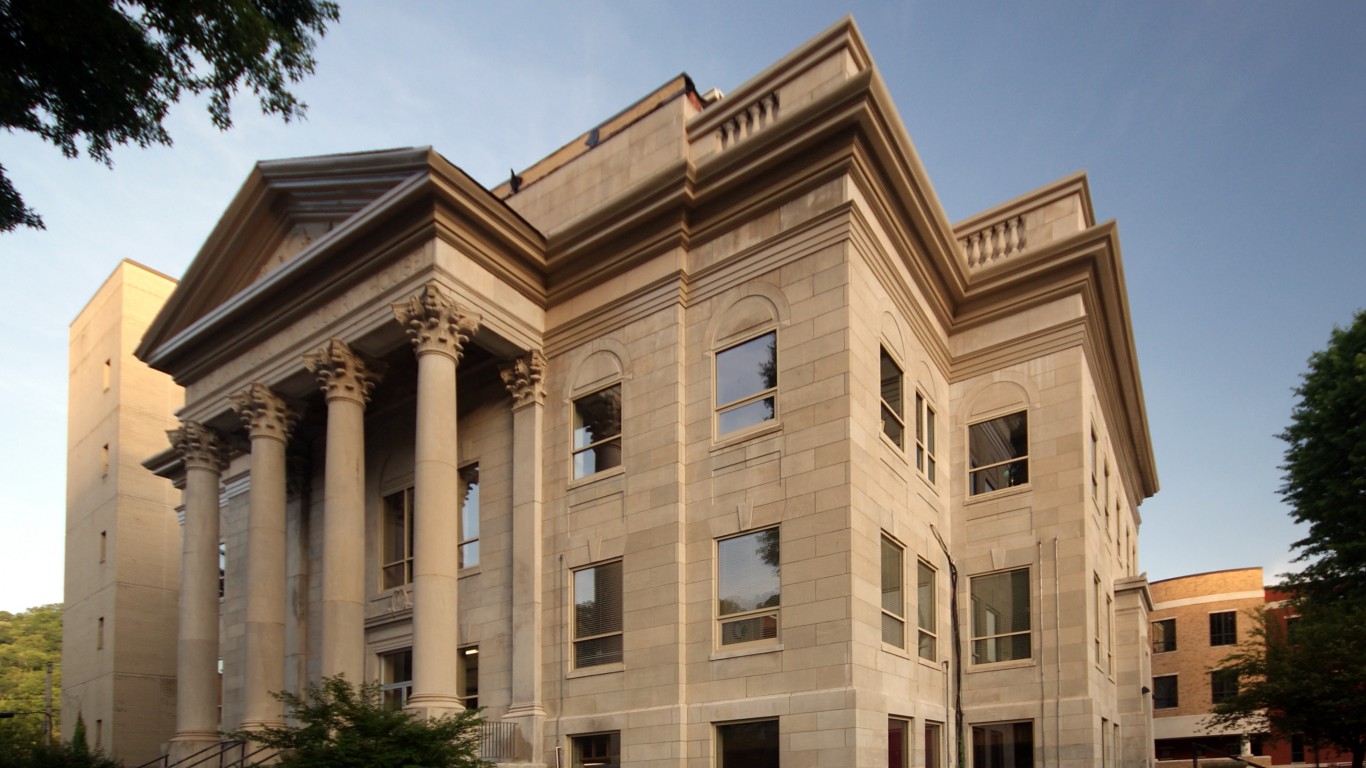
15. Harlan County, Kentucky
> Poverty rate: 33.6% (#34 of 3,142 counties)
> Adults with a bachelor’s degree: 9.5% (#3,096 of 3,142 counties)
> Life expectancy at birth: 70.6 years (#3,089 of 3,111 counties)
> Median household income: $30,210 (#3,113 of 3,142 counties)
> County seat: Harlan
Harlan County, Kentucky, located in the state’s eastern coalfield region, is one of the worst places to live in the United States largely due to widespread poverty. An estimated 33.6% of local residents live below the poverty line, and most households earn less than $31,000 a year. Coal production has dropped substantially in Kentucky in recent years, and like many coal-producing counties in the state, Harlan County’s economy is suffering. Over the last five years, unemployment has averaged 12.6% in the area.
At just 70.6 years, life expectancy at birth in the county is nearly nine years below the national average. This is attributable in part to the toll the opioid epidemic is taking on the local population. There were 50.9 drug overdose deaths for every 100,000 people in the county from 2018 to 2021, compared to 26.8 per 100,000 nationwide.
[in-text-ad]
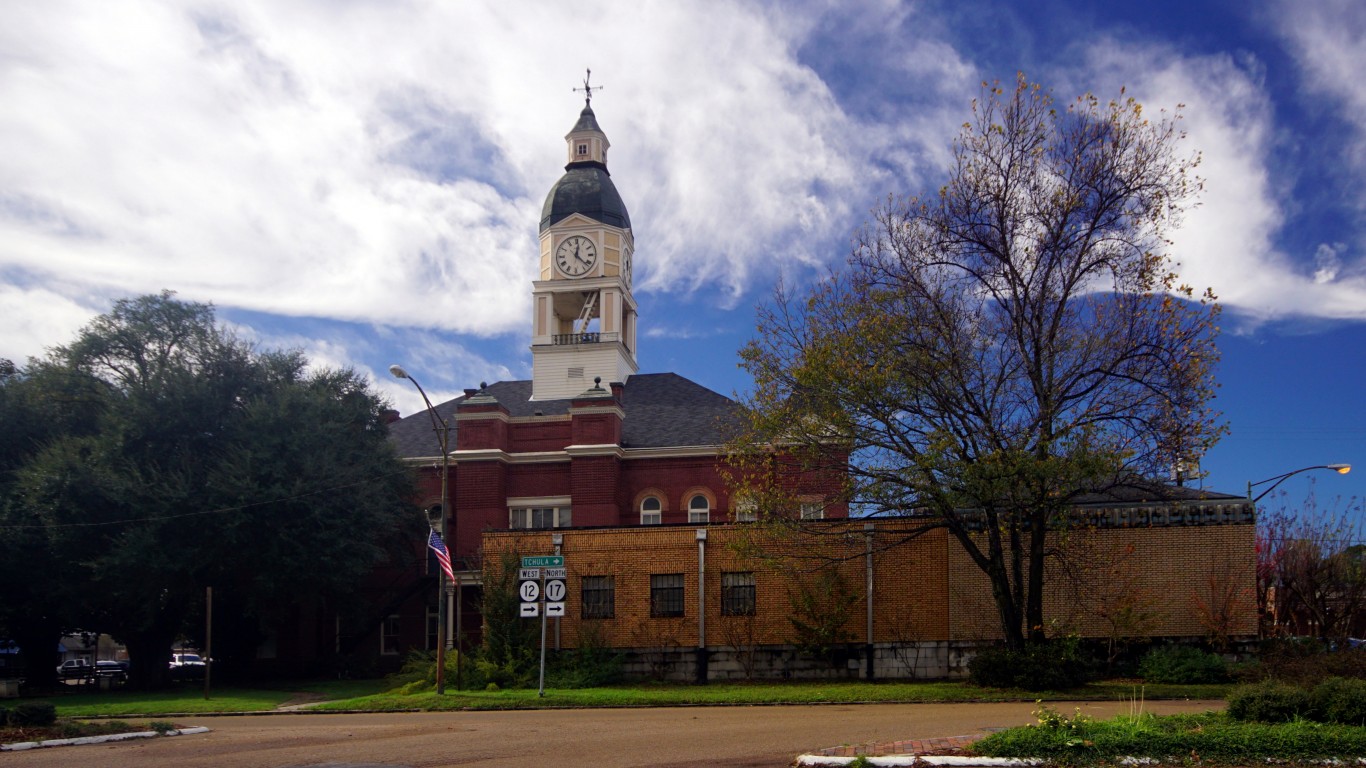
14. Holmes County, Mississippi
> Poverty rate: 39.2% (#10 of 3,142 counties)
> Adults with a bachelor’s degree: 12.7% (#2,865 of 3,142 counties)
> Life expectancy at birth: 71.0 years (#3,081 of 3,111 counties)
> Median household income: $24,958 (#3,138 of 3,142 counties)
> County seat: Lexington
Holmes County is located in western Mississippi with the Yazoo River running along its western border and the Big Black River forming its eastern border. Fewer than 13% of adults in the area have a four-year college degree, and only about 78% adults have completed high school.
Incomes tend to go up with educational attainment, and in Holmes County, many are struggling financially. Over half of all area households earn less than $25,000 a year, and 39.2% of the population live below the poverty line, making the county among the poorest in the United States. Additionally, an average of 12.8% of the local labor force were unemployed in the last five years, and limited economic opportunity may be pushing people out. Between 2015 and 2021, the Holmes County population contracted by 8.1%.
13. Quitman County, Mississippi
> Poverty rate: 34.8% (#24 of 3,142 counties)
> Adults with a bachelor’s degree: 11.2% (#2,998 of 3,142 counties)
> Life expectancy at birth: 70.5 years (#3,090 of 3,111 counties)
> Median household income: $25,783 (#3,134 of 3,142 counties)
> County seat: Marks
Of the five Mississippi counties on this list, Quitman County ranks as the worst place to live. One of the poorest places in the United States, Quitman has a poverty rate of 34.8% – more than double the national rate – and a median household income of just $25,783 – less than half the national median.
Poverty can have a negative impact on health outcomes, including life expectancy, as poorer Americans often struggle to afford health care and healthy lifestyle choices. Partially as a result, life expectancy at birth in Quitman County is just 70.5 years, well below the 74.7 year average life expectancy statewide and 79.1 year average nationwide.
12. Dewey County, South Dakota
> Poverty rate: 35.1% (#21 of 3,142 counties)
> Adults with a bachelor’s degree: 17.1% (#2,193 of 3,142 counties)
> Life expectancy at birth: 69.5 years (#3,101 of 3,111 counties)
> Median household income: $46,087 (#2,517 of 3,142 counties)
> County seat: Timber Lake
Dewey County, South Dakota, which lies within the Cheyenne River Reservation, ranks as one of the worst places to live in the United States. For a variety of historical and contemporary reasons, Native American populations are among the most disadvantaged groups in the United States. In Dewey County, over 35% of the population live below the poverty line, and the average life expectancy at birth is less than 70 years.
As is common in many places on this list, job opportunities are limited in Dewey County, as an average of 18.8% of the local labor force were unemployed in the last five years.
[in-text-ad-2]
11. Leslie County, Kentucky
> Poverty rate: 34.6% (#27 of 3,142 counties)
> Adults with a bachelor’s degree: 9.2% (#3,104 of 3,142 counties)
> Life expectancy at birth: 70.4 years (#3,091 of 3,111 counties)
> Median household income: $34,528 (#3,056 of 3,142 counties)
> County seat: Hyden
Many counties in Kentucky’s Eastern Coalfield Region rank among the worst places to live in the United States, but of them, Leslie County is the worst. Like many other coal-producing regions of the United States, Leslie County is struggling economically. In the last five years, an average of 7.4% of the local labor force were unemployed, well above the comparable 5.5% national unemployment rate. With limited economic opportunity, 34.6% of the population live below the poverty line, compared to the 12.6% national poverty rate.
Employment opportunities typically rise with educational attainment, and in the county, fewer than one in every 10 adults have a bachelor’s degree. Nationwide, over a third of the adult population do.
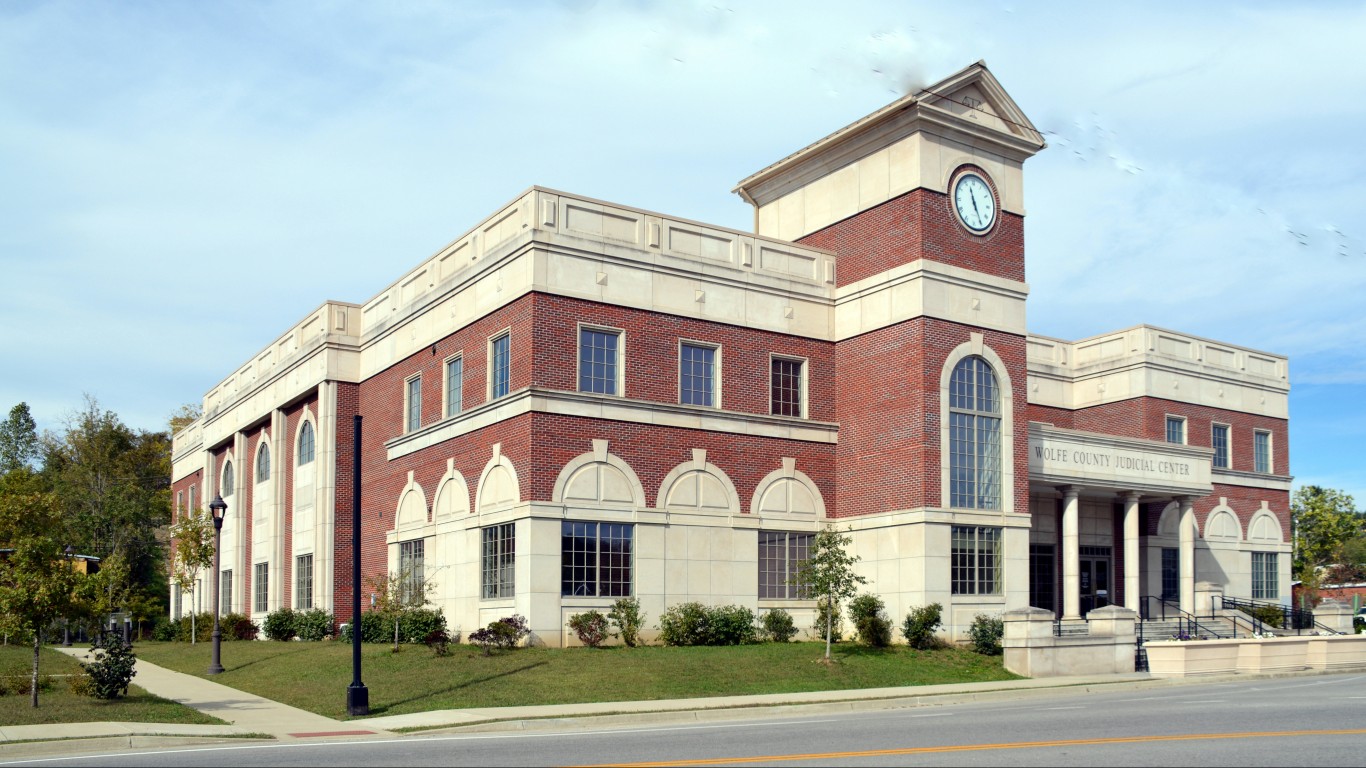
10. Wolfe County, Kentucky
> Poverty rate: 34.6% (#26 of 3,142 counties)
> Adults with a bachelor’s degree: 6.6% (#3,135 of 3,142 counties)
> Life expectancy at birth: 70.4 years (#3,093 of 3,111 counties)
> Median household income: $24,349 (#3,139 of 3,142 counties)
> County seat: Campton
Of the 12 Kentucky counties on this list, Wolfe County ranks as the worst place to live. Only 6.6% of adults in the area have a bachelor’s degree, compared to 33.7% of adults nationwide. Both on an individual basis and across broad populations, incomes and financial security tend to rise with educational attainment. In Wolfe County, 34.6% of the population live below the poverty line, making the county one of the poorest in the United States. The high local poverty rate is also attributable to limited opportunity, as the county’s five-year average unemployment rate stands at 26.7% – nearly five times the comparable national rate.
Like many U.S. counties lagging in key socioeconomic indicators, Wolfe County’s population is shrinking. Between 2015 and 2021, the number of people living there fell by 8.2%, even as Kentucky’s population expanded by 2.2%.
[in-text-ad]
9. McDowell County, West Virginia
> Poverty rate: 28.9% (#78 of 3,142 counties)
> Adults with a bachelor’s degree: 6.4% (#3,137 of 3,142 counties)
> Life expectancy at birth: 69.0 years (#3,104 of 3,111 counties)
> Median household income: $30,127 (#3,115 of 3,142 counties)
> County seat: Welch
McDowell County was the largest coal-producing county in the United States in the early to mid 20th century. Like many coal-producing regions, it has suffered from long-term economic decline and now ranks as the worst of West Virginia’s 55 counties to live in. Since 2015, the local population has contracted by 7.1%, and in the last five years, an average of 13.5% of the labor force were unemployed. The local poverty rate of 28.9% is well above the 12.6% U.S. poverty rate.
Like many parts of Appalachia, McDowell County has been devastated by the opioid epidemic. There were 132.2 drug overdose deaths for every 100,000 people in the county from 2018 to 2021, nearly five times the national rate and one of the highest of any U.S. county. Partially as a result, life expectancy at birth in McDowell County is only 69 years, a decade below the national average.
8. East Carroll Parish, Louisiana
> Poverty rate: 47.3% (#4 of 3,142 counties)
> Adults with a bachelor’s degree: 10.2% (#3,069 of 3,142 counties)
> Life expectancy at birth: 71.5 years (#3,070 of 3,111 counties)
> Median household income: $25,049 (#3,136 of 3,142 counties)
> County seat: Lake Providence
East Carroll is the worst parish to live in Louisiana and is one of the poorest counties or county equivalents in the United States. An estimated 47.3% of the local population live below the poverty line, nearly four times the 12.6% U.S. poverty rate. Additionally, most local households earn less than $26,000 a year. Incomes tend to rise with educational attainment, and in East Carroll Parish, only one in every 10 adults have a bachelor’s degree, and fewer than two-thirds have a high school diploma.
Poverty can have a negative impact on health outcomes, including life expectancy, as poorer Americans often struggle to afford health care and healthy lifestyle choices. Partially as a result, life expectancy at birth in the parish is more than four years shorter than the state average and nearly eight years below the 79.1 years national average.
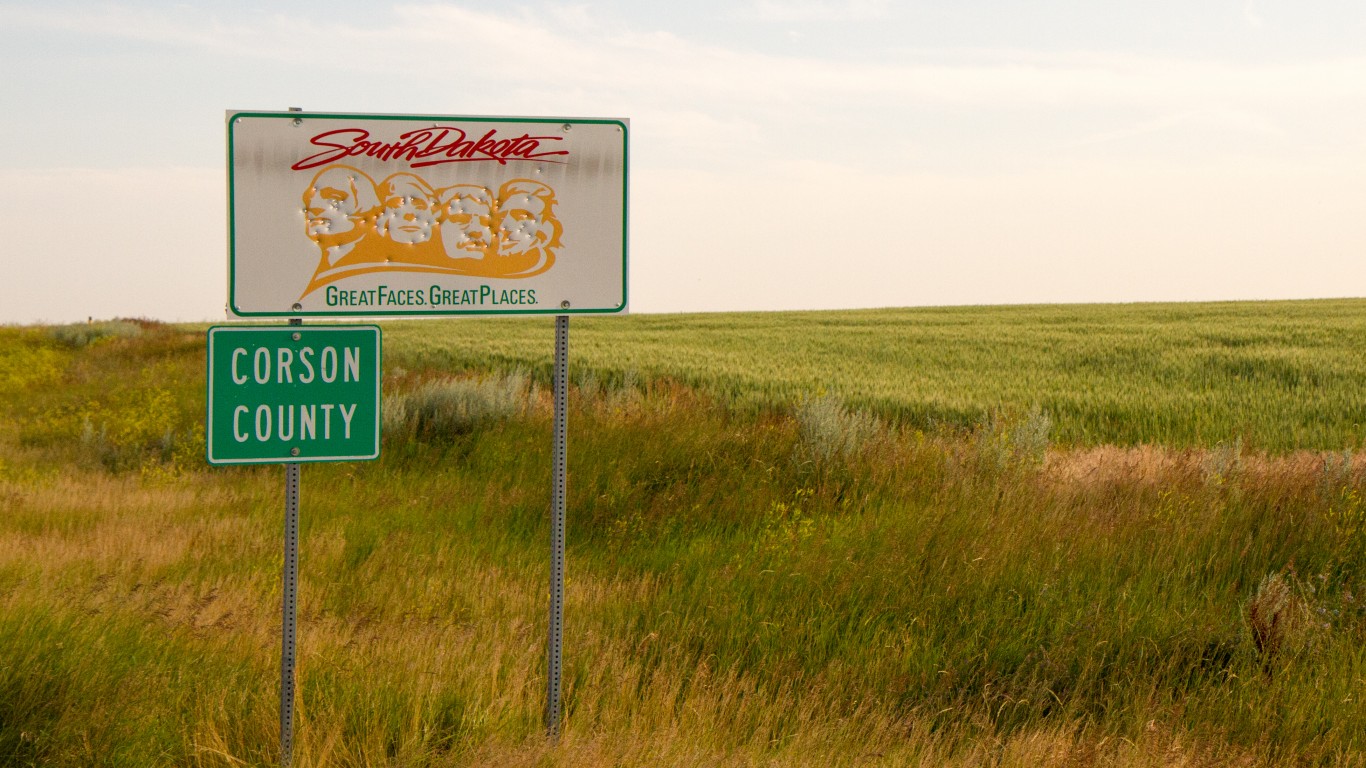
7. Corson County, South Dakota
> Poverty rate: 43.5% (#8 of 3,142 counties)
> Adults with a bachelor’s degree: 15.5% (#2,467 of 3,142 counties)
> Life expectancy at birth: 69.7 years (#3,099 of 3,111 counties)
> Median household income: $38,281 (#2,967 of 3,142 counties)
> County seat: McIntosh
Corson County covers the South Dakota portion of the Standing Rock Indian Reservation. The self-governed reservation, which was formed in the late 1800s, has some of the worst health outcomes of anywhere in the United States. The area’s life expectancy at birth of 69.7 years is nearly the lowest of any U.S. county.
Such poor health outcomes tend to be more common in poorer parts of the country. In Corson County, 43.5% of the population live below the poverty line, compared to 12.6% of Americans nationwide. The widespread poverty is partially attributable to limited economic opportunities, as the local five-year average unemployment rate stands at 25.2%.
[in-text-ad-2]
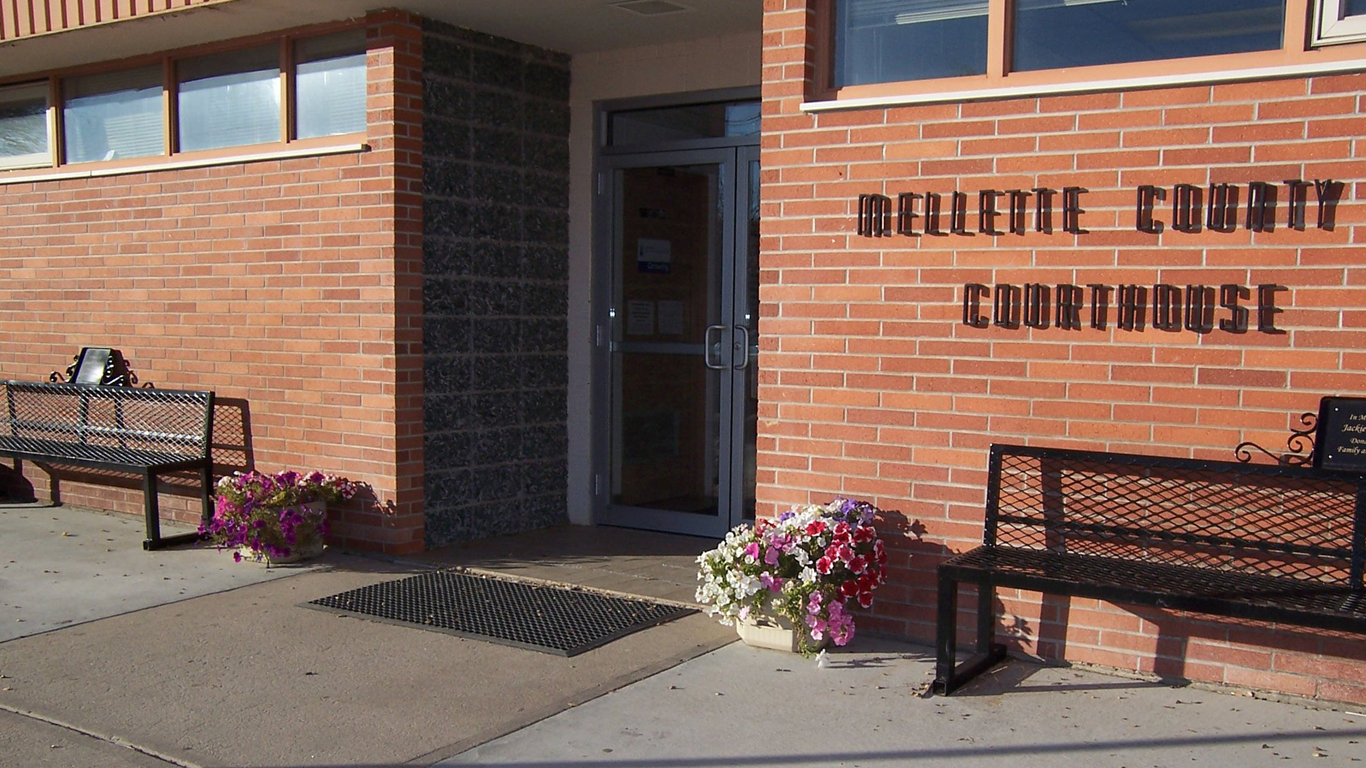
6. Mellette County, South Dakota
> Poverty rate: 50.0% (#3 of 3,142 counties)
> Adults with a bachelor’s degree: 14.6% (#2,625 of 3,142 counties)
> Life expectancy at birth: 70.2 years (#3,096 of 3,111 counties)
> Median household income: $35,726 (#3,035 of 3,142 counties)
> County seat: White River
Mellette County, South Dakota, covers part of the Rosebud Indian Reservation, which is among the most economically depressed communities in the United States. Native Americans commonly face extreme generational poverty resulting, in part, from their historical mistreatment by the U.S. government coupled with present-day laws, and in Mellette County, 50% of residents live below the poverty line. The widespread poverty is partially attributable to limited economic opportunities, as the local five-year average unemployment rate stands at 14.1%.
Low-income areas typically report worse than average health outcomes, and Mellette County is no exception. Life expectancy at birth is just 70.2 years on average, about nine years below the national average.

5. Kusilvak Census Area, Alaska
> Poverty rate: 36.6% (#16 of 3,142 counties)
> Adults with a bachelor’s degree: 2.9% (#3,140 of 3,142 counties)
> Life expectancy at birth: 69.2 years (#3,102 of 3,111 counties)
> Median household income: $37,975 (#2,979 of 3,142 counties)
> County seat: N/A
The Kusilvak Census Area, located along the coast in southwestern Alaska, ranks as the worst place to live in the state. Kusilvak is the only county equivalent in the state where life expectancy is below 70 years. Additionally, with a poverty rate of 36.6%, Kusilvak residents are nearly three times more likely to live on poverty level income than the typical American.
Higher educational attainment is closely linked to both improved health outcomes and increased financial security. In the Kusilvak Census Area, only 2.9% of adults have a bachelor’s degree or higher, compared to over a third of all adults nationwide.
[in-text-ad]
4. Buffalo County, South Dakota
> Poverty rate: 37.5% (#14 of 3,142 counties)
> Adults with a bachelor’s degree: 6.9% (#3,133 of 3,142 counties)
> Life expectancy at birth: 68.7 years (#3,106 of 3,111 counties)
> Median household income: $38,523 (#2,960 of 3,142 counties)
> County seat: Gann Valley
Buffalo County is located in central South Dakota and covers parts of the Crow Creek Reservation along the Missouri River. Health outcomes on reservations tend to be poorer than in most of the country, and in Buffalo County, life expectancy at birth is just 68.7 years, over a decade below the national average and among the lowest of any U.S. county.
An economically distressed area, Buffalo County’s 37.5% poverty rate is nearly three times higher than the national poverty rate. Additionally, an average of 18.9% of the local labor force were unemployed in the last five years.
3. Sioux County, North Dakota
> Poverty rate: 38.5% (#11 of 3,142 counties)
> Adults with a bachelor’s degree: 13.6% (#2,753 of 3,142 counties)
> Life expectancy at birth: 67.3 years (#3,109 of 3,111 counties)
> Median household income: $39,755 (#2,910 of 3,142 counties)
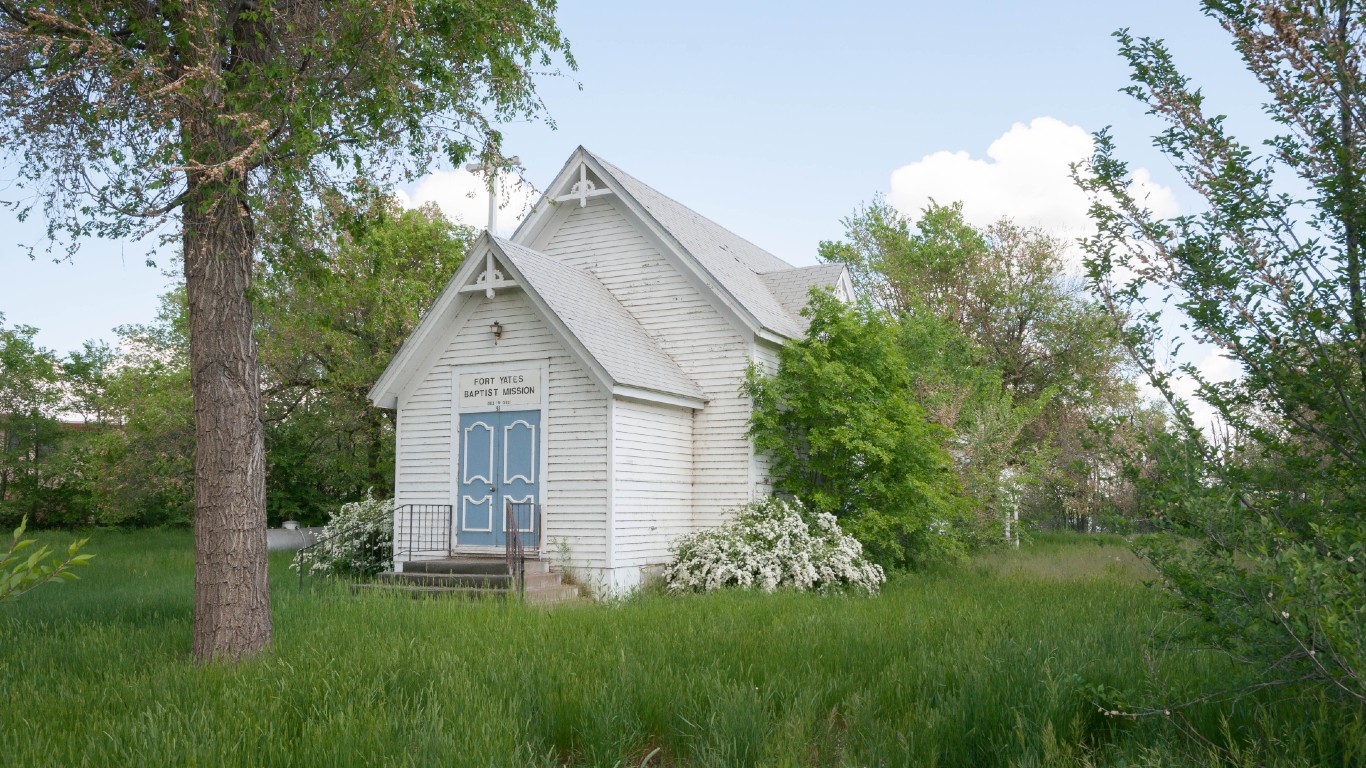
> County seat: Fort Yates
Sioux County, a largely rural area in North Dakota’s southern border, ranks as the worst county to live in the state and one of the worst in the country. Local residents are more than three times as likely to live in poverty than the typical American, and at just 67.3 years, life expectancy at birth is nearly 12 years below the U.S. average. A college education is linked to longer life expectancy and greater financial security. In Sioux County, only 13.6% of adults have a bachelor’s degree or higher, less than half the 33.6% share of adults across North Dakota who do.
Between 2015 and 2021, the number of people living in the county fell by 8.8%, even as North Dakota’s population expanded by 7.2%.
2. Todd County, South Dakota
> Poverty rate: 59.0% (#1 of 3,142 counties)
> Adults with a bachelor’s degree: 13.3% (#2,791 of 3,142 counties)
> Life expectancy at birth: 66.8 years (#3,110 of 3,111 counties)
> Median household income: $26,250 (#3,133 of 3,142 counties)
> County seat: Winner
Todd County, South Dakota, which covers part of the Rosebud Indian Reservation along the state’s southern border ranks as the second worst place to live in the country — largely due to widespread financial hardship. Due to a number of historical and contemporary factors, Native American populations are among the most disadvantaged in the United States. An estimated 59% of the local population live below the poverty line, the highest poverty rate of any U.S. county or county equivalent, and more than four times the national poverty rate of 12.6%.
As is the case in many economically disadvantaged areas in the United States, public health outcomes are also below average in Todd County. Life expectancy at birth in the county is just 66.8 years, more than 12 years below the national average.
[in-text-ad-2]
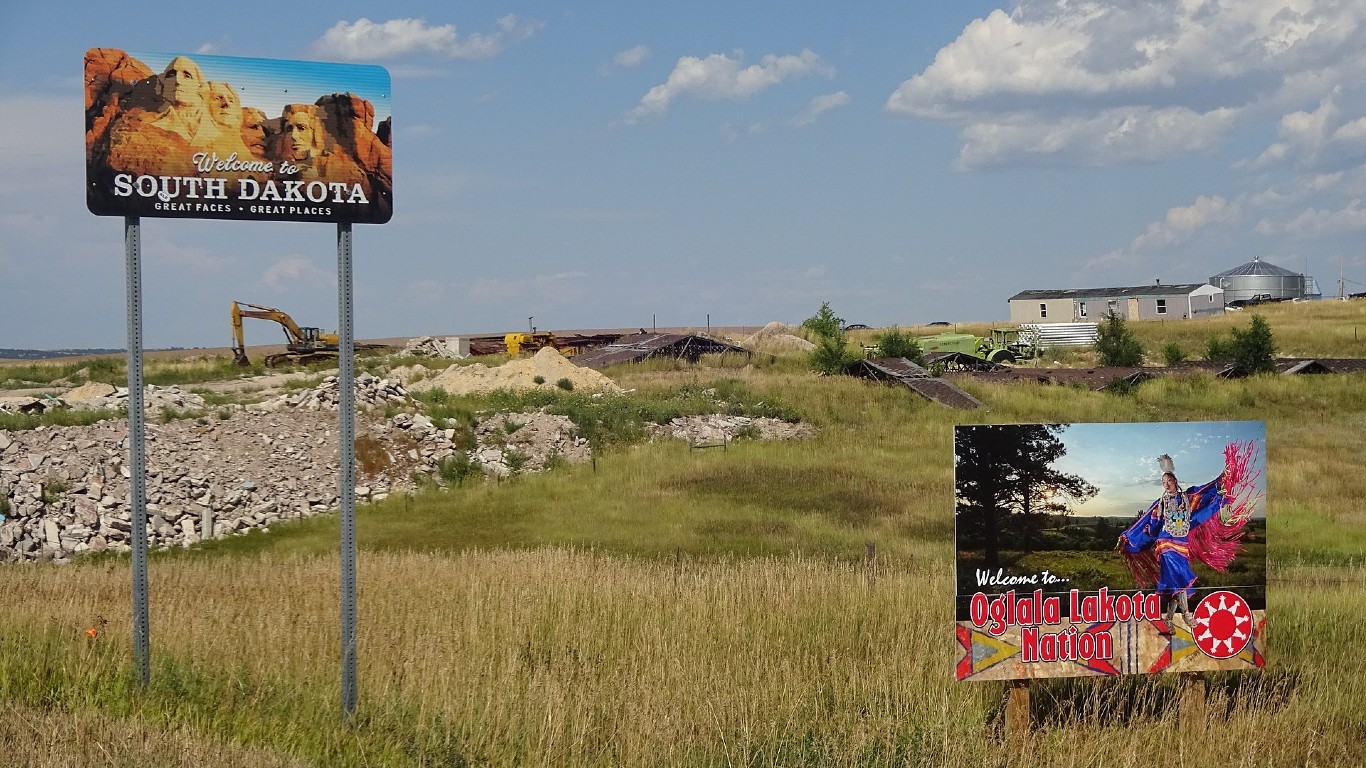
1. Oglala Lakota County, South Dakota
> Poverty rate: 50.5% (#2 of 3,142 counties)
> Adults with a bachelor’s degree: 10.4% (#3,061 of 3,142 counties)
> Life expectancy at birth: 64.5 years (#3,111 of 3,111 counties)
> Median household income: $33,192 (#3,082 of 3,142 counties)
> County seat: Hot Springs
Oglala Lakota County, located in southern South Dakota and encompassing parts of the Pine Ridge Indian Reservation, ranks as the worst place to live in the United States. Due to a number of historical and contemporary factors, many Native American reservations are among the poorest communities in the United States — and Oglala Lakota County is no exception. An estimated 50.5% of the population live below the poverty line, four times the 12.6% share of all Americans,
Life expectancy in the county also lags considerably behind the rest of the state. At birth, life expectancy in Oglala Lakota County is only 64.5 years, the lowest of any U.S. county or county equivalent, and nearly 15 years below the 79.1 year national average.
Want to Retire Early? Start Here (Sponsor)
Want retirement to come a few years earlier than you’d planned? Or are you ready to retire now, but want an extra set of eyes on your finances?
Now you can speak with up to 3 financial experts in your area for FREE. By simply clicking here you can begin to match with financial professionals who can help you build your plan to retire early. And the best part? The first conversation with them is free.
Click here to match with up to 3 financial pros who would be excited to help you make financial decisions.
Thank you for reading! Have some feedback for us?
Contact the 24/7 Wall St. editorial team.
 24/7 Wall St.

 24/7 Wall St.




 24/7 Wall St.