Special Report
These Are America’s 19 Fastest Shrinking Big Cities
Published:
Last Updated:

The U.S. population experienced historically slow growth in 2022, increasing just 0.4% compared to the previous year. While some American cities over the past half decade or so have undergone extreme population growth, a number of prominent American urban areas recorded a major exodus of residents. While many of these declines occurred in Rust Belt metropolitan areas, there are many exceptions.
To identify the most rapidly-shrinking large United States cities, 24/7 Wall St. reviewed population data from the U.S. Census Bureau’s 2021 American Community Survey one-year estimates. We listed all 19 metropolitan statistical areas with at least a 5% population drop from 2016 to 2021. We added seasonally-adjusted December employment figures – used to calculate employment growth from 2016 to 2021 – from the Bureau of Labor Statistics.
The enduring shifts in U.S. geographical patterns remain unchanged. A substantial share of the nation’s population resides within three states: California, Texas, and Florida, with the latter two states contributing significantly to population growth. However, our findings reveal that even within the most populous states, specific metro areas experienced a decline in residents. (Also see, the 15 countries Americans are moving to the most.)
West Virginia continues to contend with population loss. Among the 19 metropolitan areas that saw the greatest population decline over the past five years, three are the state of West Virginia. Additionally, Illinois also exhibits a noteworthy presence on this list with three of its metro areas featured. The Prairie State is one of ten states that experienced population contraction between 2018 and 2019. Both Nebraska and Arkansas each contribute two metro areas to the list.
The metropolitan areas on this list range from the least-populous Danville, Illinois, with 73,000 residents, to the more populated Corpus Christi, Texas, with 423,000 residents. While not on this list, some smaller population centers are also shrinking. . These are America’s disappearing small towns.
Notably, Kalamazoo-Portage, Michigan, experienced the most substantial percentage-based population decline. It is remarkable that this metro area was the sole one to observe an increase in unemployment from 2016 to 2021.
Click here to see America’s fastest shrinking big cities.
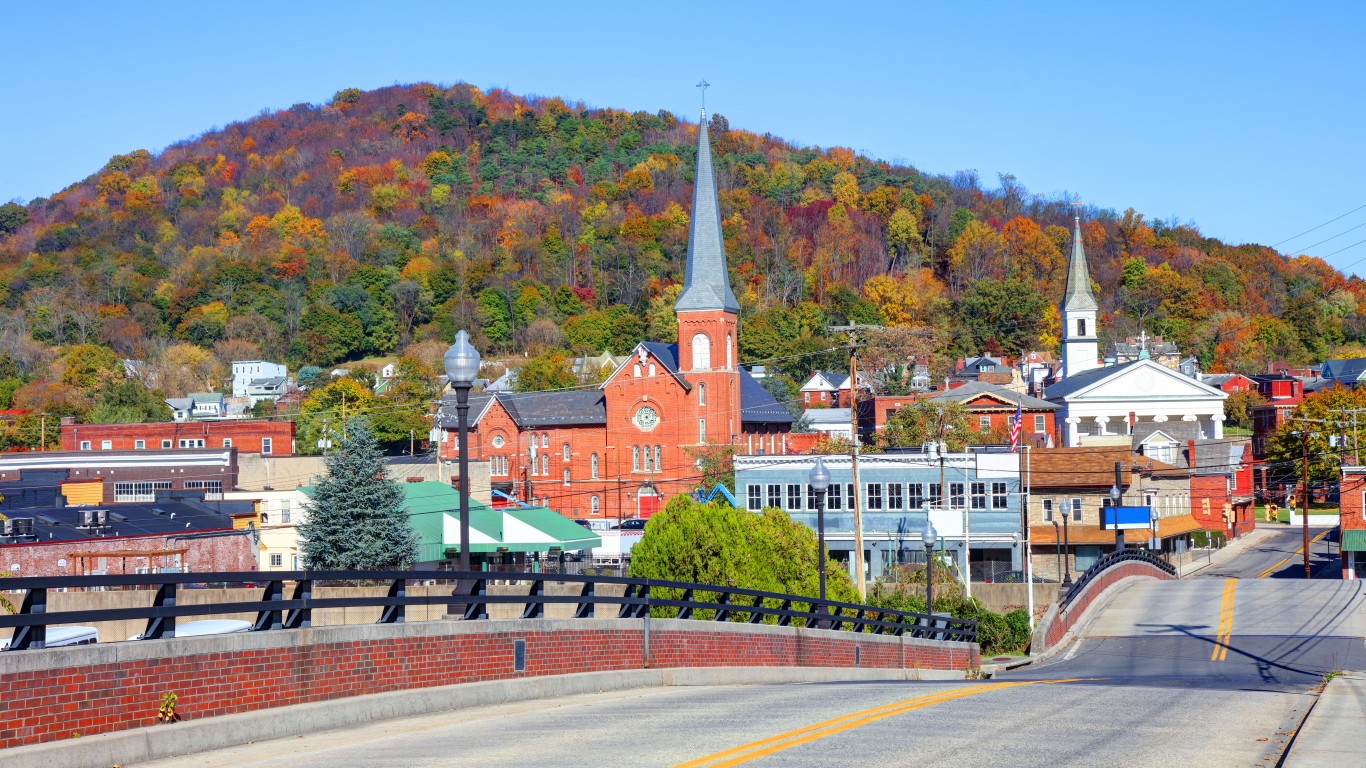
19. Cumberland, MD-WV
> 2016-2021 pop. growth: -5.0% (-4,955)
> 2021 population: 94,586 — #364 highest out of 381
> 2016 population: 99,541 — #354 highest out of 381
> 2016-2021 employment growth: -1.6% — #100 largest decrease out of 150
> Dec 2021 unemployment rate: 5.0% — #298 lowest out of 381
> Dec 2016 unemployment rate: 5.9% — #316 lowest out of 381
[in-text-ad]
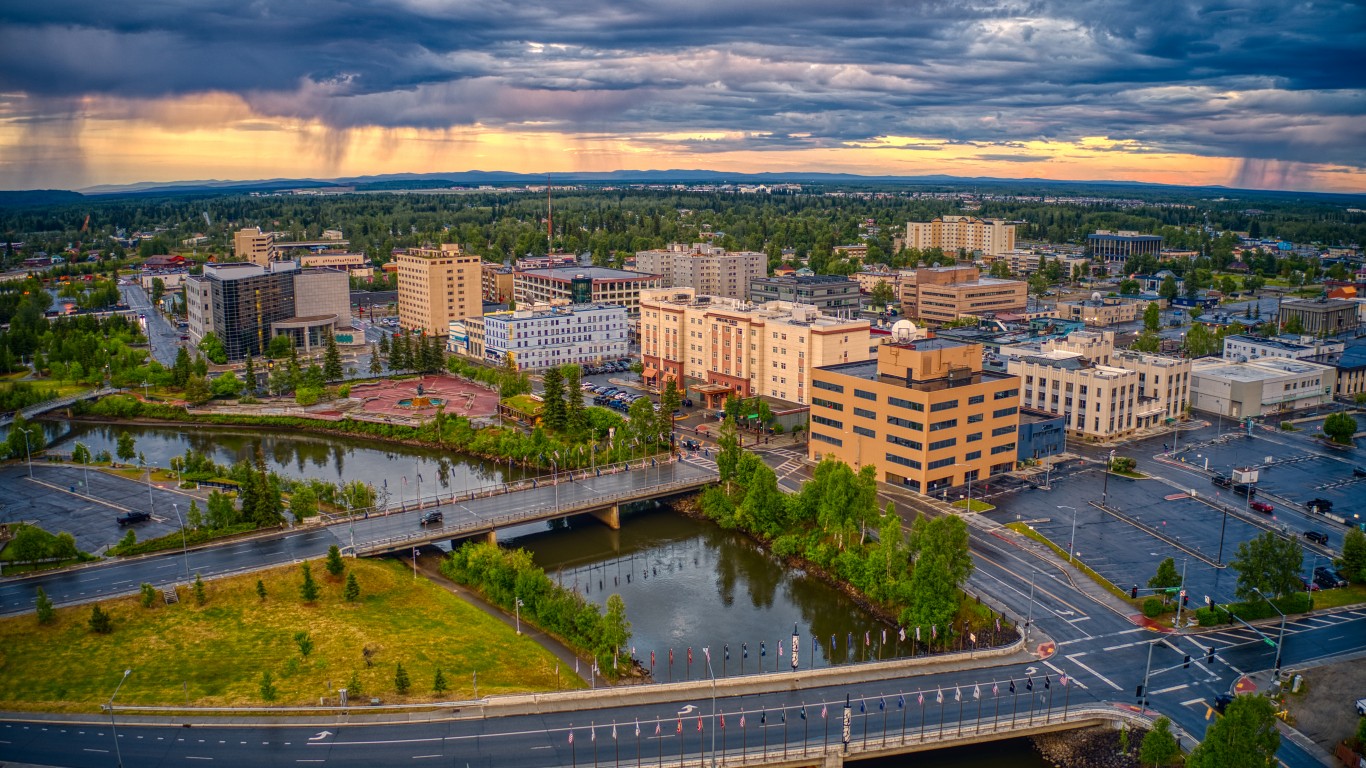
18. Fairbanks, AK
> 2016-2021 pop. growth: -5.0% (-5,012)
> 2021 population: 95,593 — #363 highest out of 381
> 2016 population: 100,605 — #351 highest out of 381
> 2016-2021 employment growth: -2.2% — #86 largest decrease out of 150
> Dec 2021 unemployment rate: 4.7% — #275 lowest out of 381
> Dec 2016 unemployment rate: 6.0% — #322 lowest out of 381
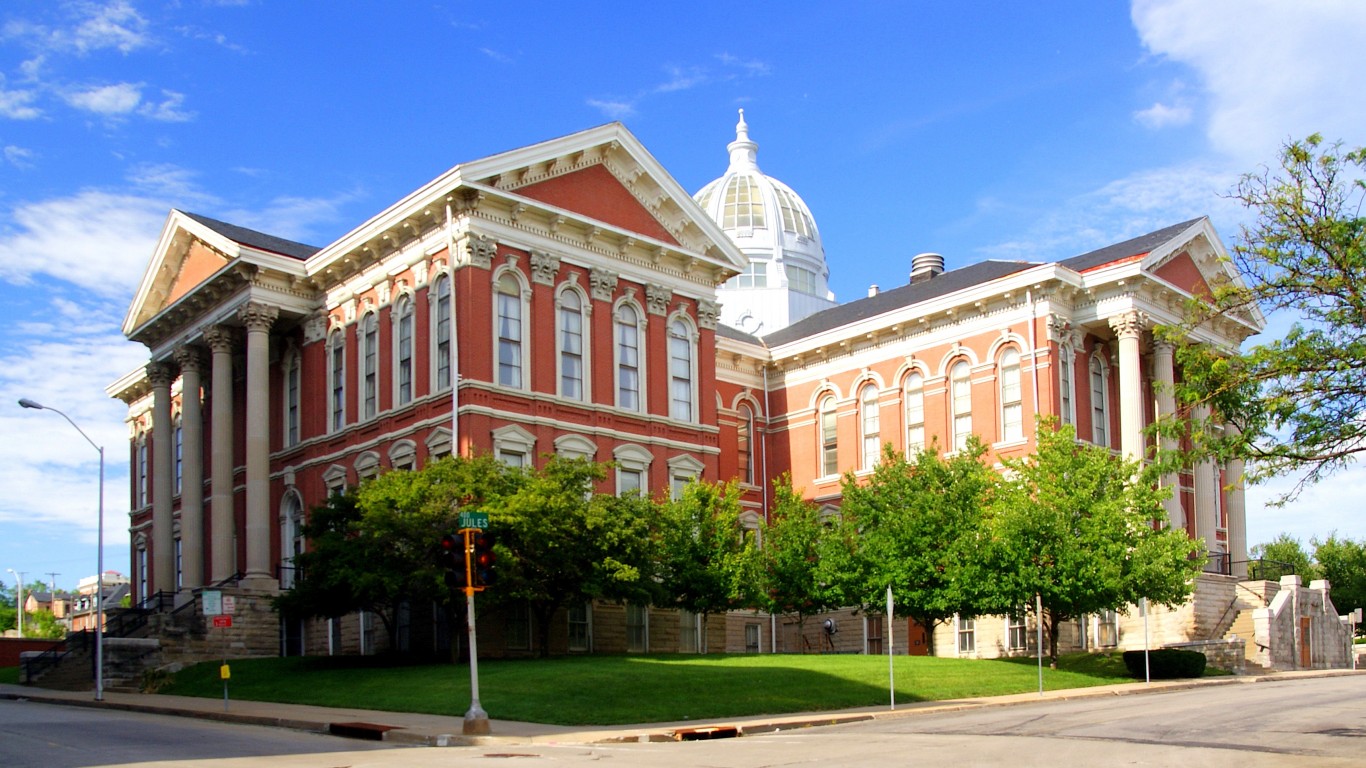
17. St. Joseph, MO-KS
> 2016-2021 pop. growth: -5.7% (-7,254)
> 2021 population: 120,274 — #326 highest out of 381
> 2016 population: 127,528 — #306 highest out of 381
> 2016-2021 employment growth: -3.7% — #55 largest decrease out of 150
> Dec 2021 unemployment rate: 2.7% — #65 lowest out of 381
> Dec 2016 unemployment rate: 3.9% — #84 lowest out of 381
16. Weirton-Steubenville, WV-OH
> 2016-2021 pop. growth: -5.8% (-7,063)
> 2021 population: 113,798 — #336 highest out of 381
> 2016 population: 120,861 — #321 highest out of 381
> 2016-2021 employment growth: +0.1% — #230 largest increase out of 231
> Dec 2021 unemployment rate: 5.3% — #313 lowest out of 381
> Dec 2016 unemployment rate: 7.2% — #369 lowest out of 381
[in-text-ad-2]
15. Goldsboro, NC
> 2016-2021 pop. growth: -5.9% (-7,315)
> 2021 population: 116,835 — #331 highest out of 381
> 2016 population: 124,150 — #313 highest out of 381
> 2016-2021 employment growth: -2.4% — #79 largest decrease out of 150
> Dec 2021 unemployment rate: 4.0% — #210 lowest out of 381
> Dec 2016 unemployment rate: 5.7% — #300 lowest out of 381

14. Beckley, WV
> 2016-2021 pop. growth: -6.0% (-7,226)
> 2021 population: 113,698 — #337 highest out of 381
> 2016 population: 120,924 — #320 highest out of 381
> 2016-2021 employment growth: +6.5% — #84 largest increase out of 231
> Dec 2021 unemployment rate: 3.9% — #197 lowest out of 381
> Dec 2016 unemployment rate: 6.3% — #339 lowest out of 381
[in-text-ad]
13. Danville, IL
> 2016-2021 pop. growth: -6.4% (-5,016)
> 2021 population: 73,095 — #377 highest out of 381
> 2016 population: 78,111 — #377 highest out of 381
> 2016-2021 employment growth: -5.0% — #37 largest decrease out of 150
> Dec 2021 unemployment rate: 5.1% — #305 lowest out of 381
> Dec 2016 unemployment rate: 7.0% — #367 lowest out of 381
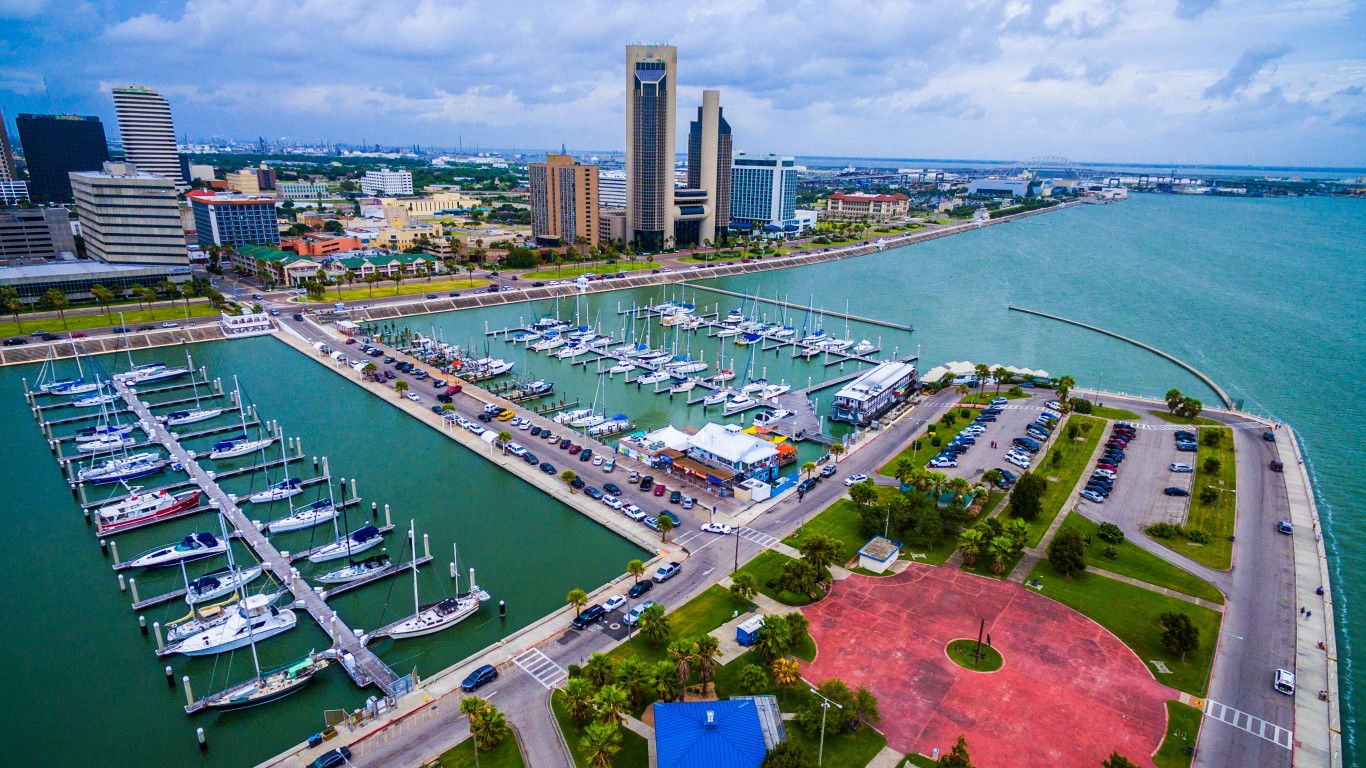
12. Corpus Christi, TX
> 2016-2021 pop. growth: -6.6% (-30,012)
> 2021 population: 422,778 — #130 highest out of 381
> 2016 population: 452,790 — #114 highest out of 381
> 2016-2021 employment growth: -2.4% — #77 largest decrease out of 150
> Dec 2021 unemployment rate: 6.3% — #354 lowest out of 381
> Dec 2016 unemployment rate: 6.3% — #339 lowest out of 381
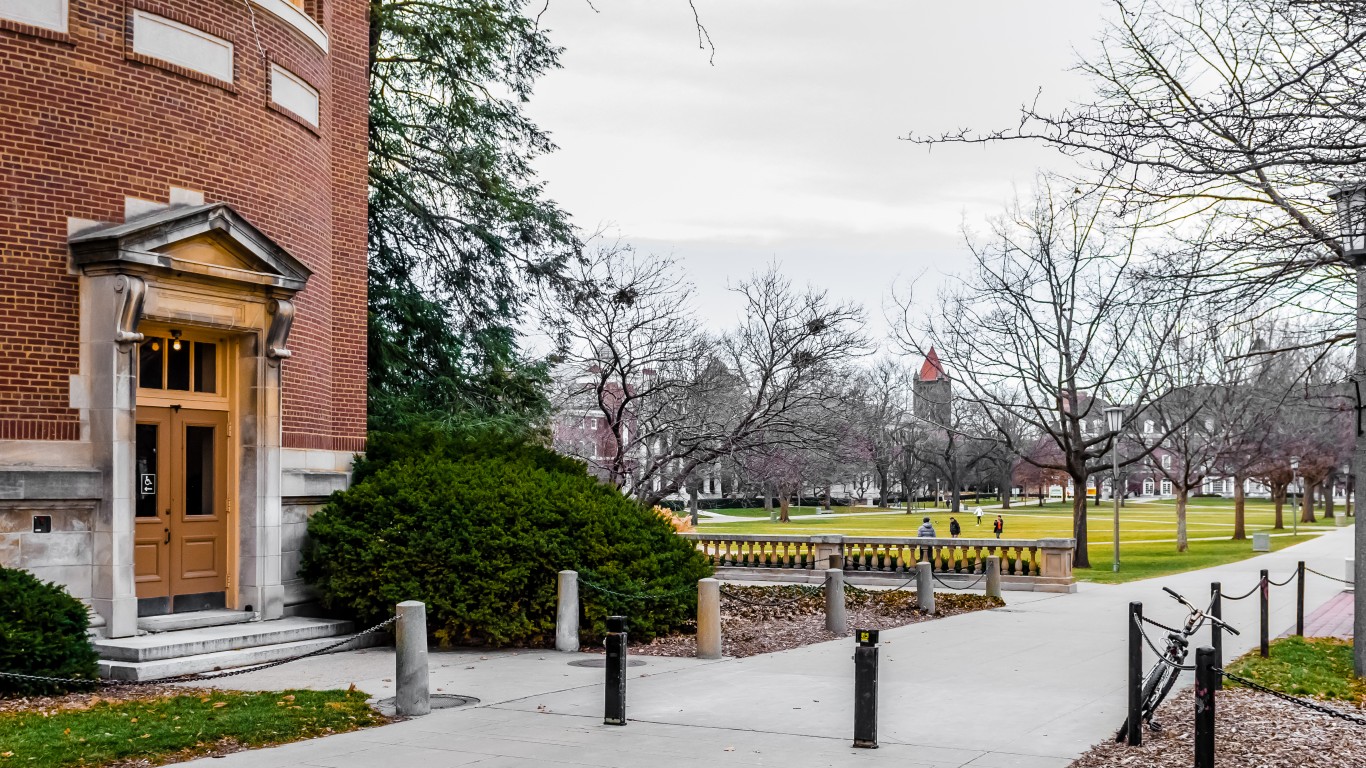
11. Champaign-Urbana, IL
> 2016-2021 pop. growth: -7.2% (-17,176)
> 2021 population: 222,696 — #204 highest out of 381
> 2016 population: 239,872 — #189 highest out of 381
> 2016-2021 employment growth: +2.1% — #173 largest increase out of 231
> Dec 2021 unemployment rate: 3.7% — #162 lowest out of 381
> Dec 2016 unemployment rate: 4.9% — #210 lowest out of 381
[in-text-ad-2]
10. Pine Bluff, AR
> 2016-2021 pop. growth: -7.8% (-7,324)
> 2021 population: 86,747 — #367 highest out of 381
> 2016 population: 94,071 — #363 highest out of 381
> 2016-2021 employment growth: -2.0% — #87 largest decrease out of 150
> Dec 2021 unemployment rate: 4.8% — #282 lowest out of 381
> Dec 2016 unemployment rate: 5.1% — #233 lowest out of 381

9. Chico, CA
> 2016-2021 pop. growth: -8.2% (-18,555)
> 2021 population: 208,309 — #212 highest out of 381
> 2016 population: 226,864 — #196 highest out of 381
> 2016-2021 employment growth: -8.5% — #8 largest decrease out of 150
> Dec 2021 unemployment rate: 5.5% — #331 lowest out of 381
> Dec 2016 unemployment rate: 6.4% — #346 lowest out of 381
[in-text-ad]
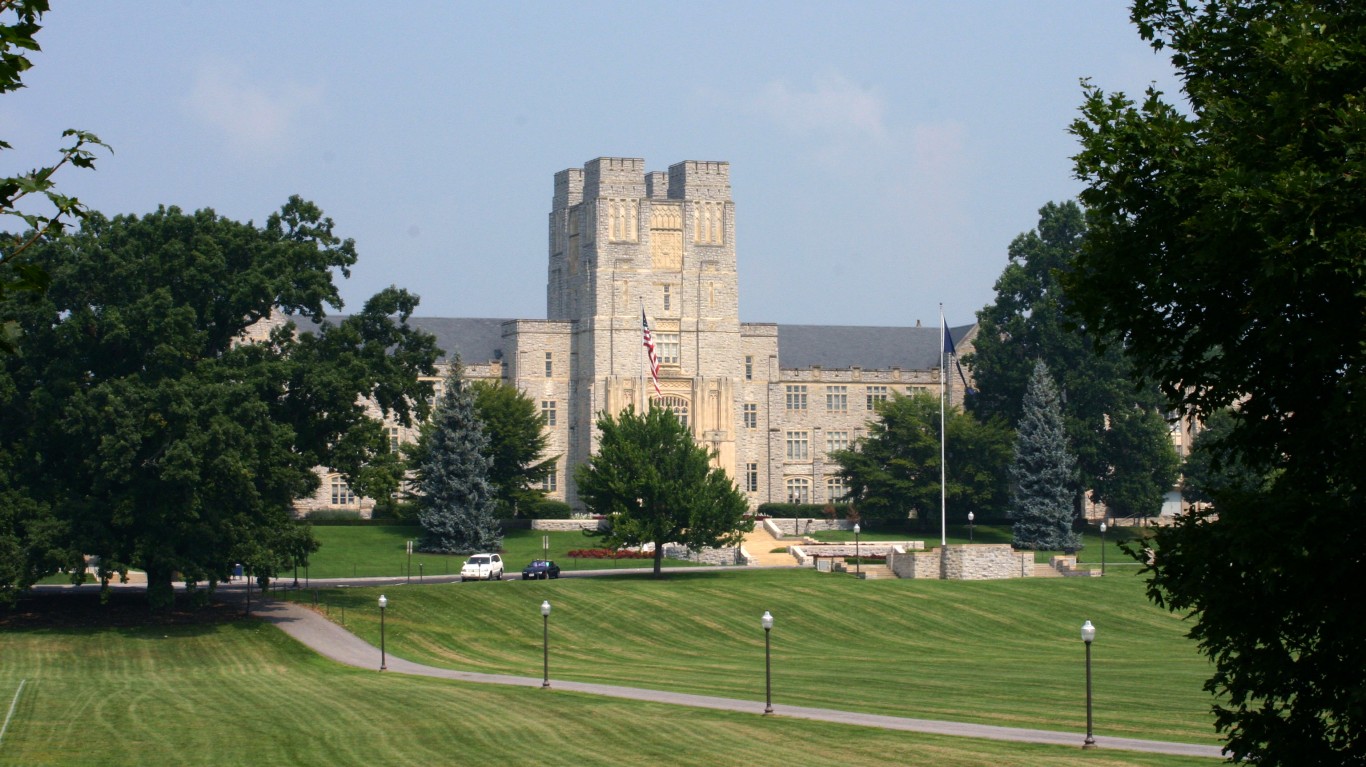
8. Blacksburg-Christiansburg, VA
> 2016-2021 pop. growth: -8.2% (-15,007)
> 2021 population: 168,404 — #254 highest out of 381
> 2016 population: 183,411 — #226 highest out of 381
> 2016-2021 employment growth: +2.3% — #163 largest increase out of 231
> Dec 2021 unemployment rate: 2.9% — #79 lowest out of 381
> Dec 2016 unemployment rate: 4.6% — #172 lowest out of 381

7. Bloomington, IL
> 2016-2021 pop. growth: -8.8% (-16,437)
> 2021 population: 170,889 — #251 highest out of 381
> 2016 population: 187,326 — #224 highest out of 381
> 2016-2021 employment growth: -8.9% — #5 largest decrease out of 150
> Dec 2021 unemployment rate: 3.8% — #181 lowest out of 381
> Dec 2016 unemployment rate: 4.8% — #199 lowest out of 381

6. Panama City, FL
> 2016-2021 pop. growth: -10.8% (-21,725)
> 2021 population: 179,168 — #240 highest out of 381
> 2016 population: 200,893 — #217 highest out of 381
> 2016-2021 employment growth: +0.7% — #208 largest increase out of 231
> Dec 2021 unemployment rate: 3.5% — #141 lowest out of 381
> Dec 2016 unemployment rate: 4.6% — #172 lowest out of 381
[in-text-ad-2]
5. Grand Island, NE
> 2016-2021 pop. growth: -11.0% (-9,409)
> 2021 population: 76,175 — #376 highest out of 381
> 2016 population: 85,584 — #368 highest out of 381
> 2016-2021 employment growth: +1.6% — #183 largest increase out of 231
> Dec 2021 unemployment rate: 1.8% — #5 lowest out of 381
> Dec 2016 unemployment rate: 3.2% — #28 lowest out of 381
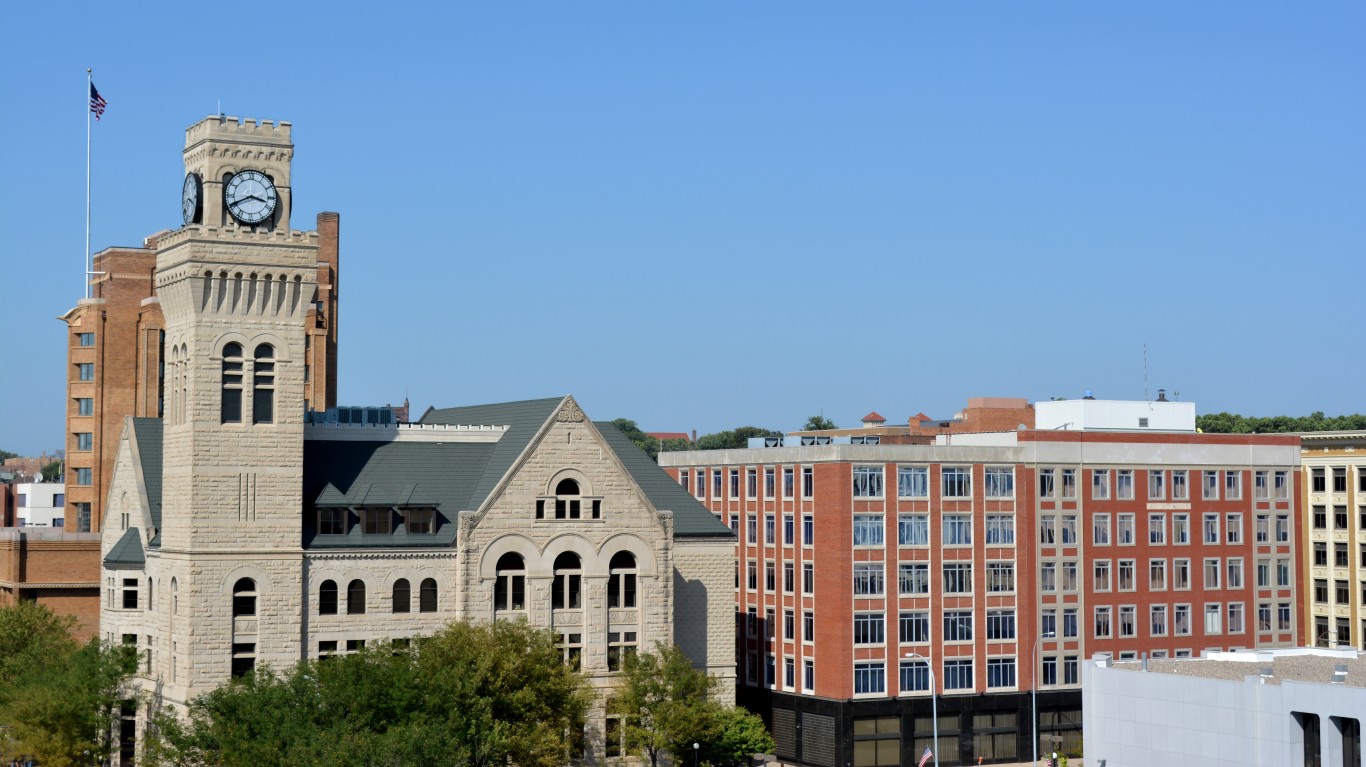
4. Sioux City, IA-NE-SD
> 2016-2021 pop. growth: -11.0% (-18,547)
> 2021 population: 149,400 — #282 highest out of 381
> 2016 population: 167,947 — #247 highest out of 381
> 2016-2021 employment growth: -0.2% — #146 largest decrease out of 150
> Dec 2021 unemployment rate: 2.9% — #79 lowest out of 381
> Dec 2016 unemployment rate: 3.5% — #54 lowest out of 381
[in-text-ad]
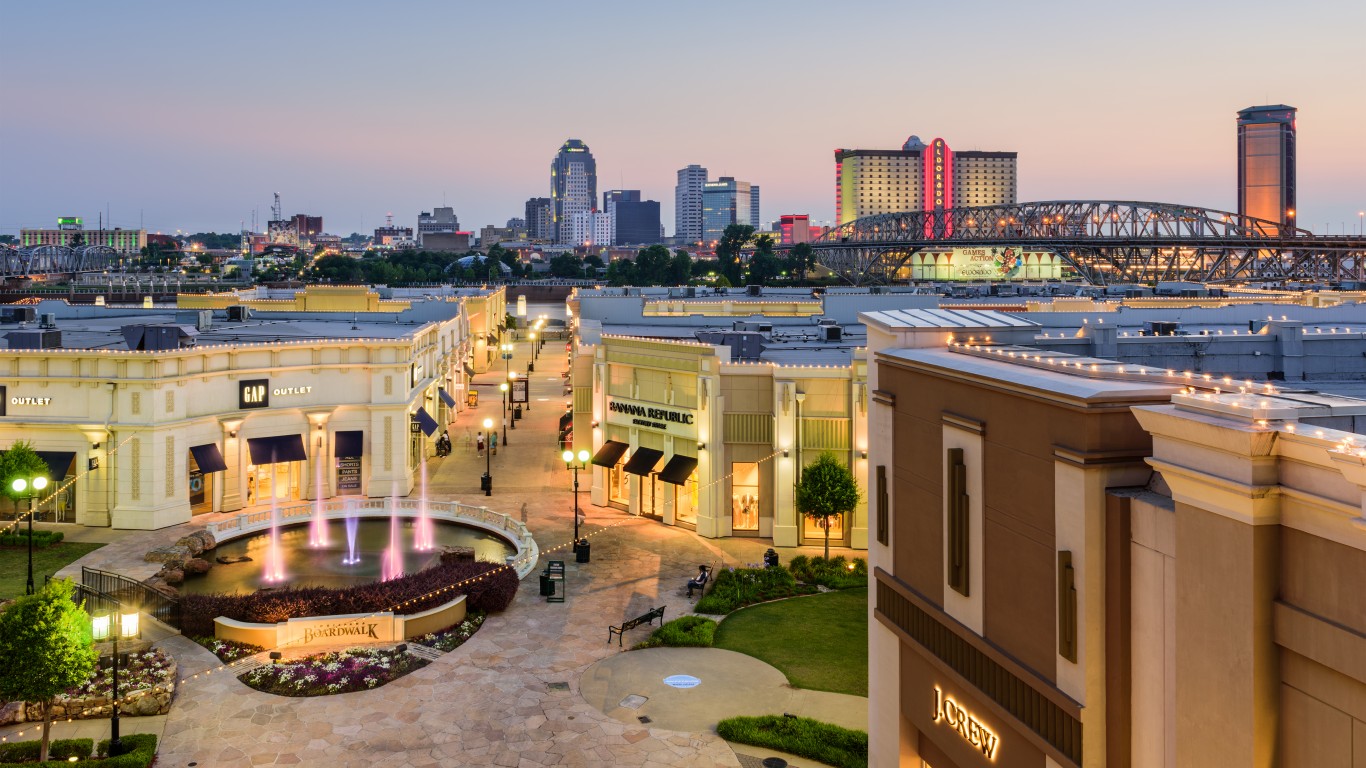
3. Shreveport-Bossier City, LA
> 2016-2021 pop. growth: -11.9% (-52,612)
> 2021 population: 389,155 — #138 highest out of 381
> 2016 population: 441,767 — #120 highest out of 381
> 2016-2021 employment growth: -1.6% — #98 largest decrease out of 150
> Dec 2021 unemployment rate: 4.6% — #270 lowest out of 381
> Dec 2016 unemployment rate: 6.2% — #331 lowest out of 381
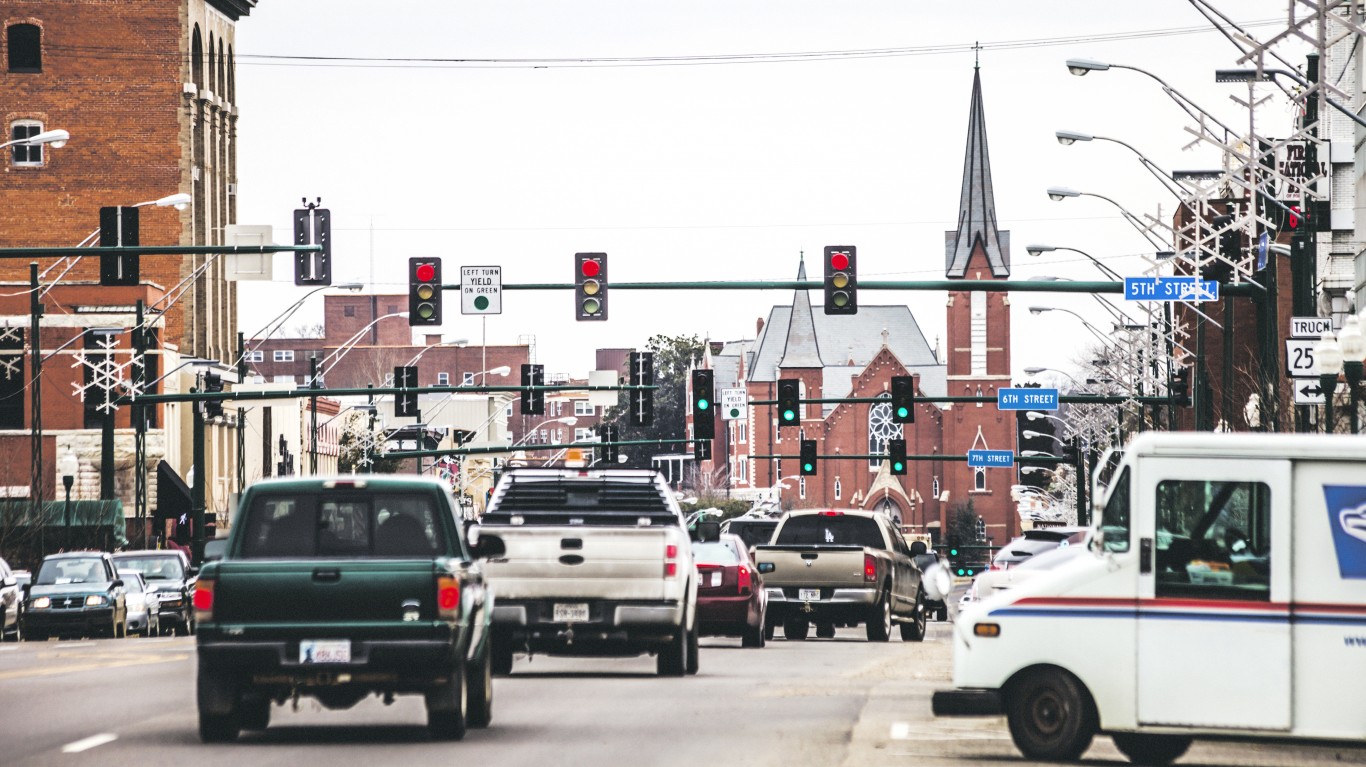
2. Fort Smith, AR-OK
> 2016-2021 pop. growth: -11.9% (-33,566)
> 2021 population: 247,661 — #191 highest out of 381
> 2016 population: 281,227 — #169 highest out of 381
> 2016-2021 employment growth: +0.4% — #216 largest increase out of 231
> Dec 2021 unemployment rate: 2.7% — #65 lowest out of 381
> Dec 2016 unemployment rate: 4.2% — #115 lowest out of 381

1. Kalamazoo-Portage, MI
> 2016-2021 pop. growth: -22.5% (-75,769)
> 2021 population: 261,108 — #187 highest out of 381
> 2016 population: 336,877 — #151 highest out of 381
> 2016-2021 employment growth: -3.3% — #61 largest decrease out of 150
> Dec 2021 unemployment rate: 5.0% — #298 lowest out of 381
> Dec 2016 unemployment rate: 4.5% — #156 lowest out of 381
Credit card companies are pulling out all the stops, with the issuers are offering insane travel rewards and perks.
We’re talking huge sign-up bonuses, points on every purchase, and benefits like lounge access, travel credits, and free hotel nights. For travelers, these rewards can add up to thousands of dollars in flights, upgrades, and luxury experiences every year.
It’s like getting paid to travel — and it’s available to qualified borrowers who know where to look.
We’ve rounded up some of the best travel credit cards on the market. Click here to see the list. Don’t miss these offers — they won’t be this good forever.
Thank you for reading! Have some feedback for us?
Contact the 24/7 Wall St. editorial team.