Special Report
States on Track to See the Biggest COVID Surges by October

Published:

Data provided by Centers for Disease Control and Prevention indicates a growing concern over an increase in COVID-19 cases this fall. Already, hospitalizations are increasing and deaths have been rising.
To determine the states where COVID-19 will be worst in October, 24/7 Tempo reviewed COVID-19 forecasts from the Centers for Disease Control and Prevention. States were ranked based on the number of projected COVID-19 hospital admissions in the week ending Oct. 2, 2023, per 100,000 residents. Projected COVID-19 admissions are based on a CDC ensemble forecast combining individual model forecasts from Carnegie Mellon University, Indiana University, Northeastern University, and the University of Massachusetts Amherst.
Supplemental data on the number of recorded COVID-19 hospital admissions in the week ending Aug. 26, 2023; the total number of recorded COVID-19 hospital admissions since Aug.1, 2020; the total number of deaths due to COVID-19 since January 2020; and the COVID-19 test positivity rate for the week of Aug. 20-26, 2023, also came from the CDC. Population data used to adjust hospital admission and death counts per capita came from the U.S. Census Bureau’s Population and Housing Unit Estimates program and is for July 1, 2022.
After falling to an all-time low in June, the number of hospitalized COVID patients has been rising. For the week ending Aug. 26, there were about 17,400 Americans hospitalized because of COVID, an increase of nearly 16% from the prior week, according to the CDC.
The agency says the current increases in cases and hospitalizations are likely because of the XBB sub-variants, such as EG.5, and FL.1.5.1. The BA.2.86 variant, which has been detected in Michigan, Texas, New York, Ohio, and Virginia, is not as bad as feared at first. (These are the states where the COVID-19 surge is the worst right now.)
Click here to see the states on track to see the biggest COVID surges by October
The projected number of COVID-19 hospital admissions for the week ending Oct. 2, 2023, is lowest in less-populated states such as New Mexico, Maine, and Nebraska. Seven of the 10 states with the highest projected number of COVID-19 hospital admissions are in the South. (Here are the states with the most health-conscious residents.)
The states with the lowest positivity rates, meanwhile, are mostly in the Northeast and New England, while rates are higher in the South and West.

50. New Mexico
> Projected COVID-19 hospital admissions, week ending Oct. 2, 2023: 2.3 per 100,000 (49 total)
> COVID-19 hospital admissions, week ending Aug. 26, 2023: 1.8 per 100,000 (the lowest)
> Total COVID-19 hospital admissions since Aug.1, 2020: 1,804.6 per 100,000 (22nd lowest)
> Total COVID-19 deaths since January 2020: 441.0 per 100,000 (5th highest)
> Current COVID-19 test positivity rate: 20.8% (the highest)
[in-text-ad]
49. Nebraska
> Projected COVID-19 hospital admissions, week ending Oct. 2, 2023: 2.8 per 100,000 (56 total)
> COVID-19 hospital admissions, week ending Aug. 26, 2023: 2.3 per 100,000 (3rd lowest)
> Total COVID-19 hospital admissions since Aug.1, 2020: 1,597.3 per 100,000 (17th lowest)
> Total COVID-19 deaths since January 2020: 292.7 per 100,000 (15th lowest)
> Current COVID-19 test positivity rate: 14.9% (10th highest)

48. Maine
> Projected COVID-19 hospital admissions, week ending Oct. 2, 2023: 3.2 per 100,000 (44 total)
> COVID-19 hospital admissions, week ending Aug. 26, 2023: 1.9 per 100,000 (2nd lowest)
> Total COVID-19 hospital admissions since Aug.1, 2020: 1,086.4 per 100,000 (4th lowest)
> Total COVID-19 deaths since January 2020: 236.2 per 100,000 (8th lowest)
> Current COVID-19 test positivity rate: 10.4% (8th lowest)
47. Oklahoma
> Projected COVID-19 hospital admissions, week ending Oct. 2, 2023: 3.3 per 100,000 (133 total)
> COVID-19 hospital admissions, week ending Aug. 26, 2023: 3.2 per 100,000 (13th lowest)
> Total COVID-19 hospital admissions since Aug.1, 2020: 2,725.2 per 100,000 (2nd highest)
> Total COVID-19 deaths since January 2020: 485.3 per 100,000 (3rd highest)
> Current COVID-19 test positivity rate: 20.8% (the highest)
[in-text-ad-2]

46. New Jersey
> Projected COVID-19 hospital admissions, week ending Oct. 2, 2023: 3.4 per 100,000 (315 total)
> COVID-19 hospital admissions, week ending Aug. 26, 2023: 3.4 per 100,000 (16th lowest)
> Total COVID-19 hospital admissions since Aug.1, 2020: 1,853.9 per 100,000 (25th lowest)
> Total COVID-19 deaths since January 2020: 381.1 per 100,000 (15th highest)
> Current COVID-19 test positivity rate: 9.6% (2nd lowest)
45. North Dakota
> Projected COVID-19 hospital admissions, week ending Oct. 2, 2023: 3.6 per 100,000 (28 total)
> COVID-19 hospital admissions, week ending Aug. 26, 2023: 2.7 per 100,000 (4th lowest)
> Total COVID-19 hospital admissions since Aug.1, 2020: 1,924.8 per 100,000 (21st highest)
> Total COVID-19 deaths since January 2020: 338.5 per 100,000 (21st lowest)
> Current COVID-19 test positivity rate: 14.2% (14th highest)
[in-text-ad]

44. Alaska
> Projected COVID-19 hospital admissions, week ending Oct. 2, 2023: 3.8 per 100,000 (28 total)
> COVID-19 hospital admissions, week ending Aug. 26, 2023: 2.9 per 100,000 (5th lowest)
> Total COVID-19 hospital admissions since Aug.1, 2020: 1,318.6 per 100,000 (7th lowest)
> Total COVID-19 deaths since January 2020: 206.4 per 100,000 (5th lowest)
> Current COVID-19 test positivity rate: 12.9% (17th lowest)

43. South Dakota
> Projected COVID-19 hospital admissions, week ending Oct. 2, 2023: 3.8 per 100,000 (35 total)
> COVID-19 hospital admissions, week ending Aug. 26, 2023: 3.5 per 100,000 (19th lowest)
> Total COVID-19 hospital admissions since Aug.1, 2020: 2,101.7 per 100,000 (11th highest)
> Total COVID-19 deaths since January 2020: 359.7 per 100,000 (23rd highest)
> Current COVID-19 test positivity rate: 14.2% (14th highest)

42. New Hampshire
> Projected COVID-19 hospital admissions, week ending Oct. 2, 2023: 4.0 per 100,000 (56 total)
> COVID-19 hospital admissions, week ending Aug. 26, 2023: 3.1 per 100,000 (9th lowest)
> Total COVID-19 hospital admissions since Aug.1, 2020: 1,293.6 per 100,000 (6th lowest)
> Total COVID-19 deaths since January 2020: 235.5 per 100,000 (7th lowest)
> Current COVID-19 test positivity rate: 10.4% (8th lowest)
[in-text-ad-2]

41. Ohio
> Projected COVID-19 hospital admissions, week ending Oct. 2, 2023: 4.0 per 100,000 (474 total)
> COVID-19 hospital admissions, week ending Aug. 26, 2023: 3.1 per 100,000 (12th lowest)
> Total COVID-19 hospital admissions since Aug.1, 2020: 2,208.5 per 100,000 (7th highest)
> Total COVID-19 deaths since January 2020: 422.8 per 100,000 (7th highest)
> Current COVID-19 test positivity rate: 13.5% (20th highest)

40. Utah
> Projected COVID-19 hospital admissions, week ending Oct. 2, 2023: 4.1 per 100,000 (137 total)
> COVID-19 hospital admissions, week ending Aug. 26, 2023: 2.9 per 100,000 (6th lowest)
> Total COVID-19 hospital admissions since Aug.1, 2020: 1,381.6 per 100,000 (10th lowest)
> Total COVID-19 deaths since January 2020: 163.2 per 100,000 (3rd lowest)
> Current COVID-19 test positivity rate: 14.2% (14th highest)
[in-text-ad]

39. Pennsylvania
> Projected COVID-19 hospital admissions, week ending Oct. 2, 2023: 4.3 per 100,000 (555 total)
> COVID-19 hospital admissions, week ending Aug. 26, 2023: 3.5 per 100,000 (18th lowest)
> Total COVID-19 hospital admissions since Aug.1, 2020: 1,881.0 per 100,000 (25th highest)
> Total COVID-19 deaths since January 2020: 405.9 per 100,000 (11th highest)
> Current COVID-19 test positivity rate: 12.1% (13th lowest)

38. Minnesota
> Projected COVID-19 hospital admissions, week ending Oct. 2, 2023: 4.3 per 100,000 (247 total)
> COVID-19 hospital admissions, week ending Aug. 26, 2023: 3.1 per 100,000 (8th lowest)
> Total COVID-19 hospital admissions since Aug.1, 2020: 1,372.7 per 100,000 (9th lowest)
> Total COVID-19 deaths since January 2020: 271.5 per 100,000 (11th lowest)
> Current COVID-19 test positivity rate: 13.5% (20th highest)

37. Vermont
> Projected COVID-19 hospital admissions, week ending Oct. 2, 2023: 4.3 per 100,000 (28 total)
> COVID-19 hospital admissions, week ending Aug. 26, 2023: 3.6 per 100,000 (21st lowest)
> Total COVID-19 hospital admissions since Aug.1, 2020: 965.3 per 100,000 (the lowest)
> Total COVID-19 deaths since January 2020: 157.0 per 100,000 (2nd lowest)
> Current COVID-19 test positivity rate: 10.4% (8th lowest)
[in-text-ad-2]
36. Iowa
> Projected COVID-19 hospital admissions, week ending Oct. 2, 2023: 4.4 per 100,000 (140 total)
> COVID-19 hospital admissions, week ending Aug. 26, 2023: 3.8 per 100,000 (25th lowest)
> Total COVID-19 hospital admissions since Aug.1, 2020: 1,688.6 per 100,000 (19th lowest)
> Total COVID-19 deaths since January 2020: 347.2 per 100,000 (25th highest)
> Current COVID-19 test positivity rate: 14.9% (10th highest)

35. Wisconsin
> Projected COVID-19 hospital admissions, week ending Oct. 2, 2023: 4.4 per 100,000 (258 total)
> COVID-19 hospital admissions, week ending Aug. 26, 2023: 3.3 per 100,000 (15th lowest)
> Total COVID-19 hospital admissions since Aug.1, 2020: 2,138.4 per 100,000 (10th highest)
> Total COVID-19 deaths since January 2020: 290.9 per 100,000 (14th lowest)
> Current COVID-19 test positivity rate: 13.5% (20th highest)
[in-text-ad]

34. Arizona
> Projected COVID-19 hospital admissions, week ending Oct. 2, 2023: 4.5 per 100,000 (332 total)
> COVID-19 hospital admissions, week ending Aug. 26, 2023: 3.4 per 100,000 (17th lowest)
> Total COVID-19 hospital admissions since Aug.1, 2020: 2,079.2 per 100,000 (13th highest)
> Total COVID-19 deaths since January 2020: 403.4 per 100,000 (12th highest)
> Current COVID-19 test positivity rate: 16.1% (6th highest)

33. Nevada
> Projected COVID-19 hospital admissions, week ending Oct. 2, 2023: 4.5 per 100,000 (144 total)
> COVID-19 hospital admissions, week ending Aug. 26, 2023: 4.2 per 100,000 (22nd highest)
> Total COVID-19 hospital admissions since Aug.1, 2020: 2,020.4 per 100,000 (16th highest)
> Total COVID-19 deaths since January 2020: 374.9 per 100,000 (18th highest)
> Current COVID-19 test positivity rate: 16.1% (6th highest)

32. Idaho
> Projected COVID-19 hospital admissions, week ending Oct. 2, 2023: 4.6 per 100,000 (89 total)
> COVID-19 hospital admissions, week ending Aug. 26, 2023: 3.1 per 100,000 (11th lowest)
> Total COVID-19 hospital admissions since Aug.1, 2020: 1,418.6 per 100,000 (12th lowest)
> Total COVID-19 deaths since January 2020: 284.3 per 100,000 (13th lowest)
> Current COVID-19 test positivity rate: 12.9% (17th lowest)
[in-text-ad-2]

31. West Virginia
> Projected COVID-19 hospital admissions, week ending Oct. 2, 2023: 4.7 per 100,000 (84 total)
> COVID-19 hospital admissions, week ending Aug. 26, 2023: 4.9 per 100,000 (17th highest)
> Total COVID-19 hospital admissions since Aug.1, 2020: 2,372.5 per 100,000 (5th highest)
> Total COVID-19 deaths since January 2020: 486.2 per 100,000 (2nd highest)
> Current COVID-19 test positivity rate: 12.1% (13th lowest)

30. Michigan
> Projected COVID-19 hospital admissions, week ending Oct. 2, 2023: 4.8 per 100,000 (478 total)
> COVID-19 hospital admissions, week ending Aug. 26, 2023: 3.0 per 100,000 (7th lowest)
> Total COVID-19 hospital admissions since Aug.1, 2020: 1,912.3 per 100,000 (22nd highest)
> Total COVID-19 deaths since January 2020: 375.8 per 100,000 (17th highest)
> Current COVID-19 test positivity rate: 13.5% (20th highest)
[in-text-ad]
29. Delaware
> Projected COVID-19 hospital admissions, week ending Oct. 2, 2023: 4.8 per 100,000 (49 total)
> COVID-19 hospital admissions, week ending Aug. 26, 2023: 3.5 per 100,000 (20th lowest)
> Total COVID-19 hospital admissions since Aug.1, 2020: 1,968.2 per 100,000 (18th highest)
> Total COVID-19 deaths since January 2020: 339.1 per 100,000 (23rd lowest)
> Current COVID-19 test positivity rate: 12.1% (13th lowest)
28. Colorado
> Projected COVID-19 hospital admissions, week ending Oct. 2, 2023: 4.8 per 100,000 (282 total)
> COVID-19 hospital admissions, week ending Aug. 26, 2023: 3.3 per 100,000 (14th lowest)
> Total COVID-19 hospital admissions since Aug.1, 2020: 1,649.6 per 100,000 (18th lowest)
> Total COVID-19 deaths since January 2020: 256.0 per 100,000 (9th lowest)
> Current COVID-19 test positivity rate: 14.2% (14th highest)
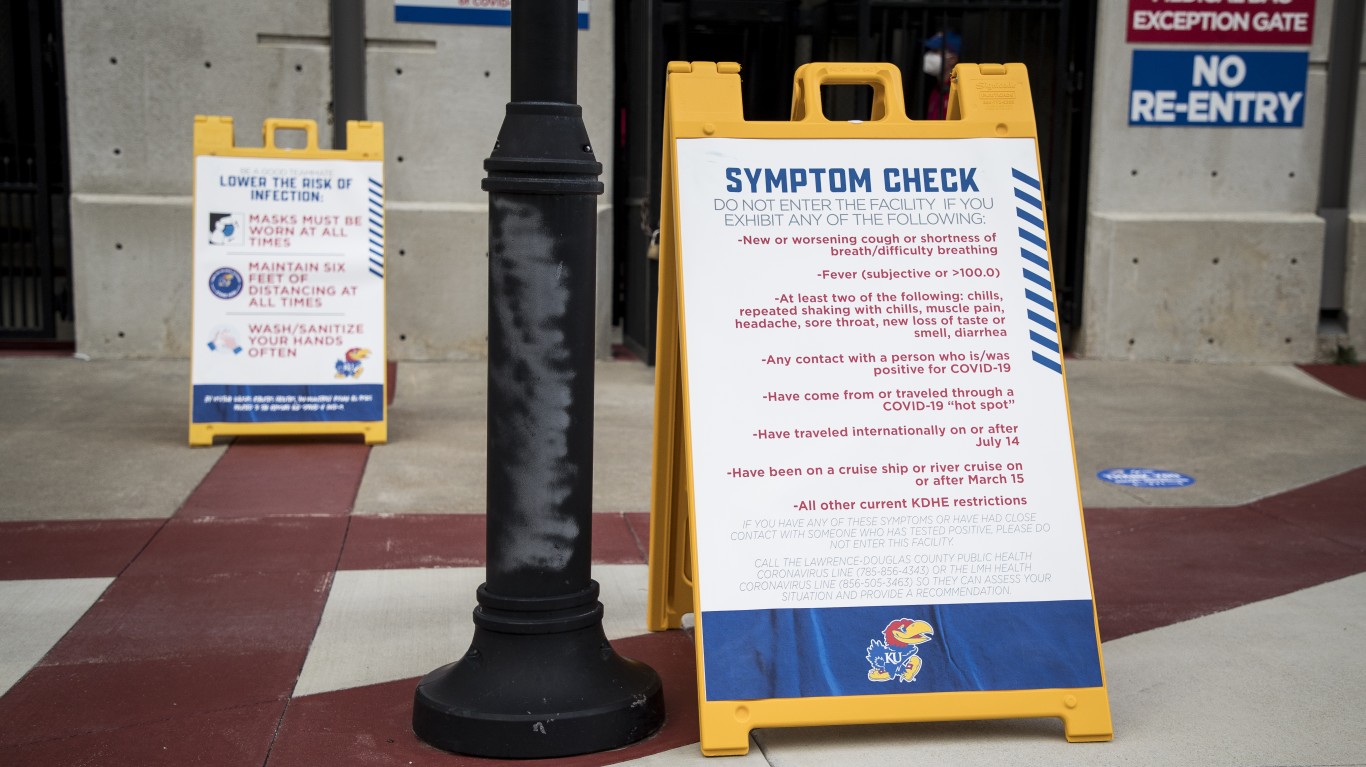
27. Kansas
> Projected COVID-19 hospital admissions, week ending Oct. 2, 2023: 4.9 per 100,000 (144 total)
> COVID-19 hospital admissions, week ending Aug. 26, 2023: 3.7 per 100,000 (23rd lowest)
> Total COVID-19 hospital admissions since Aug.1, 2020: 1,933.8 per 100,000 (20th highest)
> Total COVID-19 deaths since January 2020: 360.3 per 100,000 (22nd highest)
> Current COVID-19 test positivity rate: 14.9% (10th highest)
[in-text-ad-2]

26. Washington
> Projected COVID-19 hospital admissions, week ending Oct. 2, 2023: 4.9 per 100,000 (384 total)
> COVID-19 hospital admissions, week ending Aug. 26, 2023: 3.7 per 100,000 (22nd lowest)
> Total COVID-19 hospital admissions since Aug.1, 2020: 978.5 per 100,000 (2nd lowest)
> Total COVID-19 deaths since January 2020: 192.8 per 100,000 (4th lowest)
> Current COVID-19 test positivity rate: 12.9% (17th lowest)

25. Rhode Island
> Projected COVID-19 hospital admissions, week ending Oct. 2, 2023: 4.9 per 100,000 (54 total)
> COVID-19 hospital admissions, week ending Aug. 26, 2023: 3.1 per 100,000 (10th lowest)
> Total COVID-19 hospital admissions since Aug.1, 2020: 1,192.4 per 100,000 (5th lowest)
> Total COVID-19 deaths since January 2020: 363.5 per 100,000 (20th highest)
> Current COVID-19 test positivity rate: 10.4% (8th lowest)
[in-text-ad]

24. Maryland
> Projected COVID-19 hospital admissions, week ending Oct. 2, 2023: 5.1 per 100,000 (314 total)
> COVID-19 hospital admissions, week ending Aug. 26, 2023: 3.7 per 100,000 (24th lowest)
> Total COVID-19 hospital admissions since Aug.1, 2020: 1,546.9 per 100,000 (14th lowest)
> Total COVID-19 deaths since January 2020: 293.6 per 100,000 (16th lowest)
> Current COVID-19 test positivity rate: 12.1% (13th lowest)

23. Oregon
> Projected COVID-19 hospital admissions, week ending Oct. 2, 2023: 5.2 per 100,000 (220 total)
> COVID-19 hospital admissions, week ending Aug. 26, 2023: 4.0 per 100,000 (25th highest)
> Total COVID-19 hospital admissions since Aug.1, 2020: 1,081.5 per 100,000 (3rd lowest)
> Total COVID-19 deaths since January 2020: 219.0 per 100,000 (6th lowest)
> Current COVID-19 test positivity rate: 12.9% (17th lowest)

22. Connecticut
> Projected COVID-19 hospital admissions, week ending Oct. 2, 2023: 5.3 per 100,000 (191 total)
> COVID-19 hospital admissions, week ending Aug. 26, 2023: 5.1 per 100,000 (14th highest)
> Total COVID-19 hospital admissions since Aug.1, 2020: 1,773.8 per 100,000 (20th lowest)
> Total COVID-19 deaths since January 2020: 338.8 per 100,000 (22nd lowest)
> Current COVID-19 test positivity rate: 10.4% (8th lowest)
[in-text-ad-2]
21. North Carolina
> Projected COVID-19 hospital admissions, week ending Oct. 2, 2023: 5.5 per 100,000 (592 total)
> COVID-19 hospital admissions, week ending Aug. 26, 2023: 4.4 per 100,000 (20th highest)
> Total COVID-19 hospital admissions since Aug.1, 2020: 1,560.7 per 100,000 (16th lowest)
> Total COVID-19 deaths since January 2020: 315.7 per 100,000 (18th lowest)
> Current COVID-19 test positivity rate: 13.1% (25th lowest)

20. Massachusetts
> Projected COVID-19 hospital admissions, week ending Oct. 2, 2023: 5.6 per 100,000 (391 total)
> COVID-19 hospital admissions, week ending Aug. 26, 2023: 5.1 per 100,000 (15th highest)
> Total COVID-19 hospital admissions since Aug.1, 2020: 1,477.0 per 100,000 (13th lowest)
> Total COVID-19 deaths since January 2020: 299.4 per 100,000 (17th lowest)
> Current COVID-19 test positivity rate: 10.4% (8th lowest)
[in-text-ad]

19. Montana
> Projected COVID-19 hospital admissions, week ending Oct. 2, 2023: 5.6 per 100,000 (63 total)
> COVID-19 hospital admissions, week ending Aug. 26, 2023: 4.7 per 100,000 (18th highest)
> Total COVID-19 hospital admissions since Aug.1, 2020: 2,667.4 per 100,000 (3rd highest)
> Total COVID-19 deaths since January 2020: 344.6 per 100,000 (25th lowest)
> Current COVID-19 test positivity rate: 14.2% (14th highest)

18. Indiana
> Projected COVID-19 hospital admissions, week ending Oct. 2, 2023: 5.9 per 100,000 (405 total)
> COVID-19 hospital admissions, week ending Aug. 26, 2023: 4.1 per 100,000 (24th highest)
> Total COVID-19 hospital admissions since Aug.1, 2020: 2,030.9 per 100,000 (15th highest)
> Total COVID-19 deaths since January 2020: 379.3 per 100,000 (16th highest)
> Current COVID-19 test positivity rate: 13.5% (20th highest)

17. Missouri
> Projected COVID-19 hospital admissions, week ending Oct. 2, 2023: 6.3 per 100,000 (387 total)
> COVID-19 hospital admissions, week ending Aug. 26, 2023: 4.6 per 100,000 (19th highest)
> Total COVID-19 hospital admissions since Aug.1, 2020: 2,100.1 per 100,000 (12th highest)
> Total COVID-19 deaths since January 2020: 363.5 per 100,000 (21st highest)
> Current COVID-19 test positivity rate: 14.9% (10th highest)
[in-text-ad-2]

16. Illinois
> Projected COVID-19 hospital admissions, week ending Oct. 2, 2023: 6.3 per 100,000 (792 total)
> COVID-19 hospital admissions, week ending Aug. 26, 2023: 4.4 per 100,000 (21st highest)
> Total COVID-19 hospital admissions since Aug.1, 2020: 1,812.6 per 100,000 (23rd lowest)
> Total COVID-19 deaths since January 2020: 320.6 per 100,000 (19th lowest)
> Current COVID-19 test positivity rate: 13.5% (20th highest)

15. Virginia
> Projected COVID-19 hospital admissions, week ending Oct. 2, 2023: 6.6 per 100,000 (575 total)
> COVID-19 hospital admissions, week ending Aug. 26, 2023: 4.1 per 100,000 (23rd highest)
> Total COVID-19 hospital admissions since Aug.1, 2020: 1,388.6 per 100,000 (11th lowest)
> Total COVID-19 deaths since January 2020: 271.2 per 100,000 (10th lowest)
> Current COVID-19 test positivity rate: 12.1% (13th lowest)
[in-text-ad]

14. Texas
> Projected COVID-19 hospital admissions, week ending Oct. 2, 2023: 6.7 per 100,000 (2,008 total)
> COVID-19 hospital admissions, week ending Aug. 26, 2023: 5.5 per 100,000 (12th highest)
> Total COVID-19 hospital admissions since Aug.1, 2020: 2,015.4 per 100,000 (17th highest)
> Total COVID-19 deaths since January 2020: 340.3 per 100,000 (24th lowest)
> Current COVID-19 test positivity rate: 20.8% (the highest)

13. Kentucky
> Projected COVID-19 hospital admissions, week ending Oct. 2, 2023: 6.8 per 100,000 (309 total)
> COVID-19 hospital admissions, week ending Aug. 26, 2023: 4.9 per 100,000 (16th highest)
> Total COVID-19 hospital admissions since Aug.1, 2020: 3,438.2 per 100,000 (the highest)
> Total COVID-19 deaths since January 2020: 442.1 per 100,000 (4th highest)
> Current COVID-19 test positivity rate: 13.1% (25th lowest)

12. Tennessee
> Projected COVID-19 hospital admissions, week ending Oct. 2, 2023: 6.9 per 100,000 (485 total)
> COVID-19 hospital admissions, week ending Aug. 26, 2023: 5.6 per 100,000 (11th highest)
> Total COVID-19 hospital admissions since Aug.1, 2020: 1,841.0 per 100,000 (24th lowest)
> Total COVID-19 deaths since January 2020: 406.1 per 100,000 (10th highest)
> Current COVID-19 test positivity rate: 13.1% (25th lowest)
[in-text-ad-2]

11. New York
> Projected COVID-19 hospital admissions, week ending Oct. 2, 2023: 7.0 per 100,000 (1,370 total)
> COVID-19 hospital admissions, week ending Aug. 26, 2023: 5.6 per 100,000 (10th highest)
> Total COVID-19 hospital admissions since Aug.1, 2020: 1,898.1 per 100,000 (23rd highest)
> Total COVID-19 deaths since January 2020: 412.1 per 100,000 (8th highest)
> Current COVID-19 test positivity rate: 9.6% (2nd lowest)

10. Wyoming
> Projected COVID-19 hospital admissions, week ending Oct. 2, 2023: 7.1 per 100,000 (41 total)
> COVID-19 hospital admissions, week ending Aug. 26, 2023: 5.2 per 100,000 (13th highest)
> Total COVID-19 hospital admissions since Aug.1, 2020: 1,954.3 per 100,000 (19th highest)
> Total COVID-19 deaths since January 2020: 367.9 per 100,000 (19th highest)
> Current COVID-19 test positivity rate: 14.2% (14th highest)
[in-text-ad]

9. California
> Projected COVID-19 hospital admissions, week ending Oct. 2, 2023: 7.5 per 100,000 (2,924 total)
> COVID-19 hospital admissions, week ending Aug. 26, 2023: 6.6 per 100,000 (7th highest)
> Total COVID-19 hospital admissions since Aug.1, 2020: 1,547.3 per 100,000 (15th lowest)
> Total COVID-19 deaths since January 2020: 278.6 per 100,000 (12th lowest)
> Current COVID-19 test positivity rate: 16.1% (6th highest)

8. South Carolina
> Projected COVID-19 hospital admissions, week ending Oct. 2, 2023: 7.9 per 100,000 (418 total)
> COVID-19 hospital admissions, week ending Aug. 26, 2023: 6.0 per 100,000 (9th highest)
> Total COVID-19 hospital admissions since Aug.1, 2020: 1,783.3 per 100,000 (21st lowest)
> Total COVID-19 deaths since January 2020: 402.2 per 100,000 (13th highest)
> Current COVID-19 test positivity rate: 13.1% (25th lowest)

7. Arkansas
> Projected COVID-19 hospital admissions, week ending Oct. 2, 2023: 8.5 per 100,000 (258 total)
> COVID-19 hospital admissions, week ending Aug. 26, 2023: 6.8 per 100,000 (6th highest)
> Total COVID-19 hospital admissions since Aug.1, 2020: 2,196.6 per 100,000 (8th highest)
> Total COVID-19 deaths since January 2020: 411.4 per 100,000 (9th highest)
> Current COVID-19 test positivity rate: 20.8% (the highest)
[in-text-ad-2]

6. Mississippi
> Projected COVID-19 hospital admissions, week ending Oct. 2, 2023: 8.6 per 100,000 (252 total)
> COVID-19 hospital admissions, week ending Aug. 26, 2023: 6.3 per 100,000 (8th highest)
> Total COVID-19 hospital admissions since Aug.1, 2020: 1,889.8 per 100,000 (24th highest)
> Total COVID-19 deaths since January 2020: 503.3 per 100,000 (the highest)
> Current COVID-19 test positivity rate: 13.1% (25th lowest)

5. Louisiana
> Projected COVID-19 hospital admissions, week ending Oct. 2, 2023: 9.7 per 100,000 (444 total)
> COVID-19 hospital admissions, week ending Aug. 26, 2023: 7.4 per 100,000 (3rd highest)
> Total COVID-19 hospital admissions since Aug.1, 2020: 2,075.1 per 100,000 (14th highest)
> Total COVID-19 deaths since January 2020: 384.3 per 100,000 (14th highest)
> Current COVID-19 test positivity rate: 20.8% (the highest)
[in-text-ad]

4. Georgia
> Projected COVID-19 hospital admissions, week ending Oct. 2, 2023: 10.2 per 100,000 (1,112 total)
> COVID-19 hospital admissions, week ending Aug. 26, 2023: 7.1 per 100,000 (5th highest)
> Total COVID-19 hospital admissions since Aug.1, 2020: 2,182.1 per 100,000 (9th highest)
> Total COVID-19 deaths since January 2020: 331.0 per 100,000 (20th lowest)
> Current COVID-19 test positivity rate: 13.1% (25th lowest)
3. Alabama
> Projected COVID-19 hospital admissions, week ending Oct. 2, 2023: 10.2 per 100,000 (519 total)
> COVID-19 hospital admissions, week ending Aug. 26, 2023: 7.4 per 100,000 (4th highest)
> Total COVID-19 hospital admissions since Aug.1, 2020: 2,290.4 per 100,000 (6th highest)
> Total COVID-19 deaths since January 2020: 440.3 per 100,000 (6th highest)
> Current COVID-19 test positivity rate: 13.1% (25th lowest)

2. Hawaii
> Projected COVID-19 hospital admissions, week ending Oct. 2, 2023: 10.7 per 100,000 (154 total)
> COVID-19 hospital admissions, week ending Aug. 26, 2023: 9.3 per 100,000 (2nd highest)
> Total COVID-19 hospital admissions since Aug.1, 2020: 1,338.8 per 100,000 (8th lowest)
> Total COVID-19 deaths since January 2020: 135.2 per 100,000 (the lowest)
> Current COVID-19 test positivity rate: 16.1% (6th highest)
[in-text-ad-2]

1. Florida
> Projected COVID-19 hospital admissions, week ending Oct. 2, 2023: 14.5 per 100,000 (3,235 total)
> COVID-19 hospital admissions, week ending Aug. 26, 2023: 10.8 per 100,000 (the highest)
> Total COVID-19 hospital admissions since Aug.1, 2020: 2,543.4 per 100,000 (4th highest)
> Total COVID-19 deaths since January 2020: 358.7 per 100,000 (24th highest)
> Current COVID-19 test positivity rate: 13.1% (25th lowest)
Start by taking a quick retirement quiz from SmartAsset that will match you with up to 3 financial advisors that serve your area and beyond in 5 minutes, or less.
Each advisor has been vetted by SmartAsset and is held to a fiduciary standard to act in your best interests.
Here’s how it works:
1. Answer SmartAsset advisor match quiz
2. Review your pre-screened matches at your leisure. Check out the advisors’ profiles.
3. Speak with advisors at no cost to you. Have an introductory call on the phone or introduction in person and choose whom to work with in the future
Thank you for reading! Have some feedback for us?
Contact the 24/7 Wall St. editorial team.