Car accident deaths in the U.S. are on the rise. According to the Bureau of Transportation Statistics, there were more than 5.2 million car crashes in the U.S. in 2020, resulting in 38,824 fatalities and more than 2 million injuries.
Updated statistics from the National Highway Traffic Safety Administration estimate that 42,914 people died in car crashes in 2021, a 10.5 % increase from 2020 and the highest fatality number since 2005. Early estimates for the first half of 2022 show yet another increase. (Also read: this is the worst city to drive in every state)
Some of the most deadly car crashes occur when multiple vehicles collide. 24/7 Wall St. reviewed a variety of historical sources to identify the worst car accidents since 1990. These accidents were ordered based on the estimated number of vehicles involved in the crash.
In some cases, the accidents were multiple, separate pileups that occurred in a concentrated area as the result of a specific weather condition. All of the car crashes listed occurred in the five months between November and March.
Those dangerous weather conditions range from dense fog, icy roads, and heavy rain. But the most deadly crash occurred due to a dust storm on Nov. 29, 1991 in Coalinga, California. More than 100 cars were involved, resulting in 17 deaths and 114 injuries. In Calhoun, Tennessee, on Dec. 11, 1990, fog caused 99 cars to crash, leading to 12 deaths and 42 injuries.
Luckily, in some instances, no fatalities resulted despite a massive pileup. On Feb. 14, 2014, in Willow Grove, Pennsylvania, 100 cars skidded on icy roads. Although 30 were injured, no one died. And in Los Angeles on Nov. 3, 2002, heavy fog along an interstate led to 216 collisions. Thankfully, no fatalities occurred despite 41 injuries. (Want to find a safe place to drive? Move to the safest cities to drive.)
Click here to see the worst car accidents in America since the 1990s.
25. March 31, 2013 – Carroll County, Virginia</s25. March 31, 2013 – Carroll County, Virginia
> Cars involved: 95
> Roadway: Interstate 77
> Casualties: 25 injuries, 3 deaths
> Weather conditions: Fog
[in-text-ad]
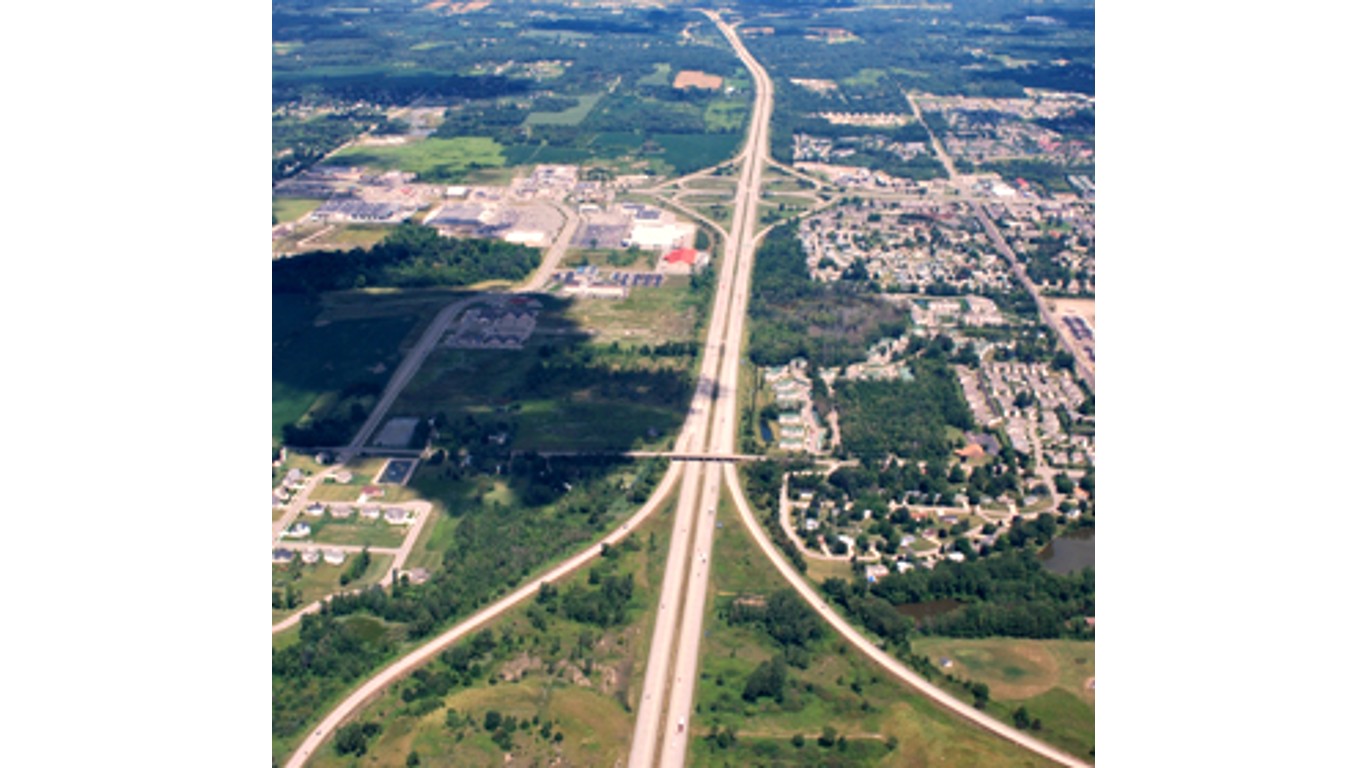
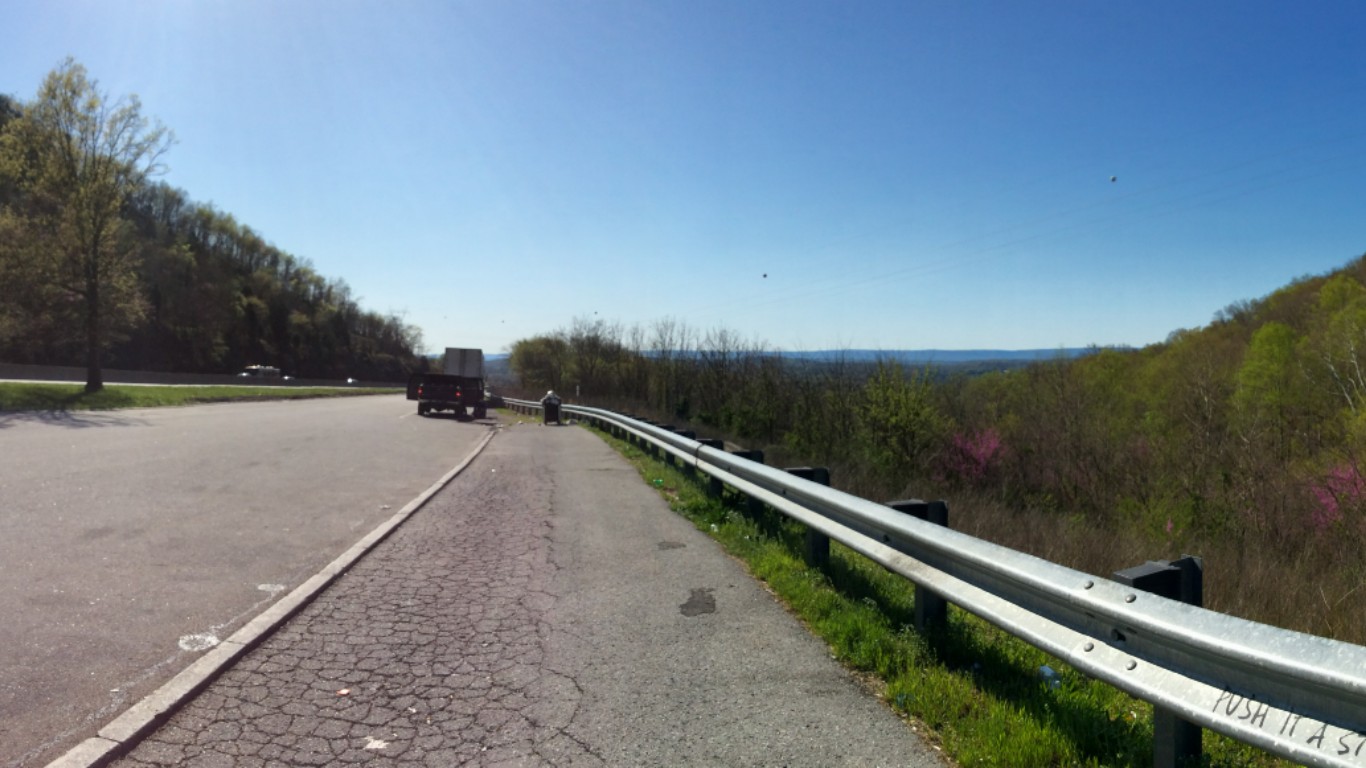
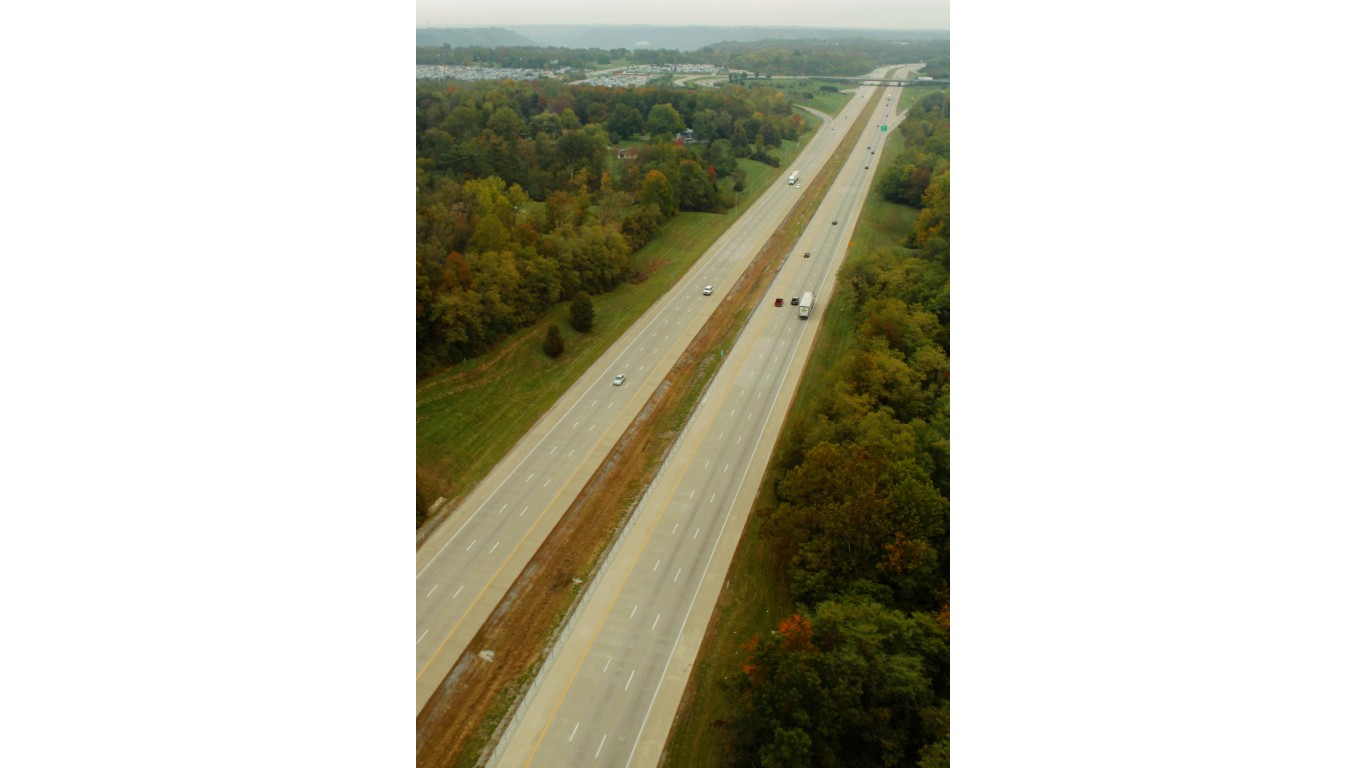
24. Dec. 11, 1990 – Calhoun, Tennessee
> Cars involved: 99
> Roadway: Interstate 75
> Casualties: 42 injuries, 12 deaths
> Weather conditions: Fog
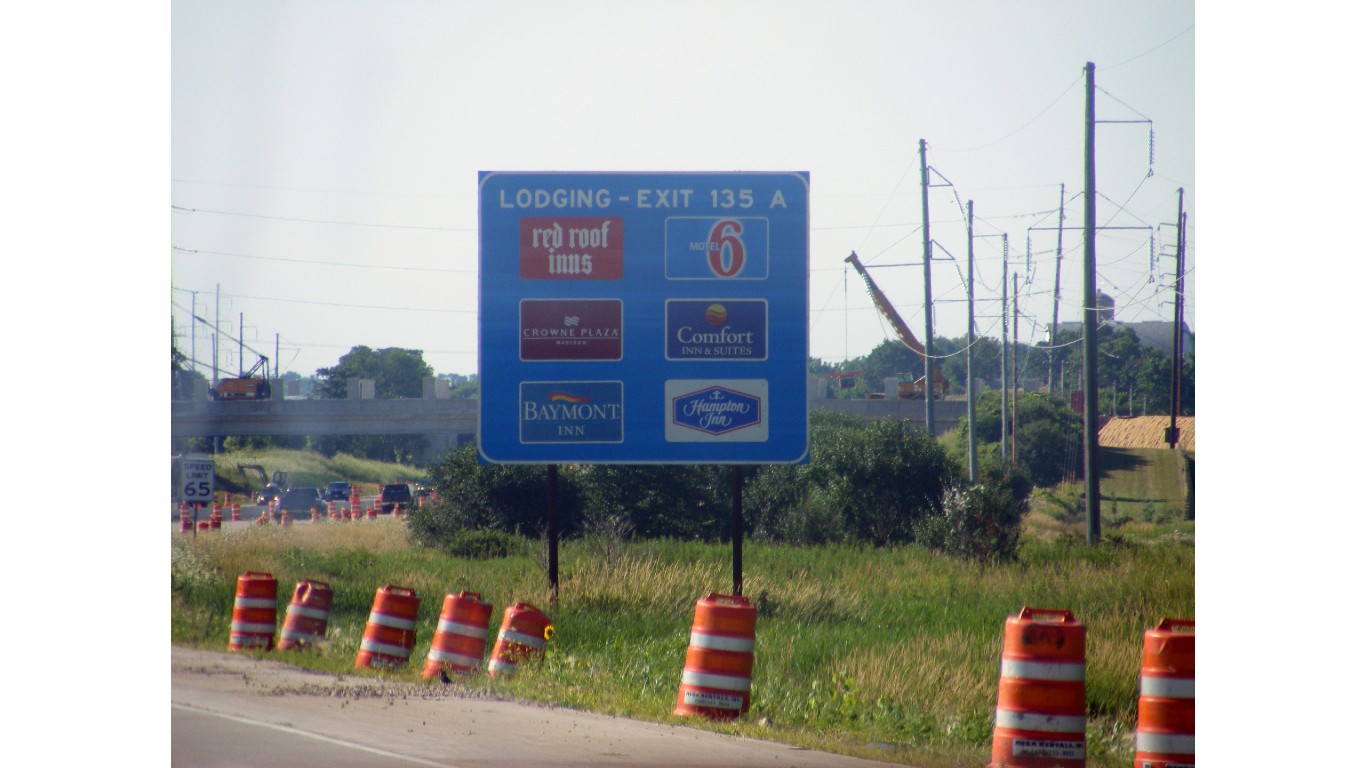
23. Jan. 6, 2008 – Madison, Wisconsin
> Cars involved: 100
> Roadway: Interstate 90
> Casualties: 50+ injuries, 2 deaths
> Weather conditions: Fog
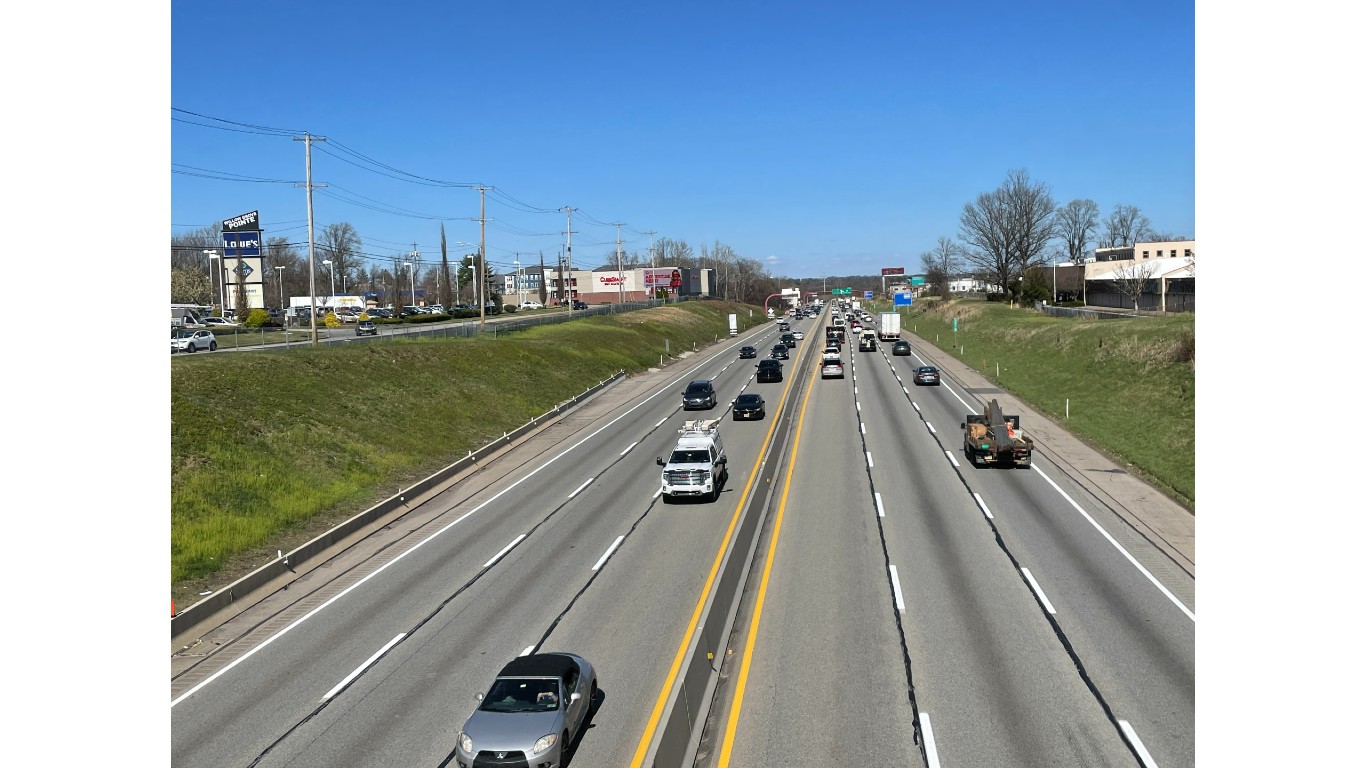
22. Feb. 14, 2014 – Willow Grove, Pennsylvania
> Cars involved: 100
> Roadway: Pennsylvania Turnpike
> Casualties: 30 injuries, 0 deaths
> Weather conditions: Icy roads
[in-text-ad-2]

21. March 5, 2019 – Hudson, Ohio
> Cars involved: 100
> Roadway: Route 8
> Casualties: 25 injuries, 0 deaths
> Weather conditions: White-out conditions, icy roads
20. Nov. 22, 2012 – Jefferson County Line, Texas
> Cars involved: 100+
> Roadway: Interstate 10
> Casualties: 100 injuries, 2 deaths
> Weather conditions: Fog
[in-text-ad]
19. Jan. 21, 2013 – Cincinnati, Ohio
> Cars involved: 103
> Roadway: Interstate 275
> Casualties: 27 injuries, 1 deaths
> Weather conditions: White-out conditions, icy roads
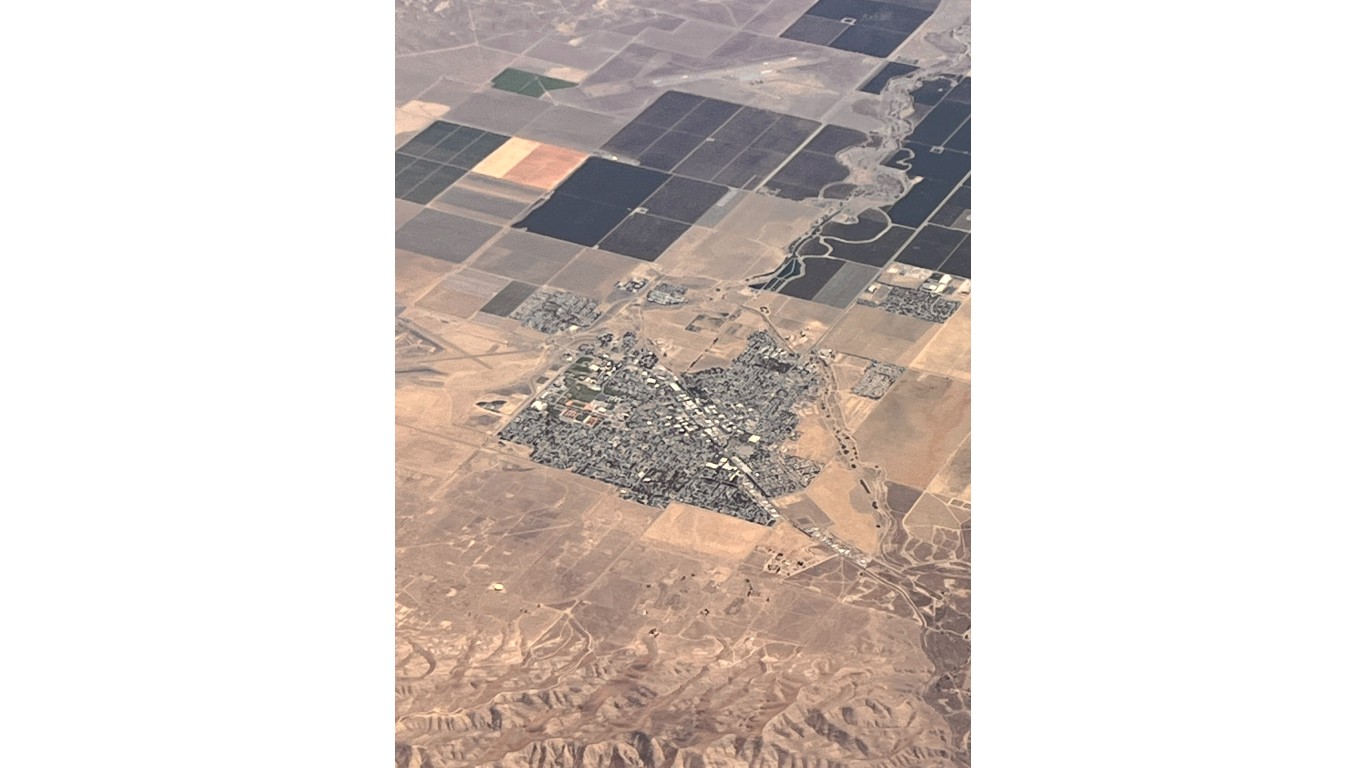
18. Nov. 29, 1991 – Coalinga, California
> Cars involved: 104
> Roadway: Interstate 5
> Casualties: 114 injuries, 17 deaths
> Weather conditions: Dust storm
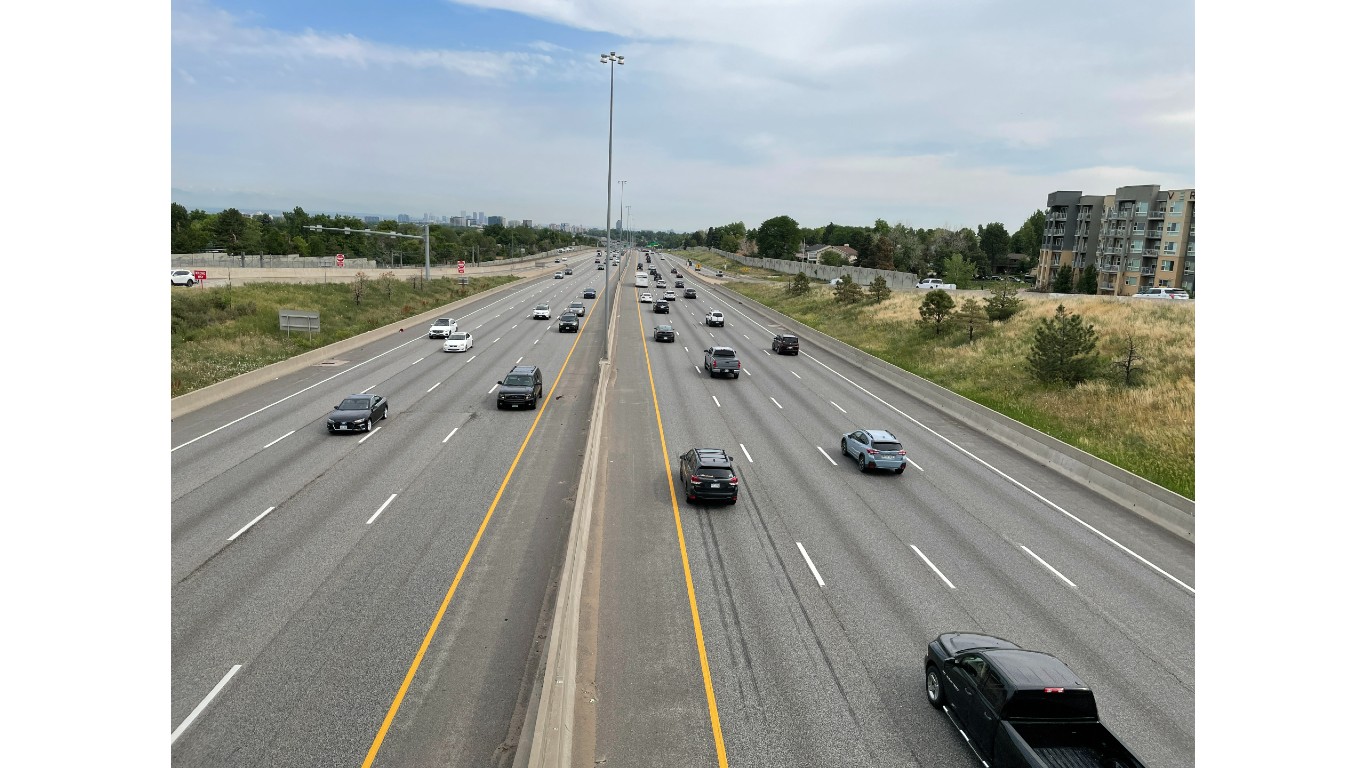
17. March 1, 2014 – Denver, Colorado
> Cars involved: 104
> Roadway: Interstate 25
> Casualties: 30 injuries, 1 deaths
> Weather conditions: Snowstorm
[in-text-ad-2]

16. Nov. 3, 2007 – Fresno, California
> Cars involved: 108
> Roadway: Highway 99
> Casualties: 36+ injuries, 2 deaths
> Weather conditions: Fog
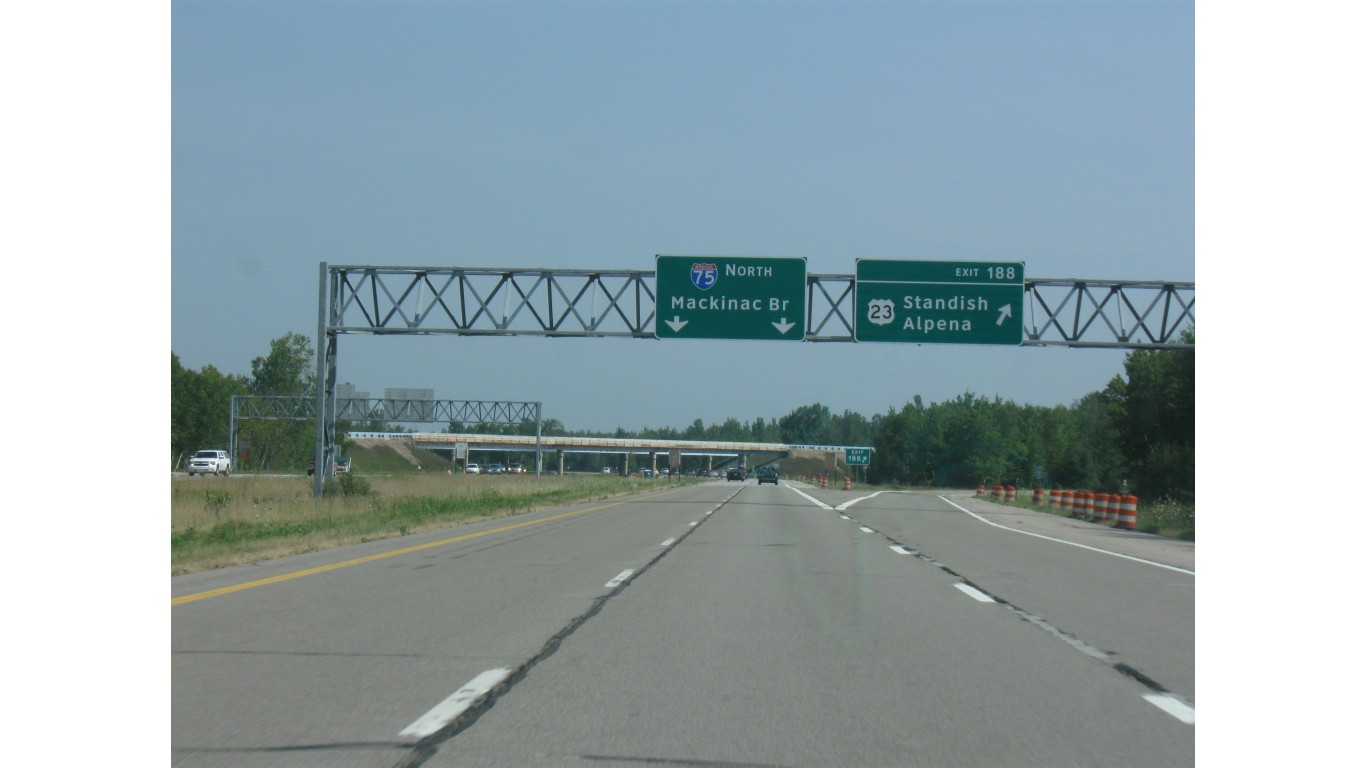
15. Dec. 31, 1998 – Grayling, Michigan
> Cars involved: 114
> Roadway: Interstate 75
> Casualties: 50 injuries, 1 deaths
> Weather conditions: White-out conditions
[in-text-ad]
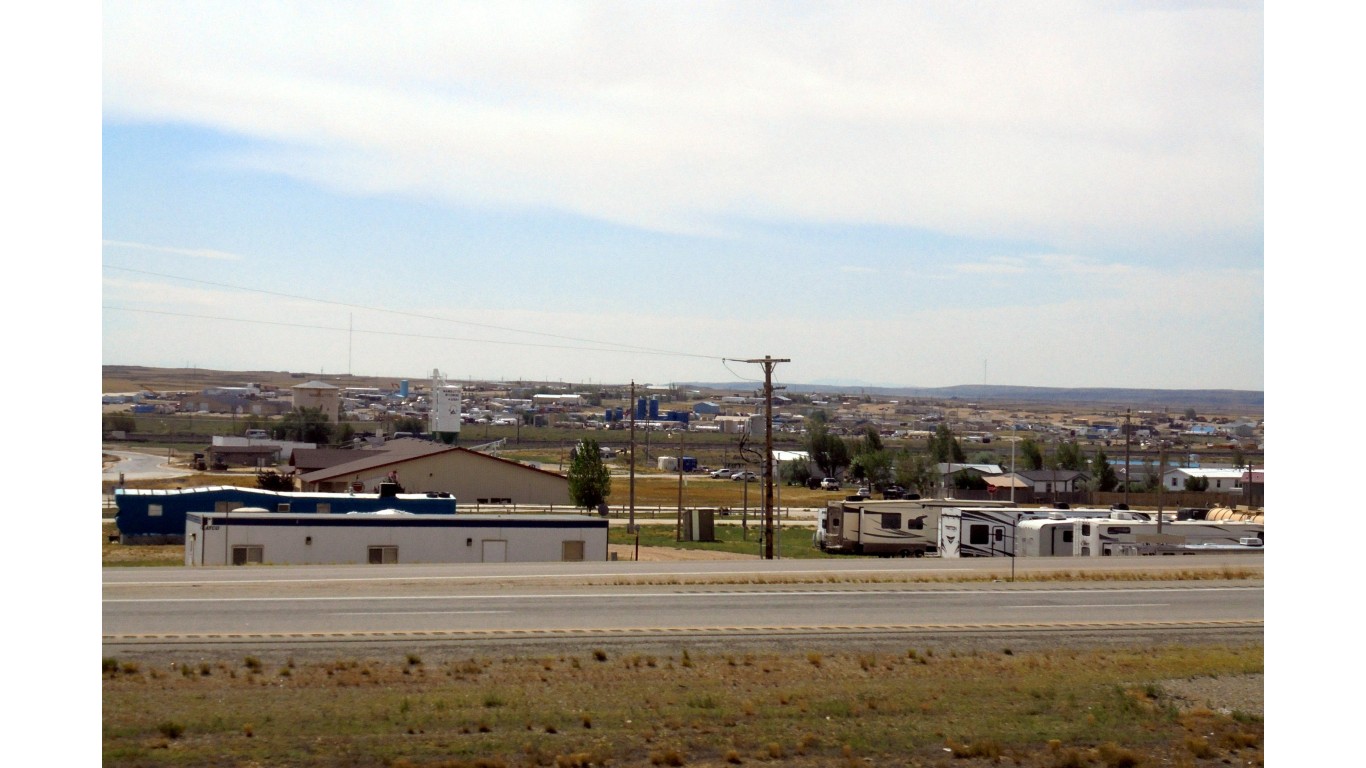
14. March 1, 2020 – Wamsutter, Wyoming
> Cars involved: 120
> Roadway: Interstate 80
> Casualties: 30 injuries, 3 deaths
> Weather conditions: White-out conditions, high winds, icy roads
13. March 14, 2002 – Catoosa County, Georgia
> Cars involved: 125
> Roadway: Interstate 75
> Casualties: 39 injuries, 4 deaths
> Weather conditions: Fog
12. Dec. 2, 1994 – San Antonio, Texas
> Cars involved: 127
> Roadway: Interstate 35
> Casualties: 67 injuries, 0 deaths
> Weather conditions: Rain
[in-text-ad-2]
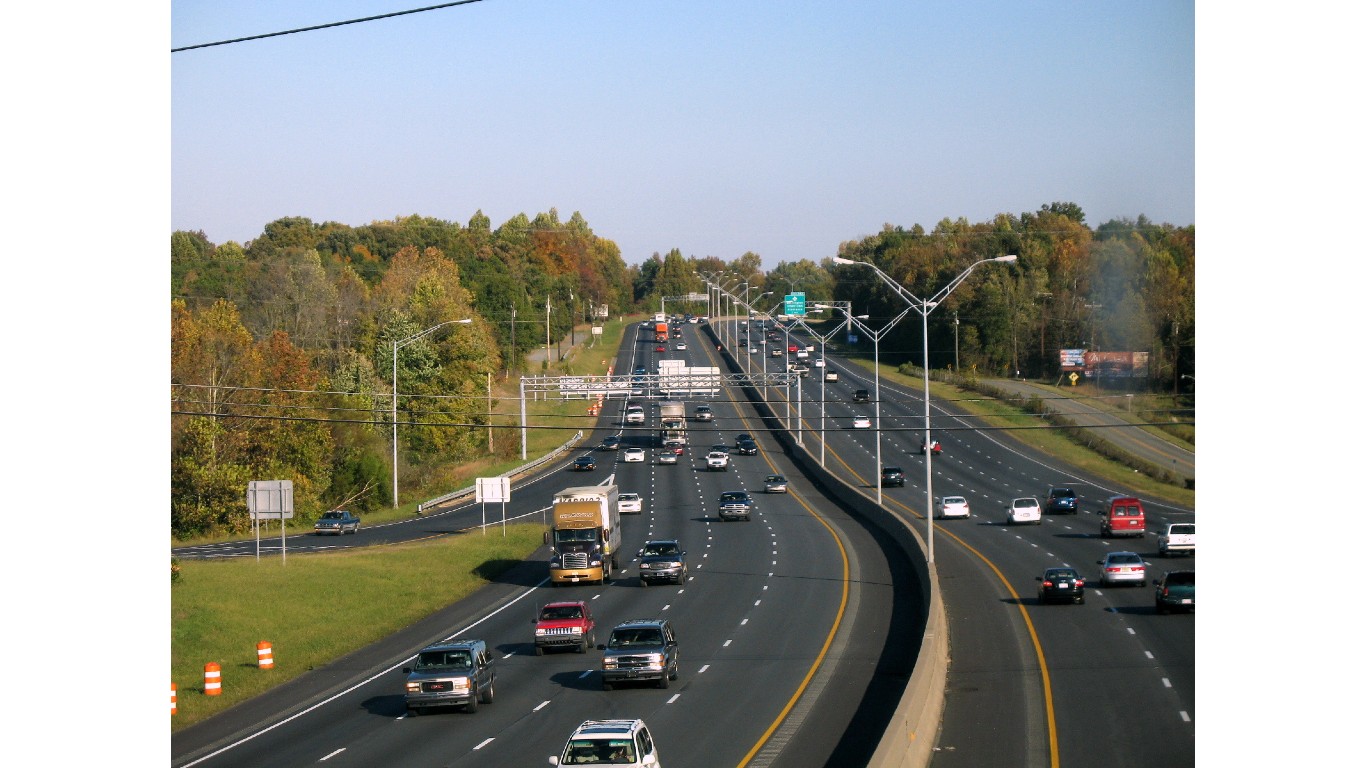
11. March 13, 2016 – Alamance County, North Carolina
> Cars involved: 130
> Roadway: Interstate 85 & 40
> Casualties: 20 injuries, 0 deaths
> Weather conditions: Sun glare, heavy rain

10. March 13, 2016 – Alamance County, North Carolina
> Cars involved: 130
> Roadway: Interstate 85/Interstate 40
> Casualties: 20 injuries, 0 deaths
> Weather conditions: Slippery roads, thunderstorms
[in-text-ad]
9. Feb. 22, 2001 – Stafford County, Virginia
> Cars involved: 131
> Roadway: Interstate 95
> Casualties: 100 injuries, 1 deaths
> Weather conditions: Icy roads
8. Feb. 24,2019 – Neenah, Wisconsin
> Cars involved: 131
> Roadway: Interstate 41
> Casualties: 71 injuries, 1 deaths
> Weather conditions: White-out conditions, winds
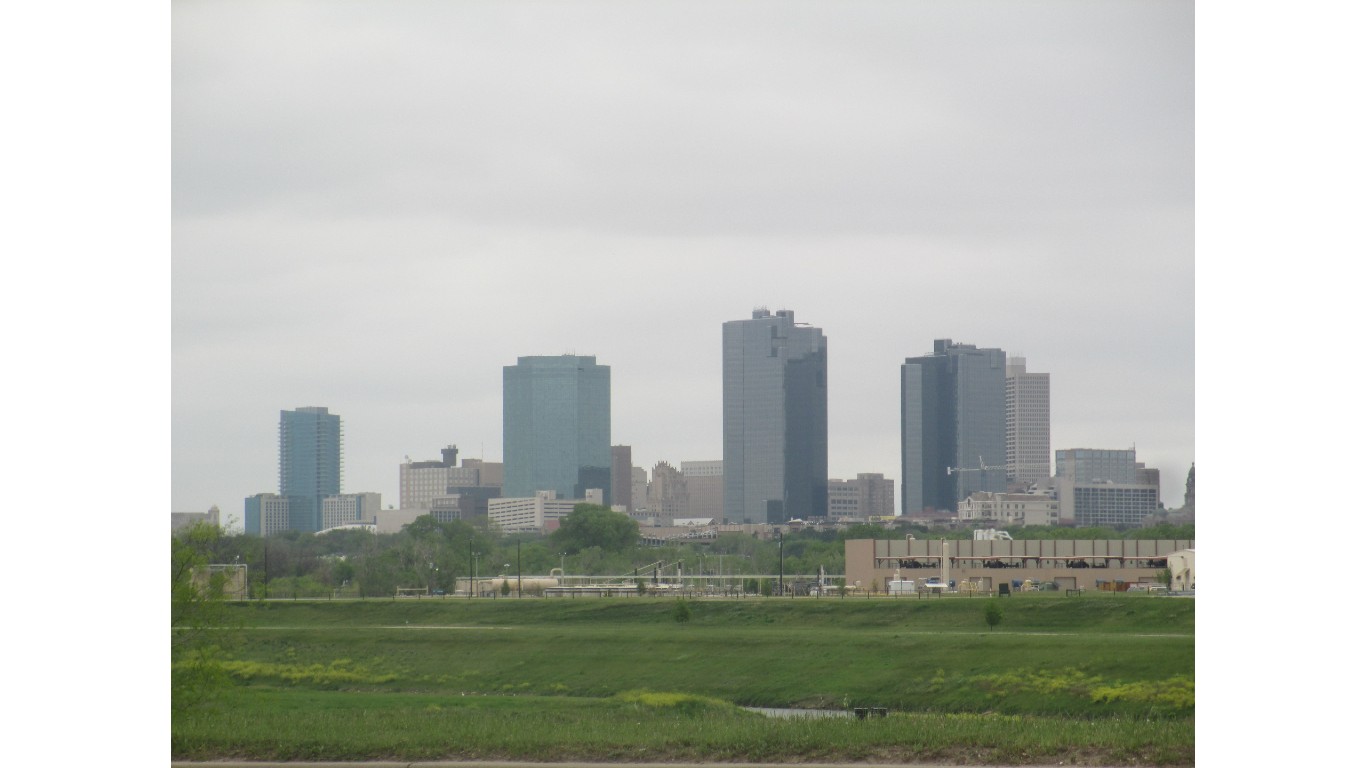
7. Feb. 11, 2021 – Fort Worth, Texas
> Cars involved: 133
> Roadway: Interstate 35W
> Casualties: 65+ injuries, 6 deaths
> Weather conditions: Freezing rain
[in-text-ad-2]
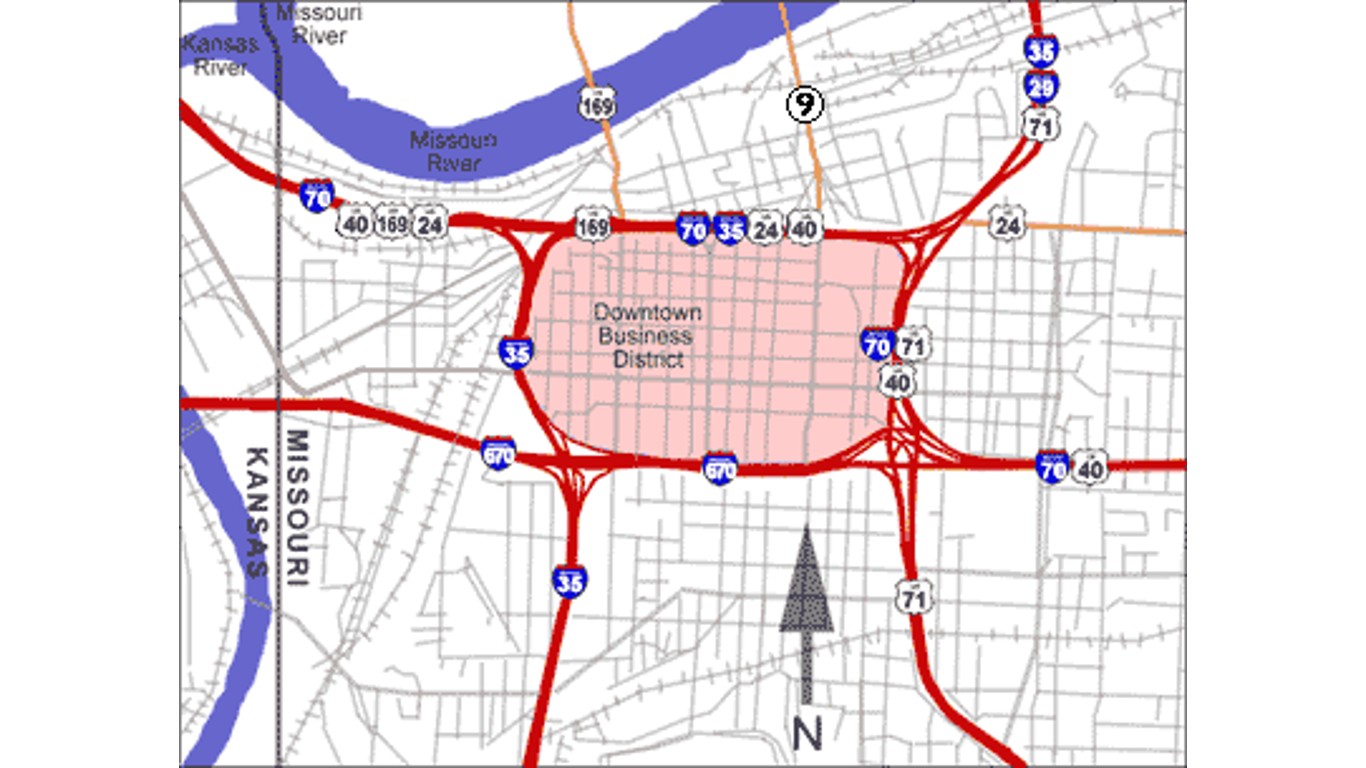
6. Feb. 14, 2010 – Kansas City, Kansas
> Cars involved: 140
> Roadway: Interstate 70
> Casualties: 13 injuries, 0 deaths
> Weather conditions: Snowstorm

5. Dec. 1, 2011 – Sumner County, Tennessee
> Cars involved: 176
> Roadway: State Route 386
> Casualties: 16-18 injuries, 1 deaths
> Weather conditions: Fog, icy roads
[in-text-ad]
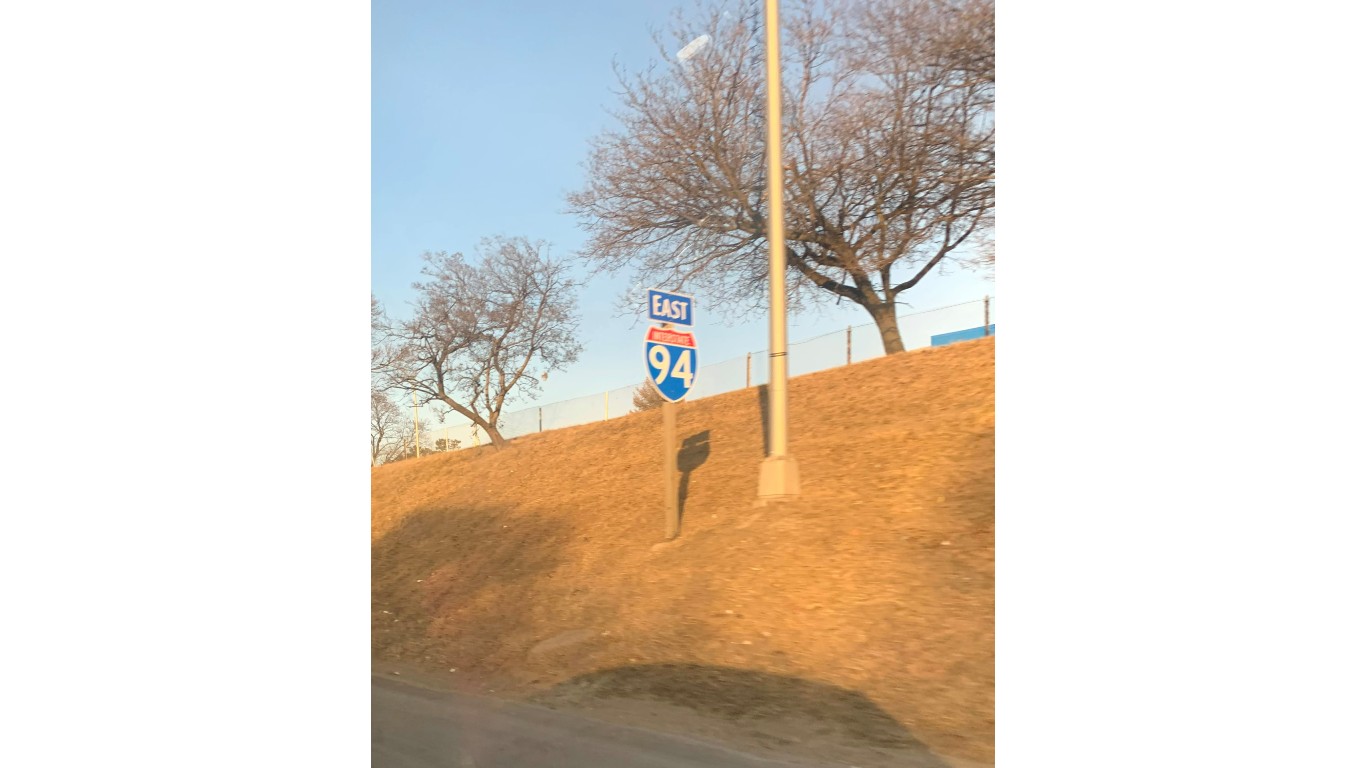
4. Jan. 9, 2015 – Galesburg, Michigan
> Cars involved: 193
> Roadway: Interstate 94
> Casualties: 23 injuries, 1 death
> Weather conditions: Truck explosion
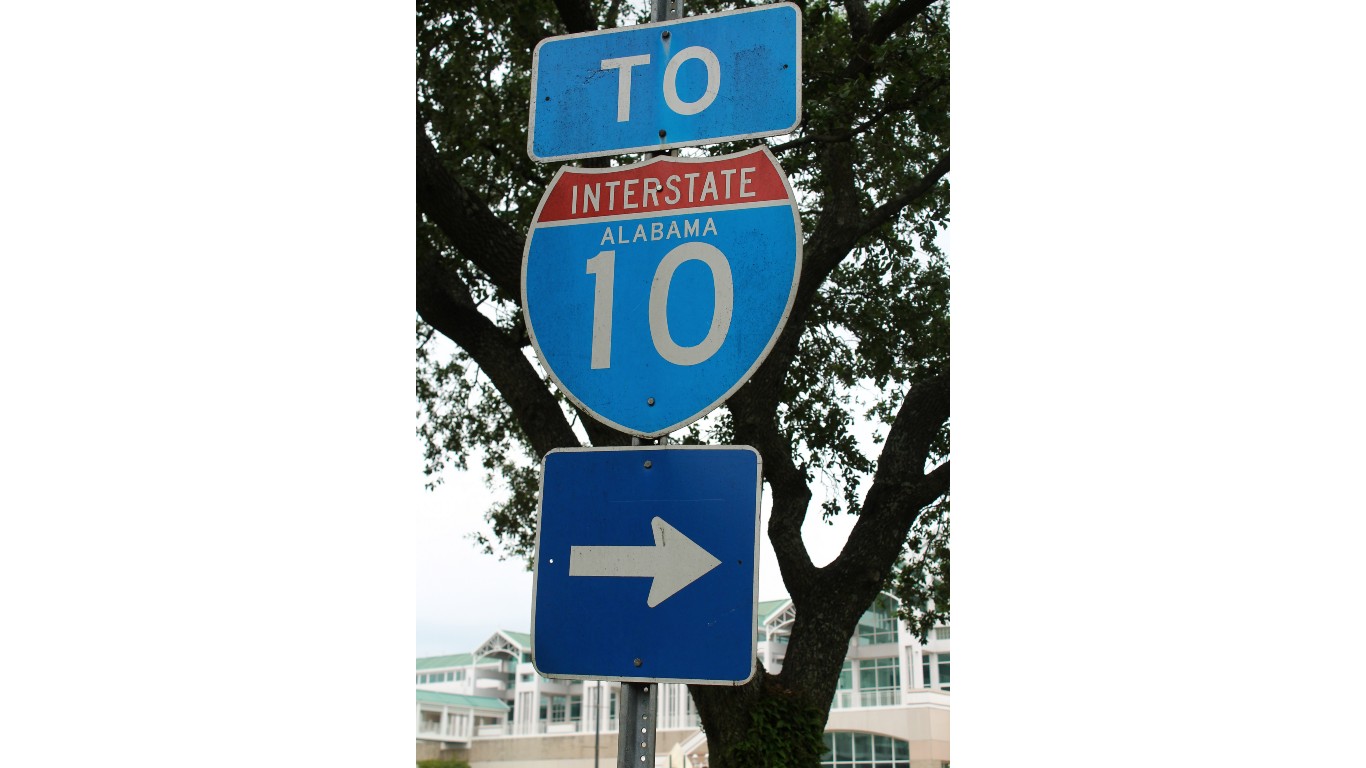
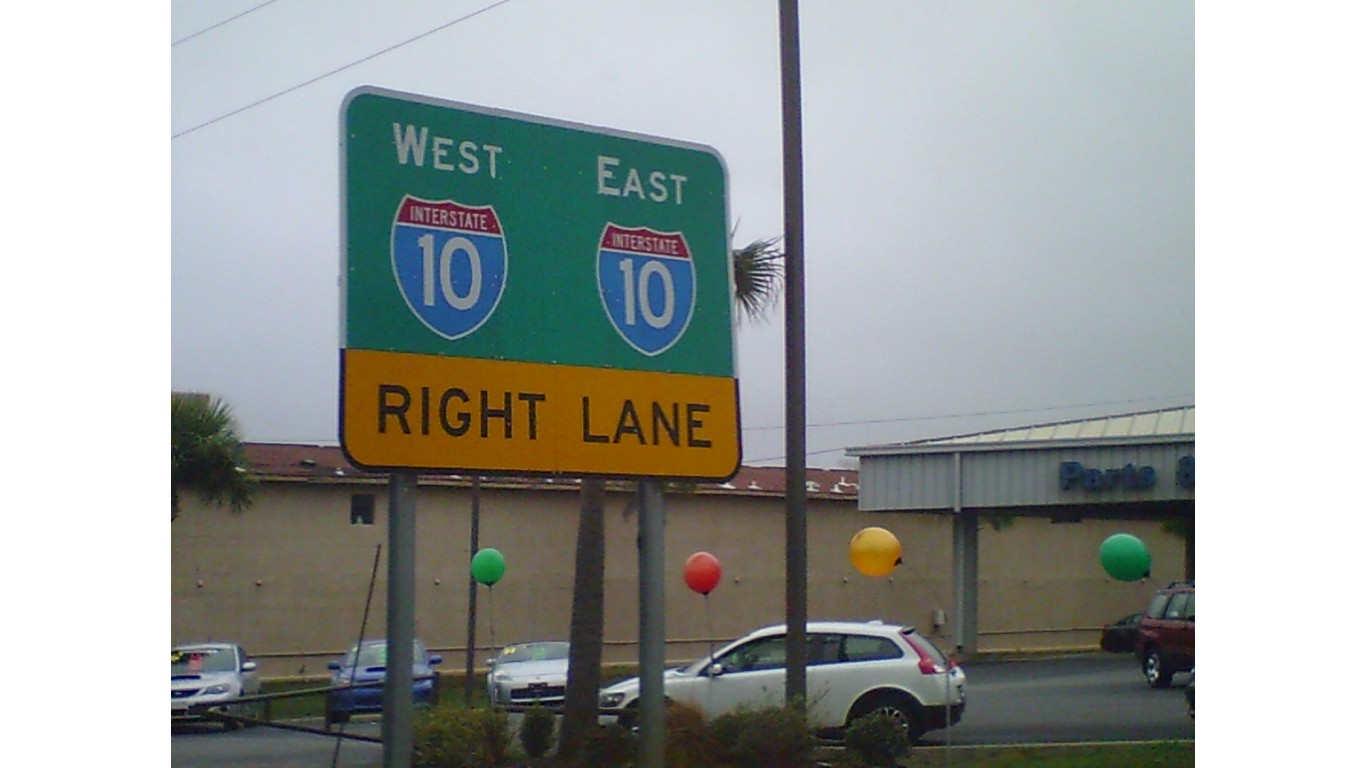
3. March 20, 1995 – Mobile, Alabama
> Cars involved: 200
> Roadway: Interstate 10
> Casualties: 90 injuries, 1 deaths
> Weather conditions: Fog
2. Jan. 12, 2005 – Ingham County, Michigan
> Cars involved: 200
> Roadway: Interstate 96
> Casualties: 35 injuries, 2 deaths
> Weather conditions: Fog
[in-text-ad-2]
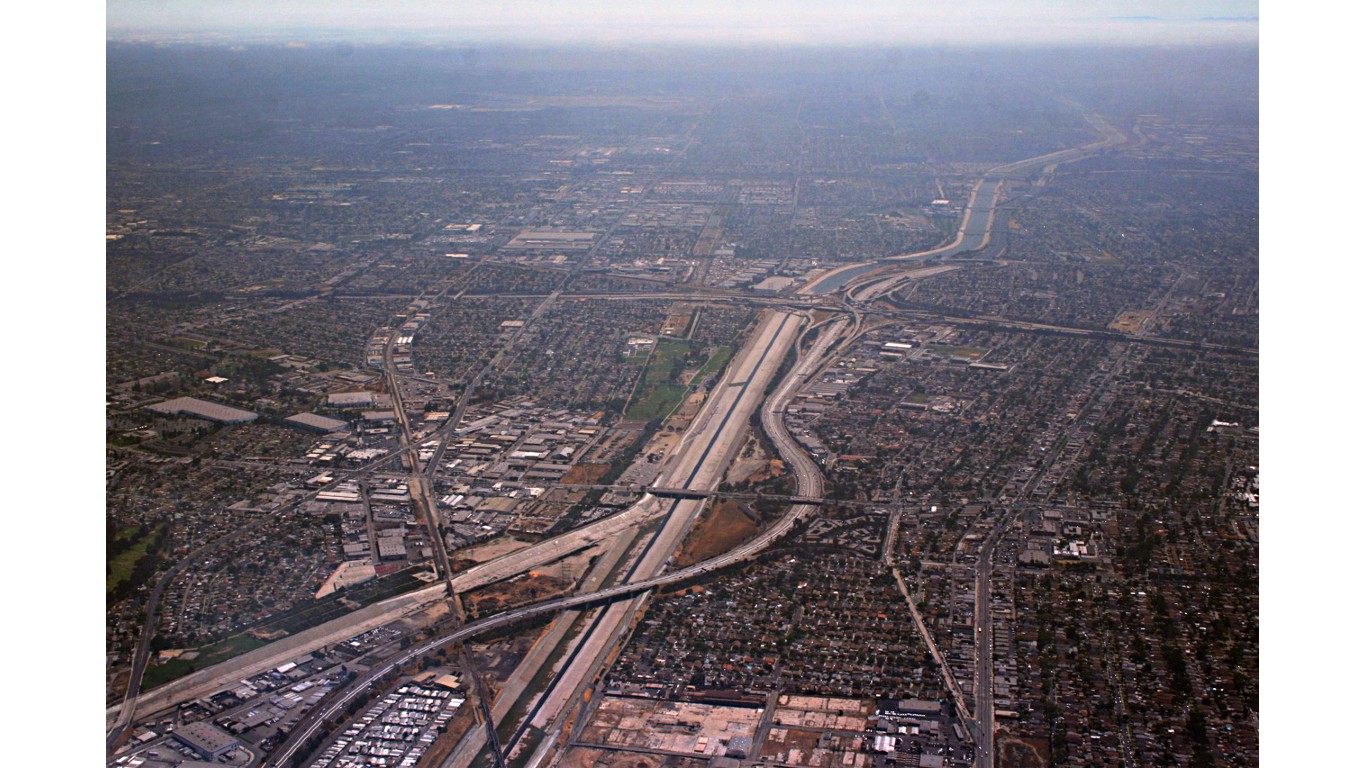
1. Nov. 3, 2002 – Los Angeles, California
> Cars involved: 216
> Roadway: Interstate 710
> Casualties: 41 injuries, 0 deaths
> Weather conditions: Fog
The Average American Is Losing Their Savings Every Day (Sponsor)
If you’re like many Americans and keep your money ‘safe’ in a checking or savings account, think again. The average yield on a savings account is a paltry .4% today, and inflation is much higher. Checking accounts are even worse.
Every day you don’t move to a high-yield savings account that beats inflation, you lose more and more value.
But there is good news. To win qualified customers, some accounts are paying 9-10x this national average. That’s an incredible way to keep your money safe, and get paid at the same time. Our top pick for high yield savings accounts includes other one time cash bonuses, and is FDIC insured.
Click here to see how much more you could be earning on your savings today. It takes just a few minutes and your money could be working for you.
Thank you for reading! Have some feedback for us?
Contact the 24/7 Wall St. editorial team.
 24/7 Wall St.
 24/7 Wall St.