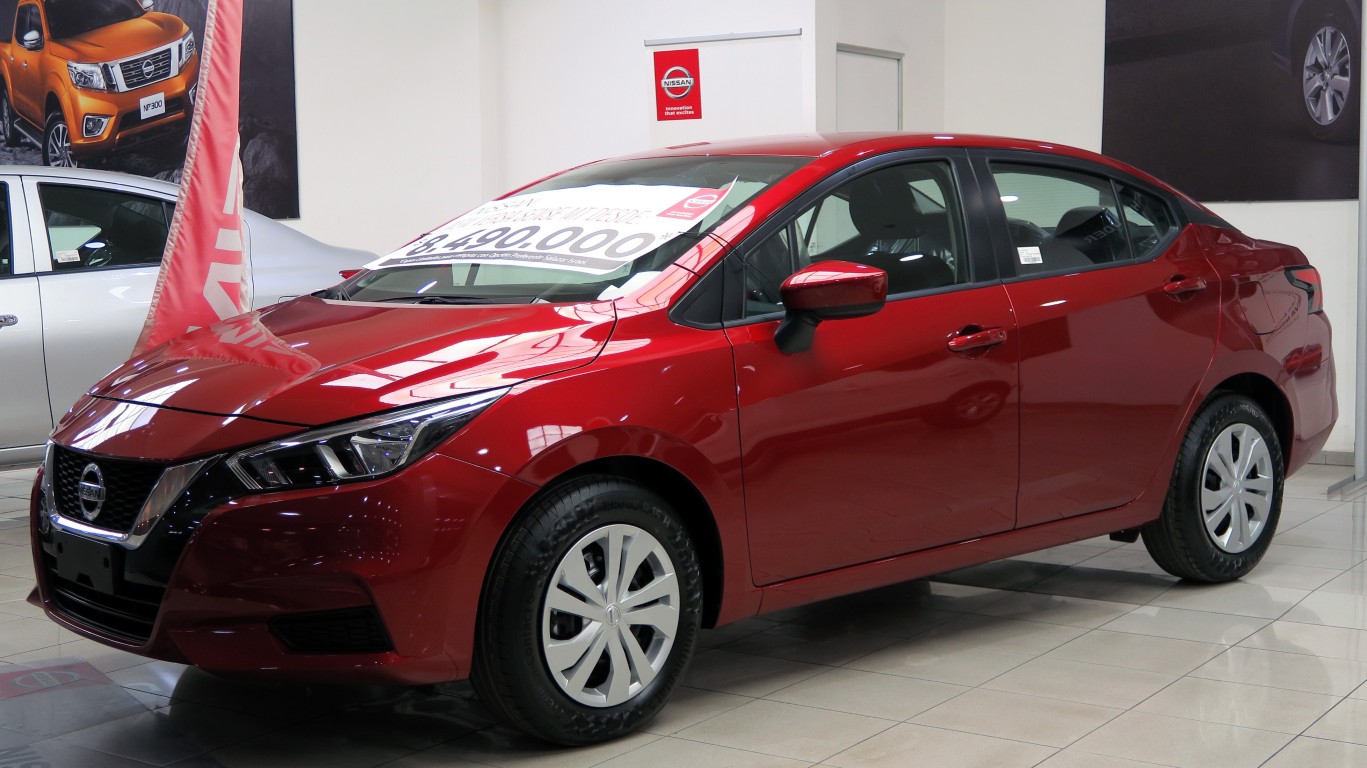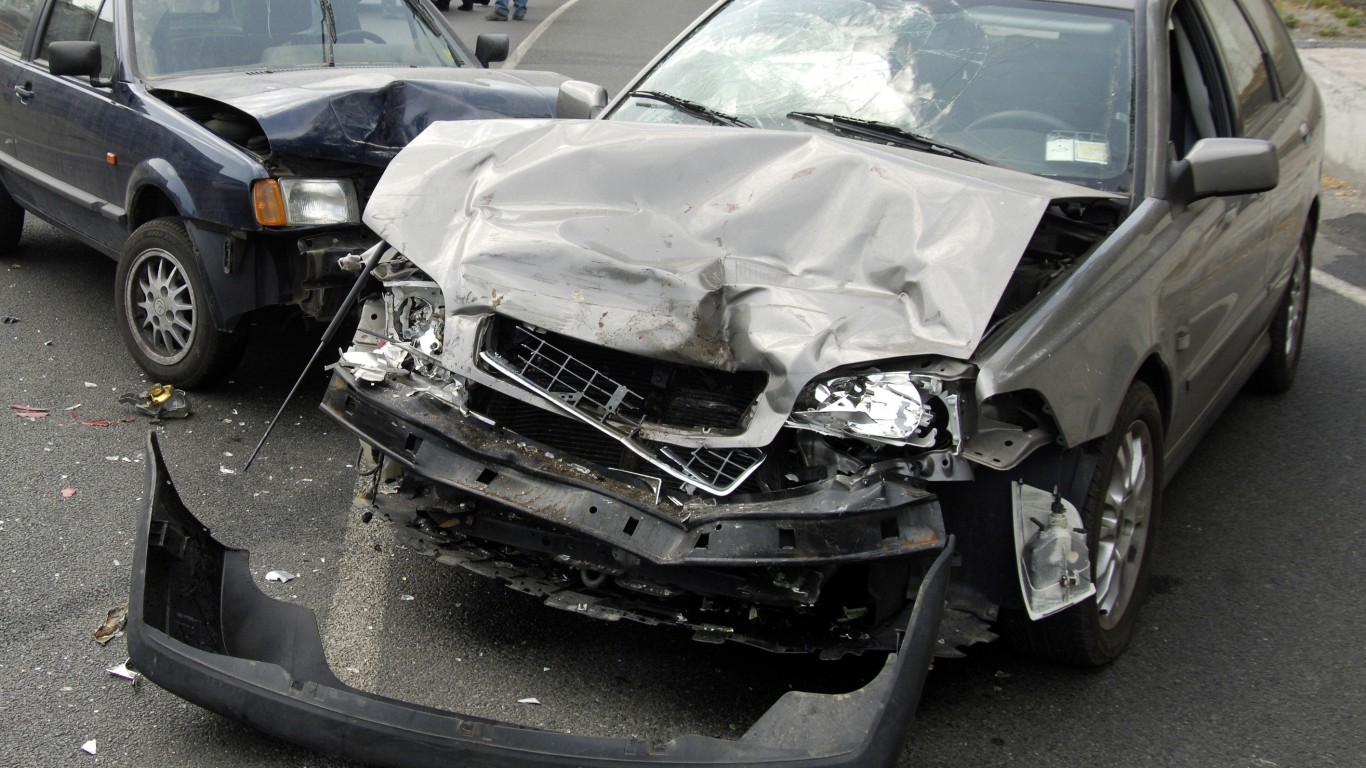
According to figures recently published by the The National Highway Traffic Safety Administration, an estimated 42,939 Americans died in motor vehicle traffic crashes in 2022. That figure is just shy of the previous year’s 42,939, which was the highest figure in more than a decade. Through the first quarter of this year, 9,330 Americans died on the road.
Not all automobiles carry the same level of risk when it comes to traffic fatalities. Despite significant advancements in car safety features over the years, there remain vehicles that fall short in safety measures. Among these vehicles, both those with poor safety grades and those with high safety ratings, some are more likely to be involved in fatal accidents.
To find the most dangerous cars in America, 24/7 Wall St. reviewed fatal car crashes data from the NHTSA and car sales data from GoodCarBadCar. Both fatal crashes and sales are from 2018-2020, with 2020 being the most recent year for which crash data is available. Crash figures are also for 2018 model year vehicles or later. Models with fewer than 100,000 cars sold in the three-year period or with no sales or crash data were excluded.
Although safety standards in vehicles have progressed significantly, resulting in rare instances of cars failing standard safety tests, several cars on this list received top ratings from safety assessment organizations. However, some of them earned mediocre or poor scores in the small overlap front crash test, developed by the nonprofit vehicle safety organization, the Insurance Institute for Highway Safety (IIHS). This test assesses the impact when the front corner of a vehicle collides with an object, as opposed to the entire front portion of the car bearing the brunt of the impact.
Interestingly, three out of the four cars with the highest fatality rates per vehicle sold fall under the category of sports sedans, often favored for their speed. Excessive speed remains one of the leading causes of motor vehicle fatalities. (Also read: these are the worst multi-vehicle car accidents in American history.)
Additionally, many of the vehicles ranking near the top of this list, indicating their involvement in a higher number of crashes, belong to the compact and subcompact categories. According to a report from the IIHS, smaller vehicles inherently pose greater risks due to their reduced mass, making them more vulnerable in collisions with larger vehicles, even if they possess favorable safety ratings.
Click here to see the deadliest cars to drive in America.
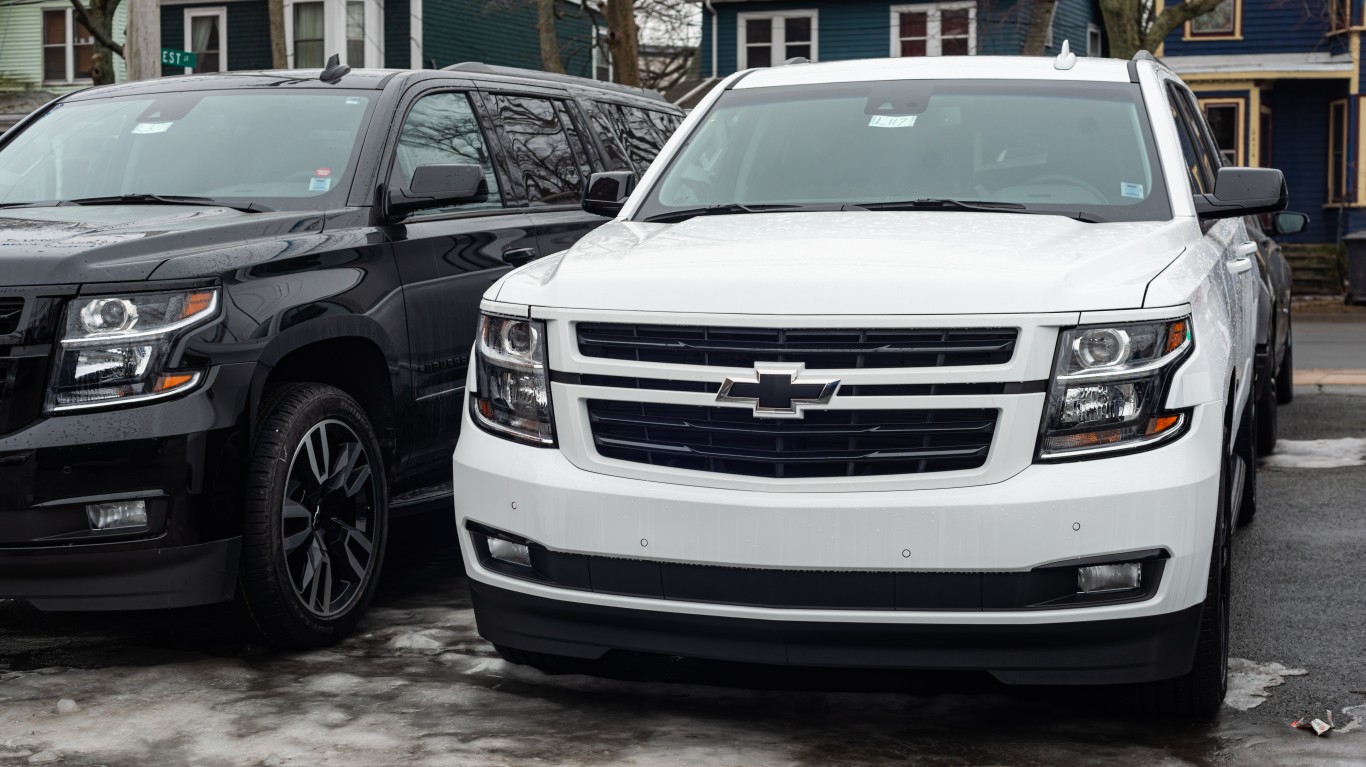
25. Chevrolet Suburban
> Fatal crashes to sales, 2018-2020: 2.3 per 10,000 sold cars
> Fatal crashes, 2018-2020: 34
> Sales, 2018-2020: 146,205
[in-text-ad]
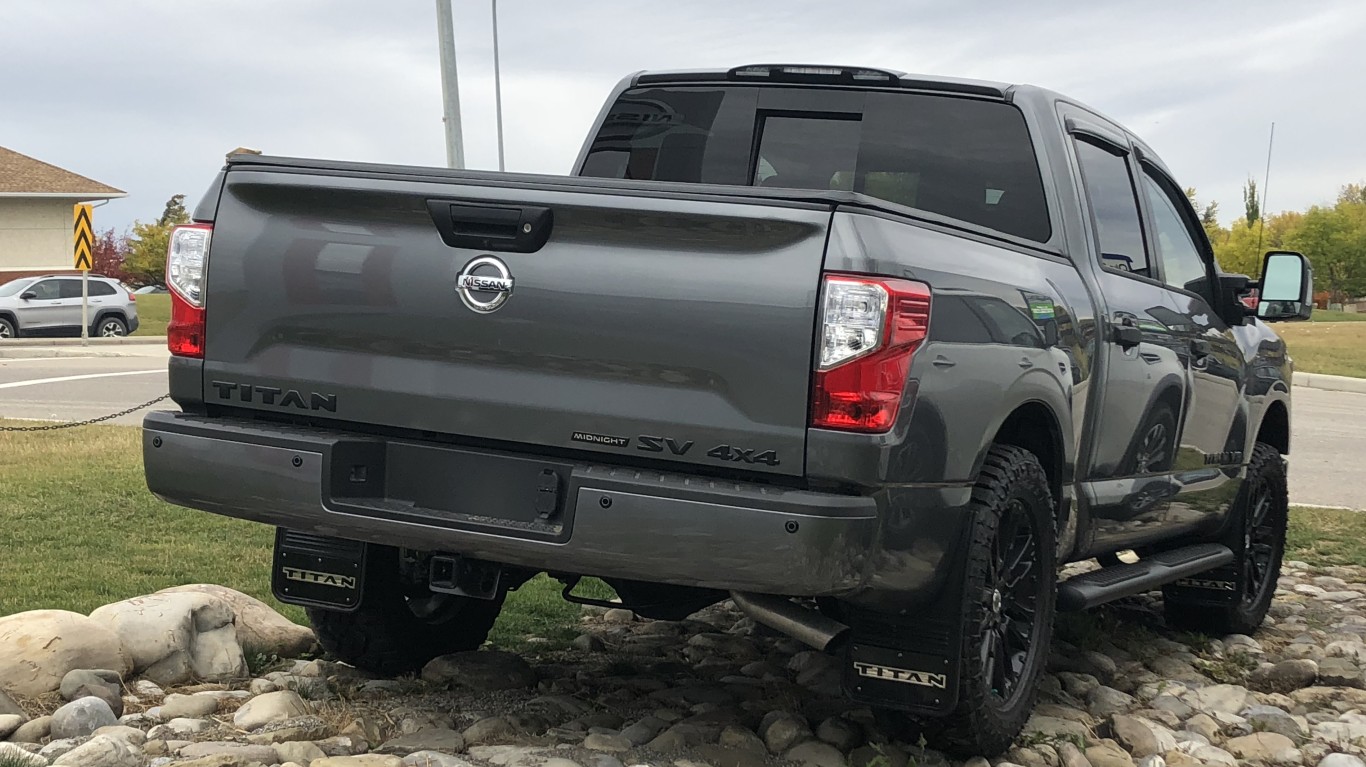
24. Nissan Titan
> Fatal crashes to sales, 2018-2020: 2.4 per 10,000 sold cars
> Fatal crashes, 2018-2020: 26
> Sales, 2018-2020: 108,414
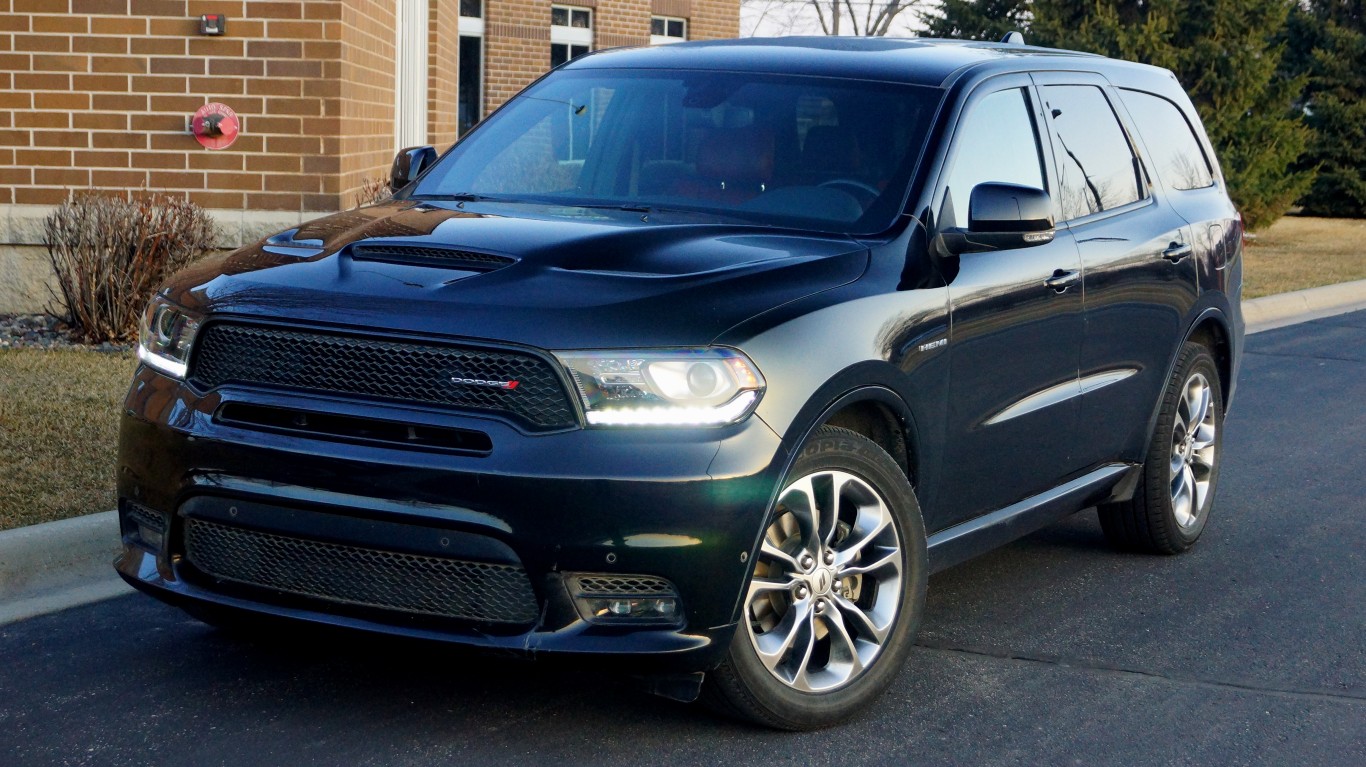
23. Dodge Durango
> Fatal crashes to sales, 2018-2020: 2.5 per 10,000 sold cars
> Fatal crashes, 2018-2020: 47
> Sales, 2018-2020: 191,373
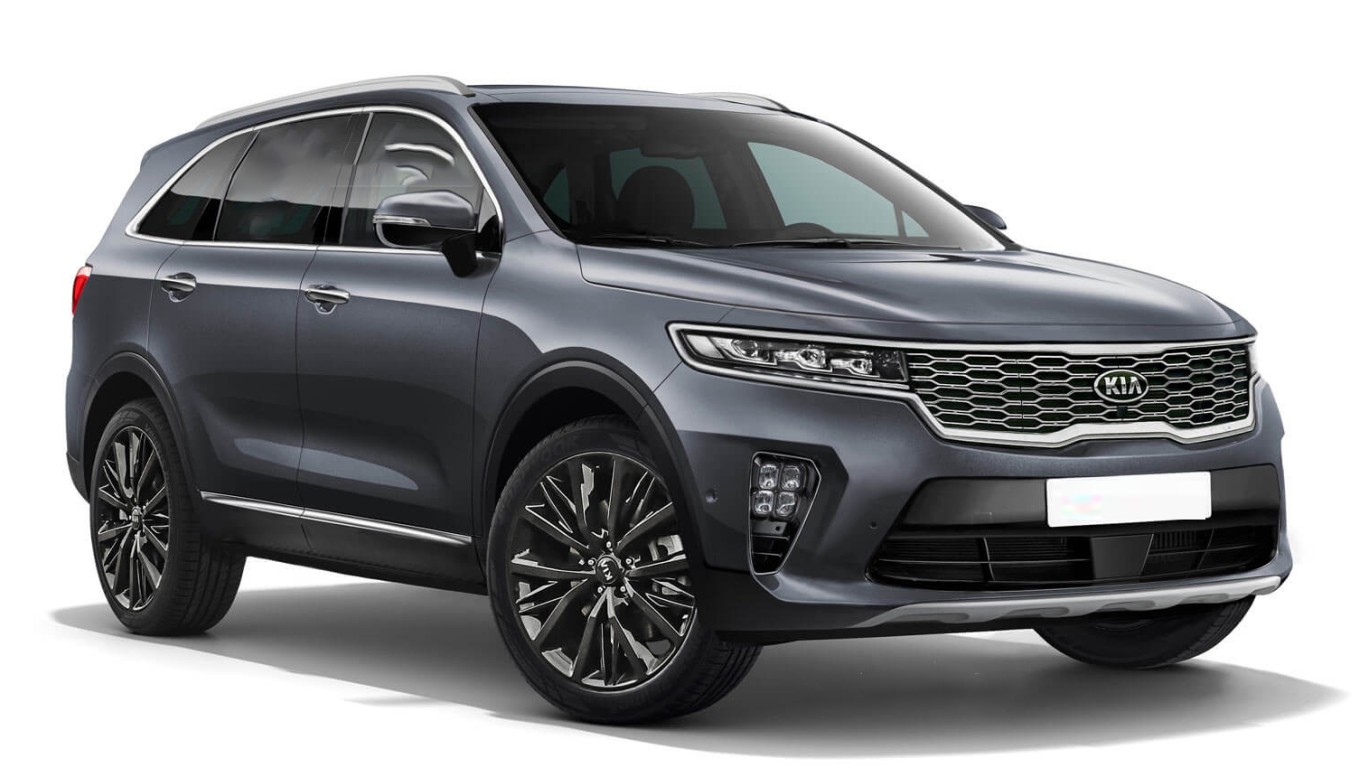
22. Kia Sorento
> Fatal crashes to sales, 2018-2020: 2.5 per 10,000 sold cars
> Fatal crashes, 2018-2020: 69
> Sales, 2018-2020: 279,054
[in-text-ad-2]
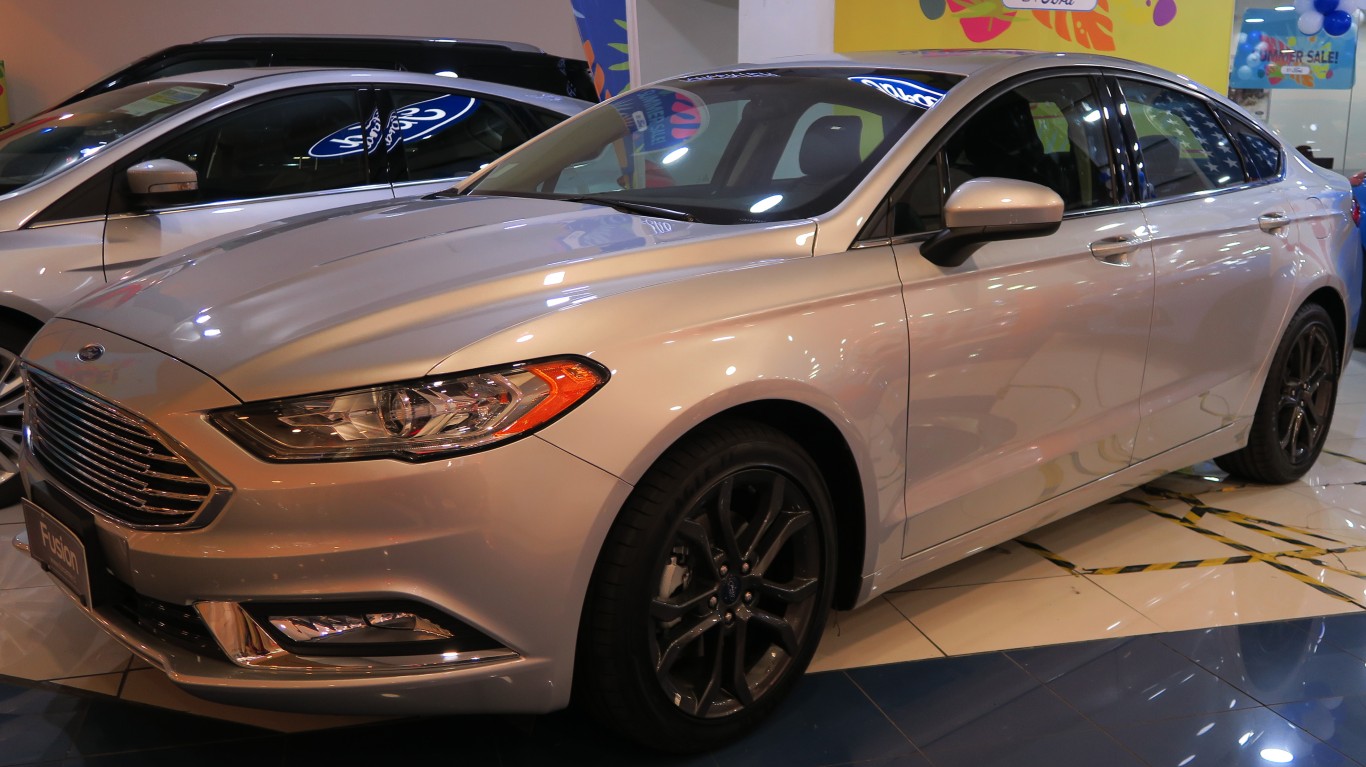
21. Ford Fusion
> Fatal crashes to sales, 2018-2020: 2.5 per 10,000 sold cars
> Fatal crashes, 2018-2020: 114
> Sales, 2018-2020: 450,310
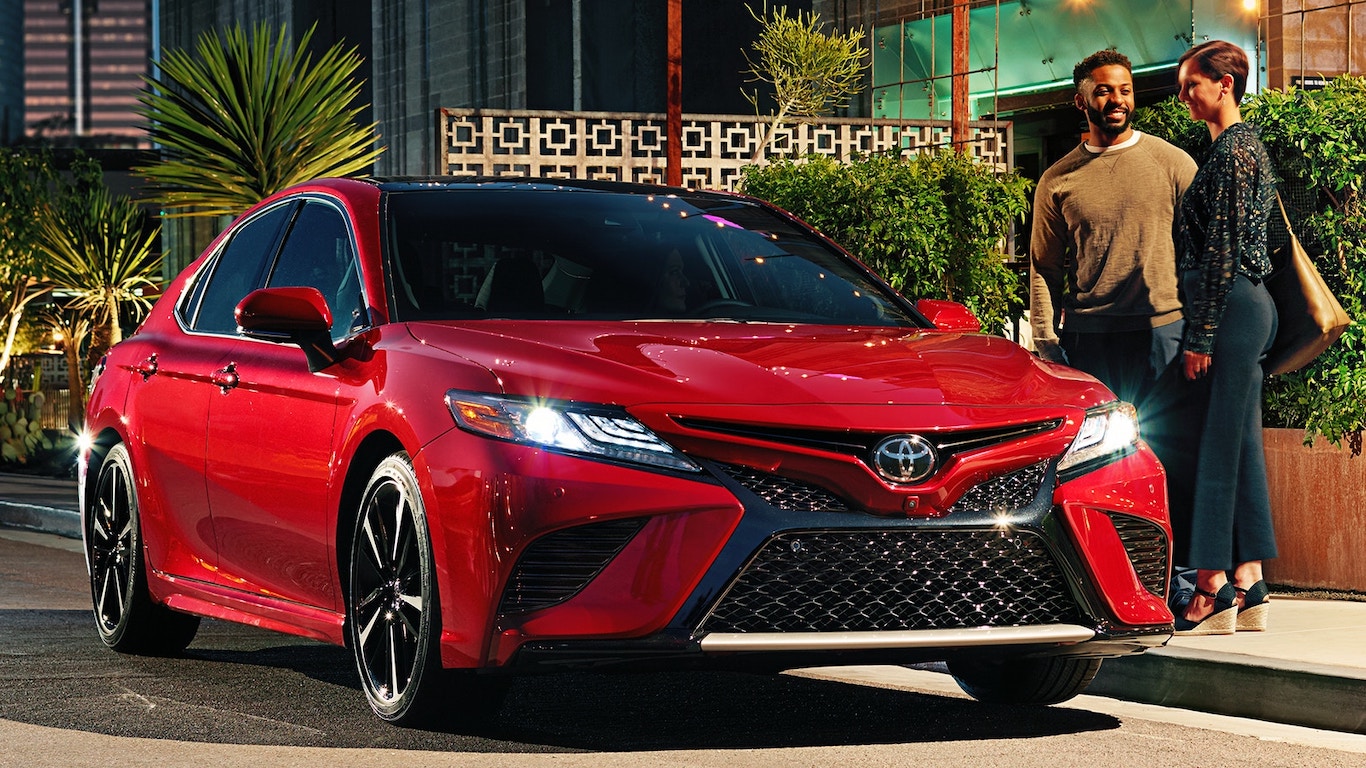
20. Toyota Camry
> Fatal crashes to sales, 2018-2020: 2.6 per 10,000 sold cars
> Fatal crashes, 2018-2020: 251
> Sales, 2018-2020: 974,765
[in-text-ad]
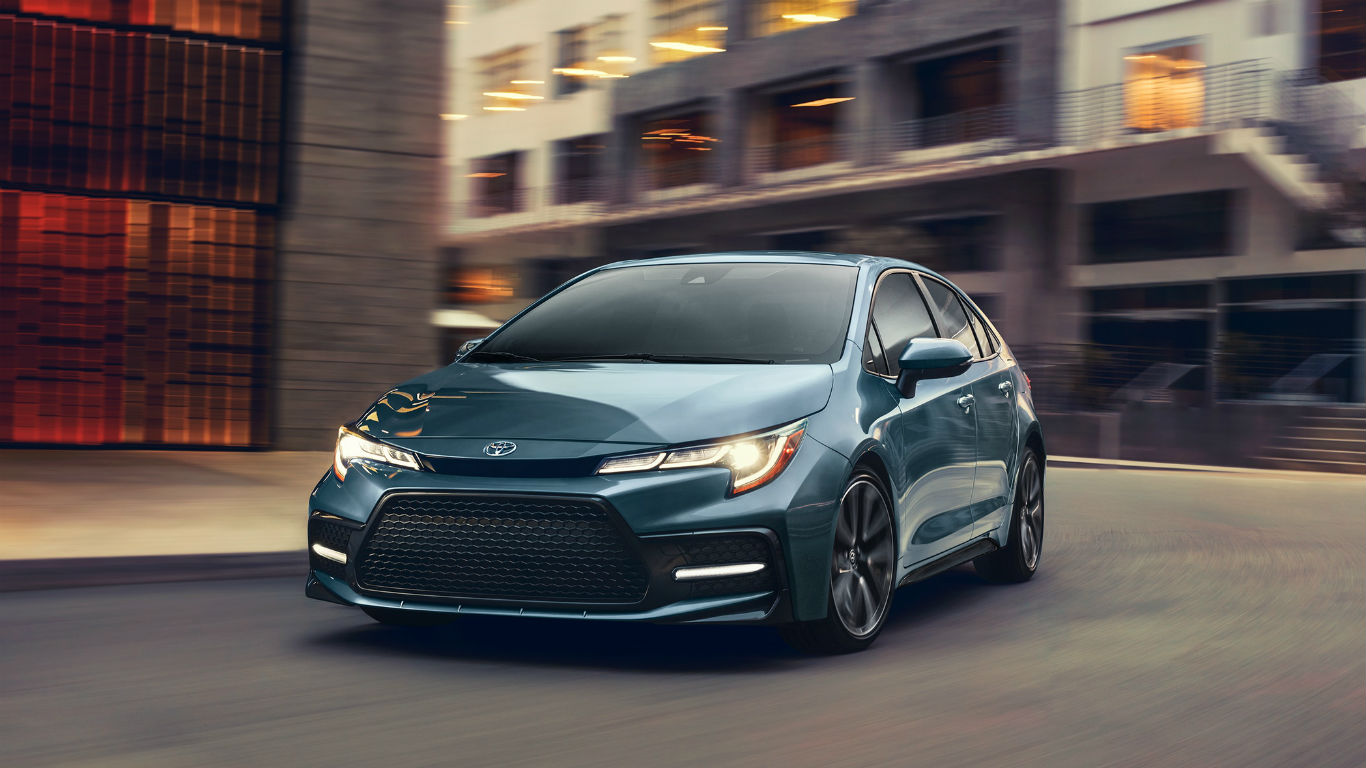
19. Toyota Corolla
> Fatal crashes to sales, 2018-2020: 2.6 per 10,000 sold cars
> Fatal crashes, 2018-2020: 219
> Sales, 2018-2020: 845,761
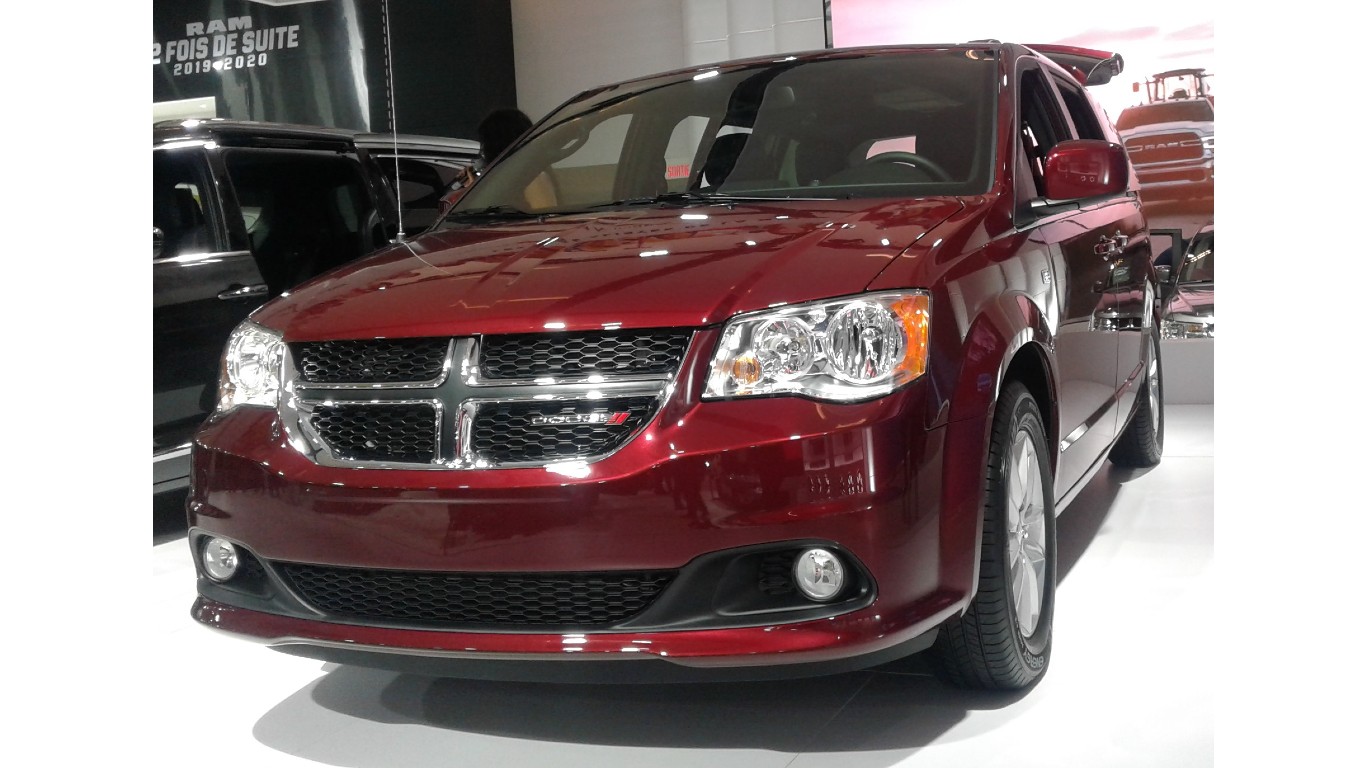
18. Dodge Grand Caravan
> Fatal crashes to sales, 2018-2020: 2.6 per 10,000 sold cars
> Fatal crashes, 2018-2020: 82
> Sales, 2018-2020: 313,340
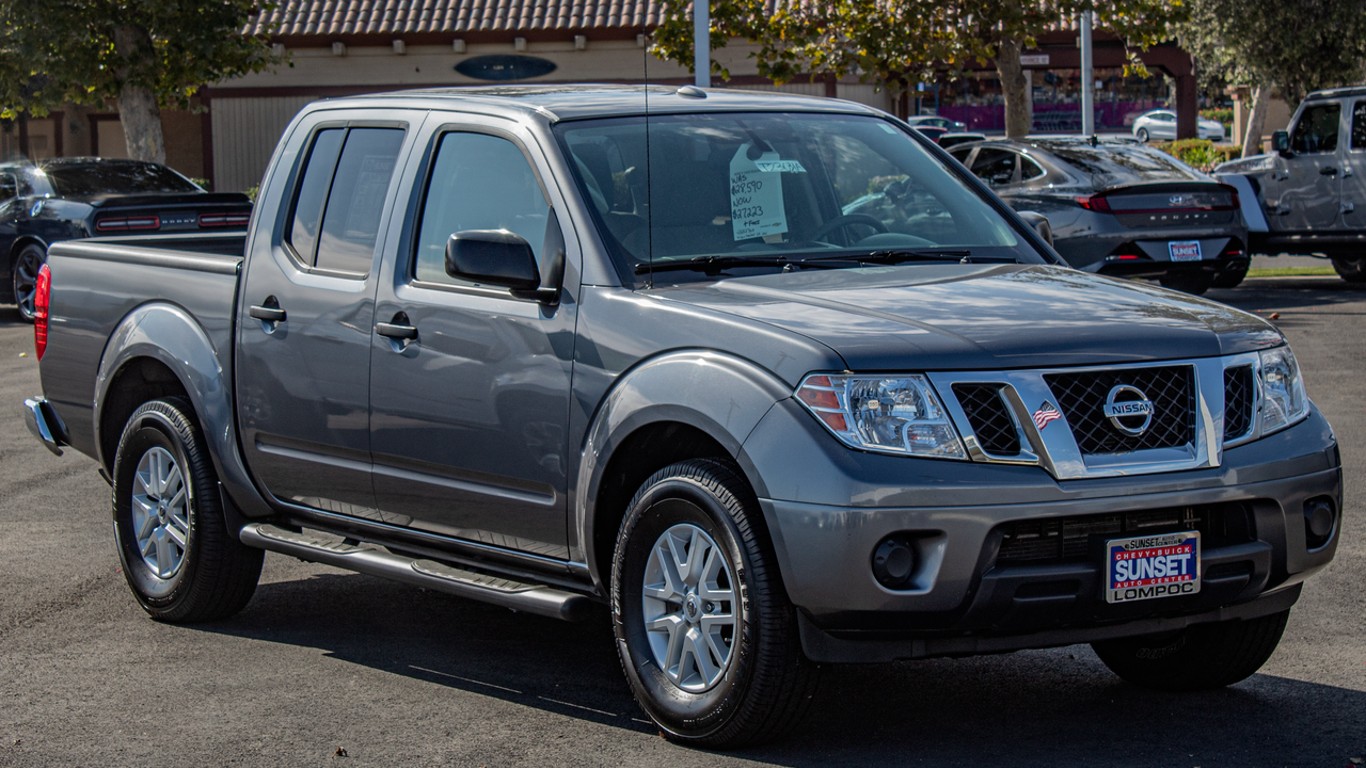
17. Nissan Frontier
> Fatal crashes to sales, 2018-2020: 2.9 per 10,000 sold cars
> Fatal crashes, 2018-2020: 60
> Sales, 2018-2020: 206,832
[in-text-ad-2]
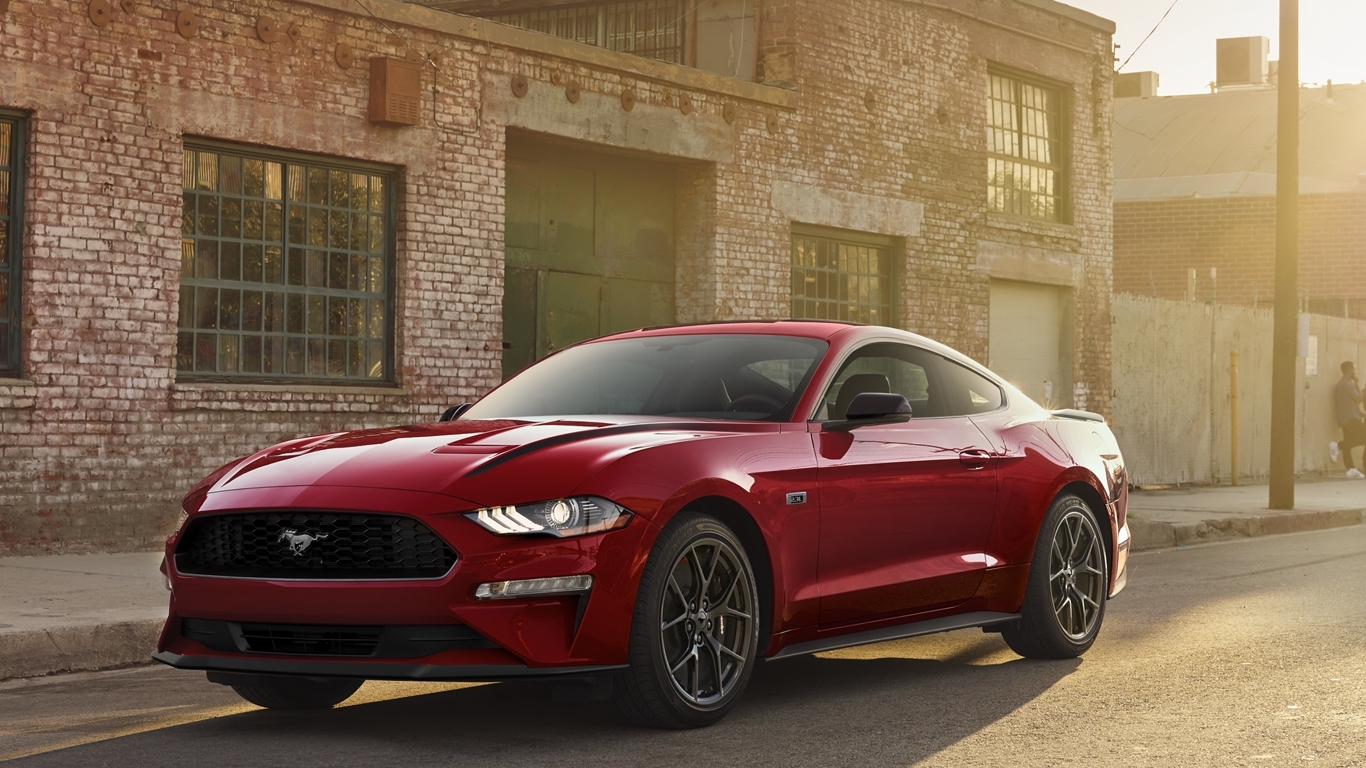
16. Ford Mustang
> Fatal crashes to sales, 2018-2020: 3.5 per 10,000 sold cars
> Fatal crashes, 2018-2020: 73
> Sales, 2018-2020: 209,421
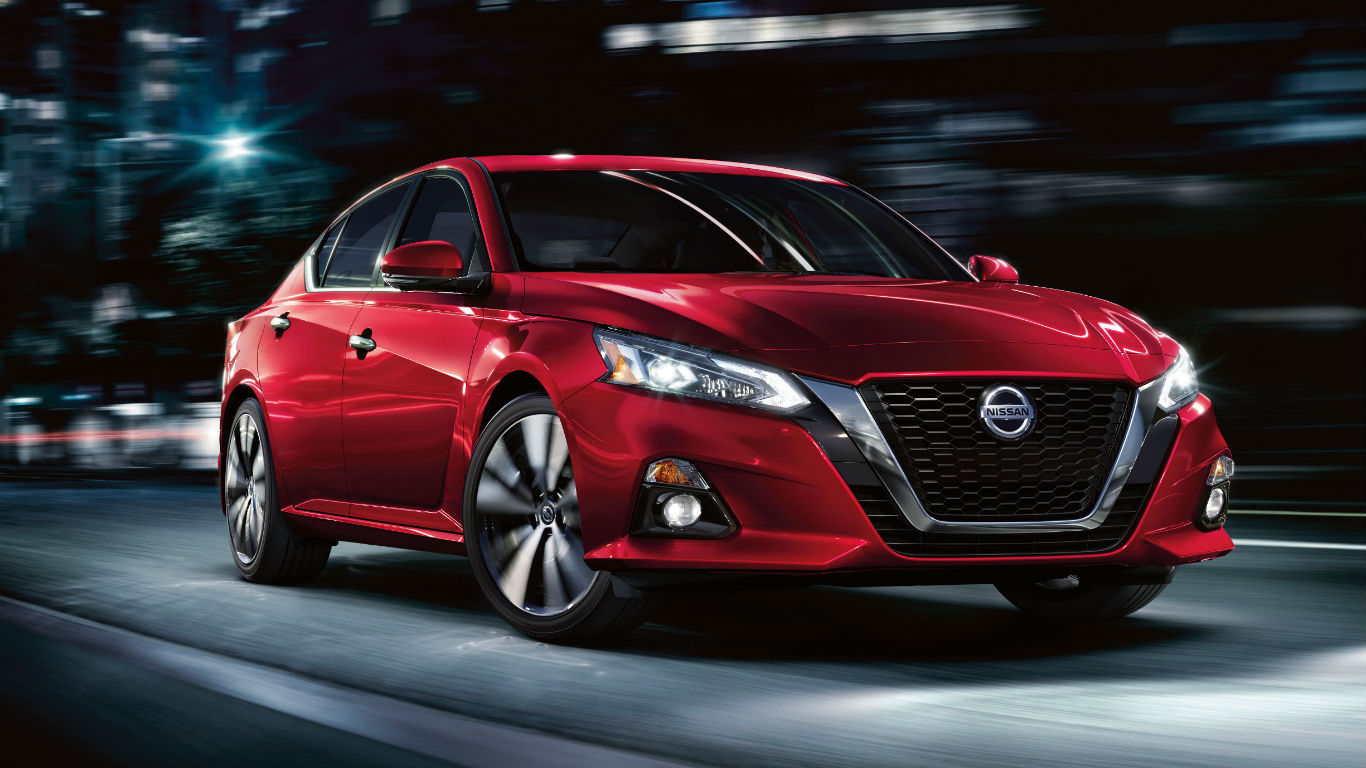
15. Nissan Altima
> Fatal crashes to sales, 2018-2020: 3.6 per 10,000 sold cars
> Fatal crashes, 2018-2020: 200
> Sales, 2018-2020: 556,317
[in-text-ad]
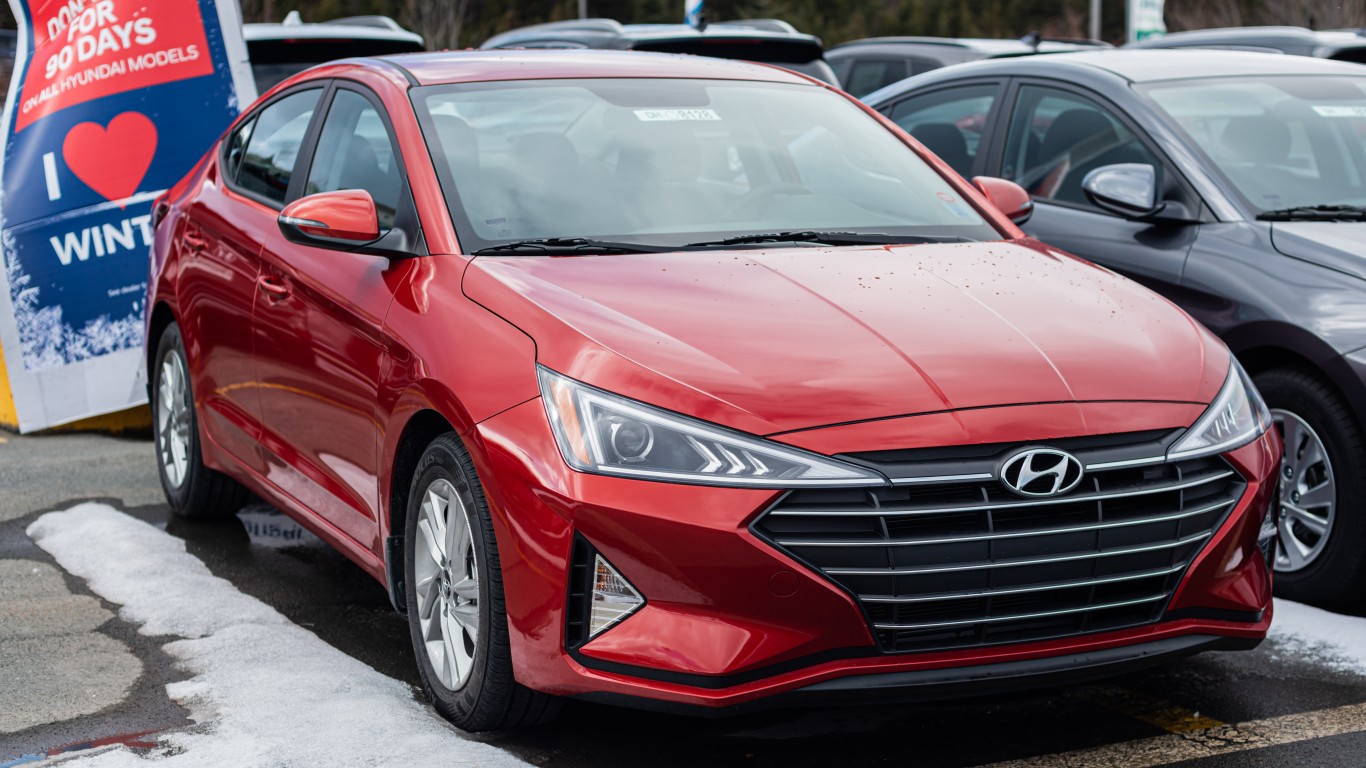
14. Hyundai Elantra
> Fatal crashes to sales, 2018-2020: 3.7 per 10,000 sold cars
> Fatal crashes, 2018-2020: 179
> Sales, 2018-2020: 480,984
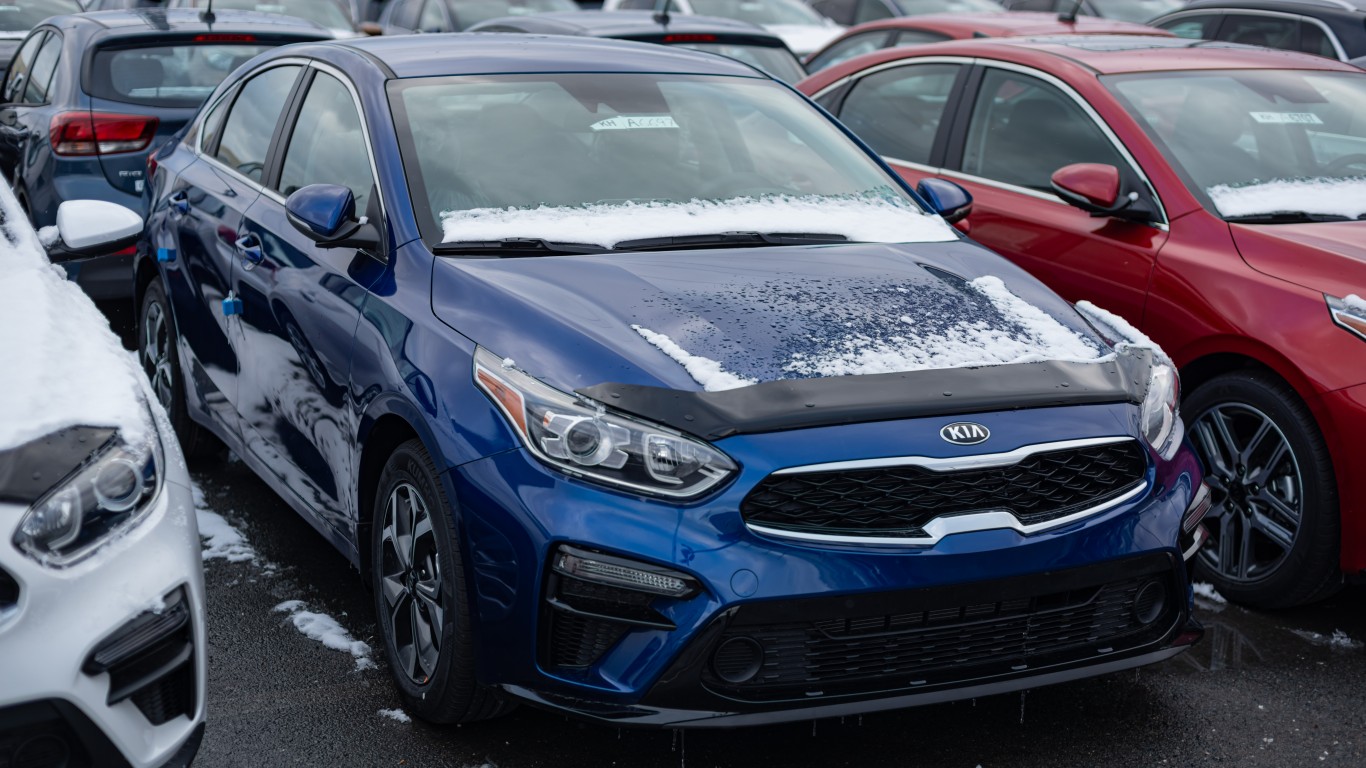
13. Kia Forte
> Fatal crashes to sales, 2018-2020: 3.8 per 10,000 sold cars
> Fatal crashes, 2018-2020: 106
> Sales, 2018-2020: 282,570
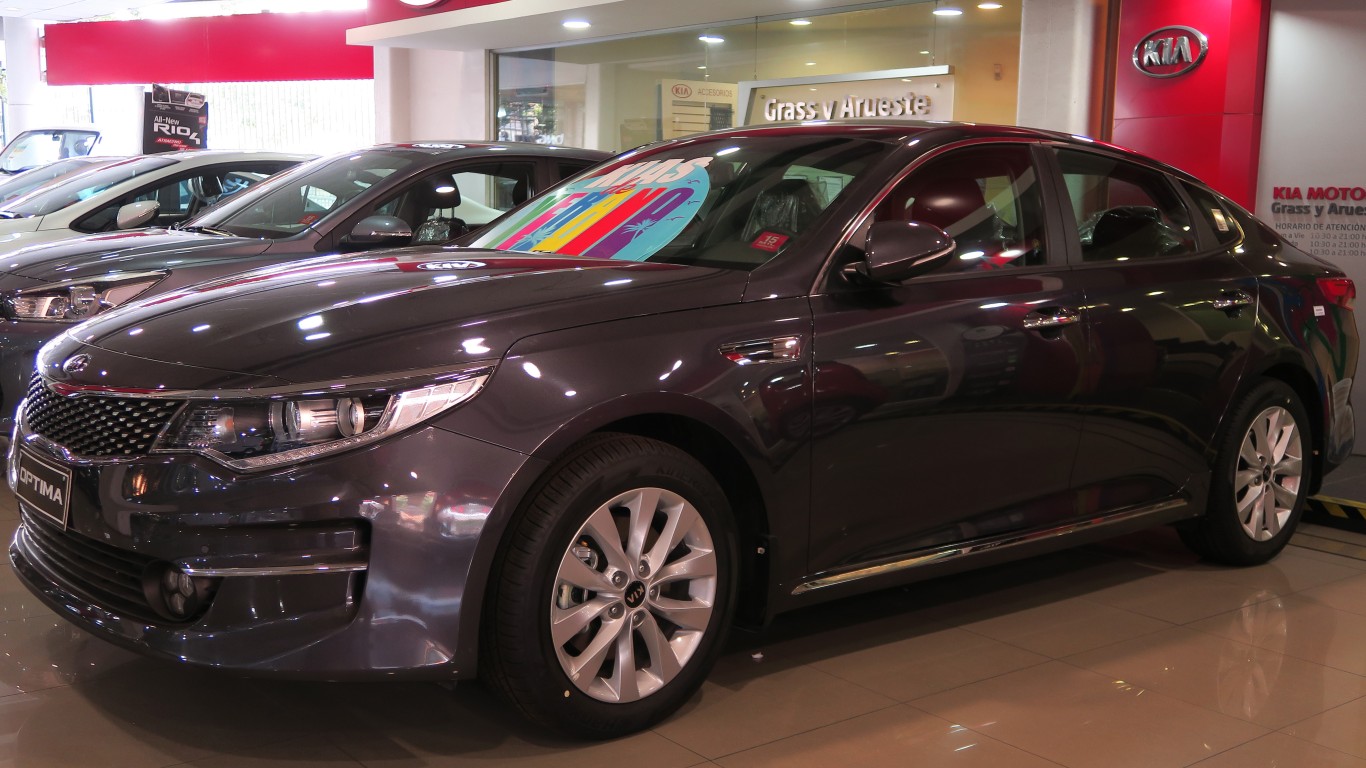
12. Kia Optima
> Fatal crashes to sales, 2018-2020: 3.9 per 10,000 sold cars
> Fatal crashes, 2018-2020: 95
> Sales, 2018-2020: 246,137
[in-text-ad-2]
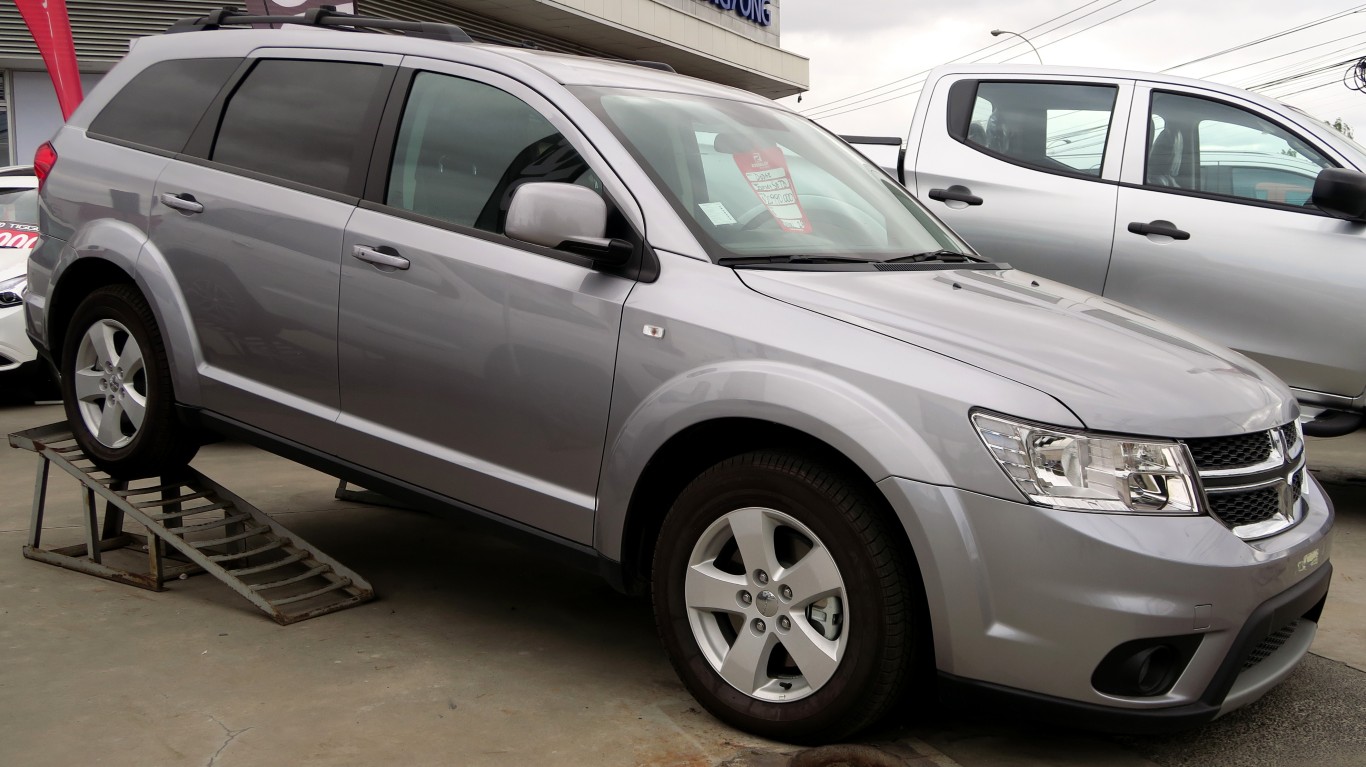
11. Dodge Journey
> Fatal crashes to sales, 2018-2020: 4.0 per 10,000 sold cars
> Fatal crashes, 2018-2020: 83
> Sales, 2018-2020: 209,124
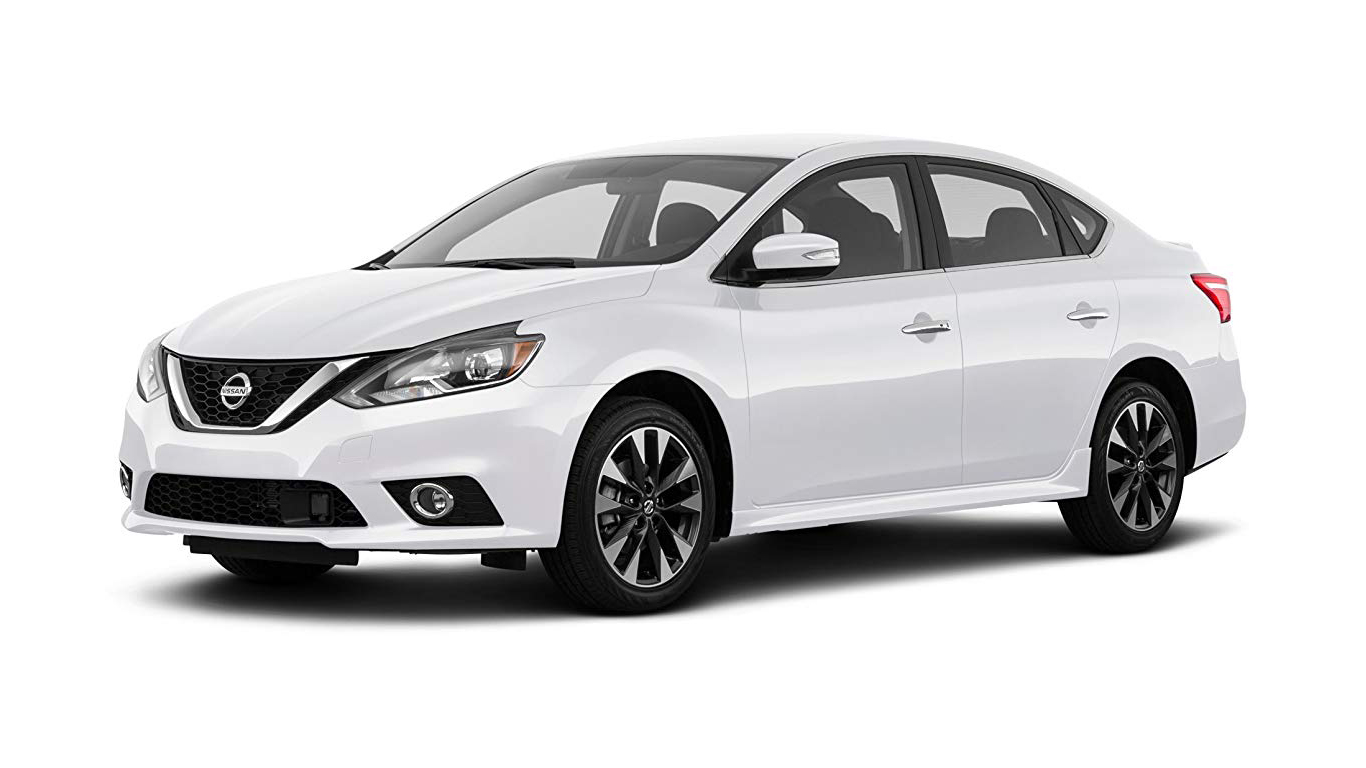
10. Nissan Sentra
> Fatal crashes to sales, 2018-2020: 4.0 per 10,000 sold cars
> Fatal crashes, 2018-2020: 197
> Sales, 2018-2020: 492,309
[in-text-ad]
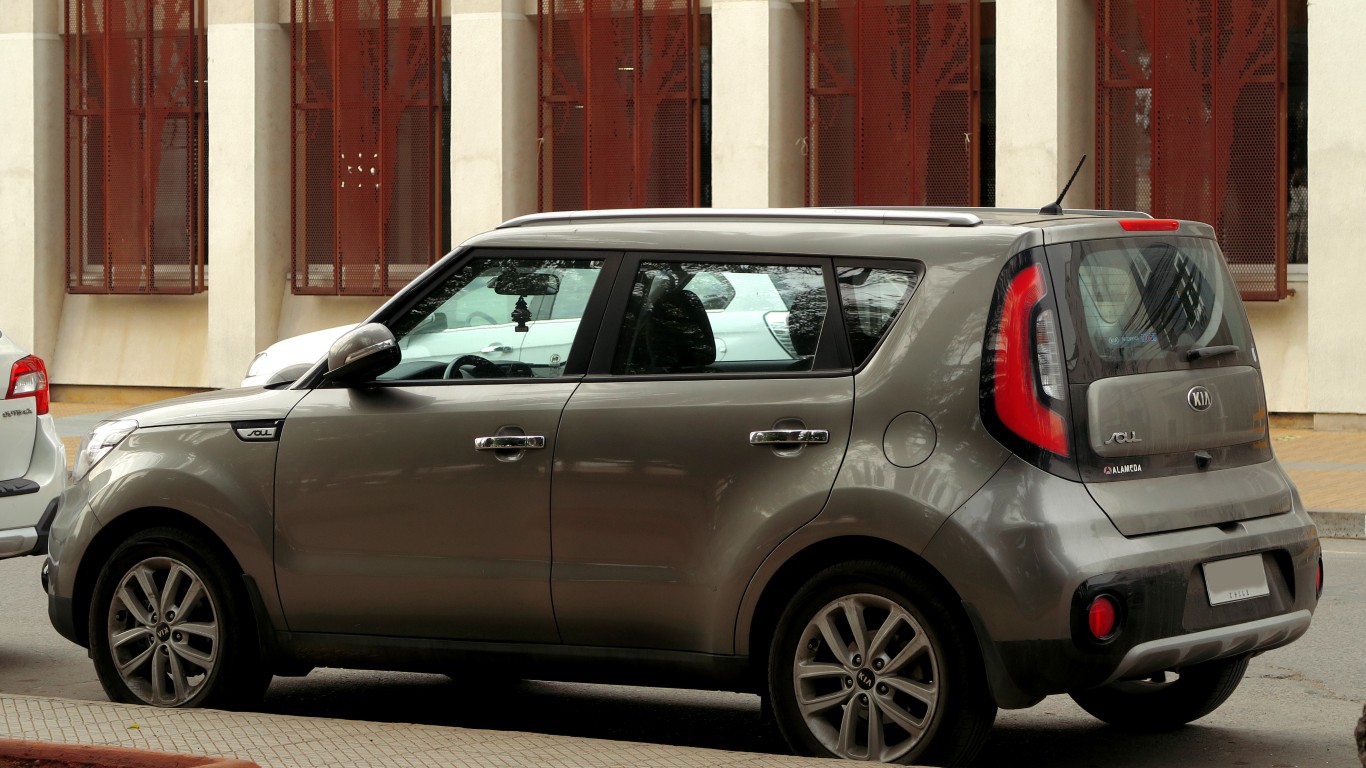
9. Kia Soul
> Fatal crashes to sales, 2018-2020: 4.0 per 10,000 sold cars
> Fatal crashes, 2018-2020: 111
> Sales, 2018-2020: 274,295
8. Nissan Versa
> Fatal crashes to sales, 2018-2020: 4.3 per 10,000 sold cars
> Fatal crashes, 2018-2020: 82
> Sales, 2018-2020: 190,677
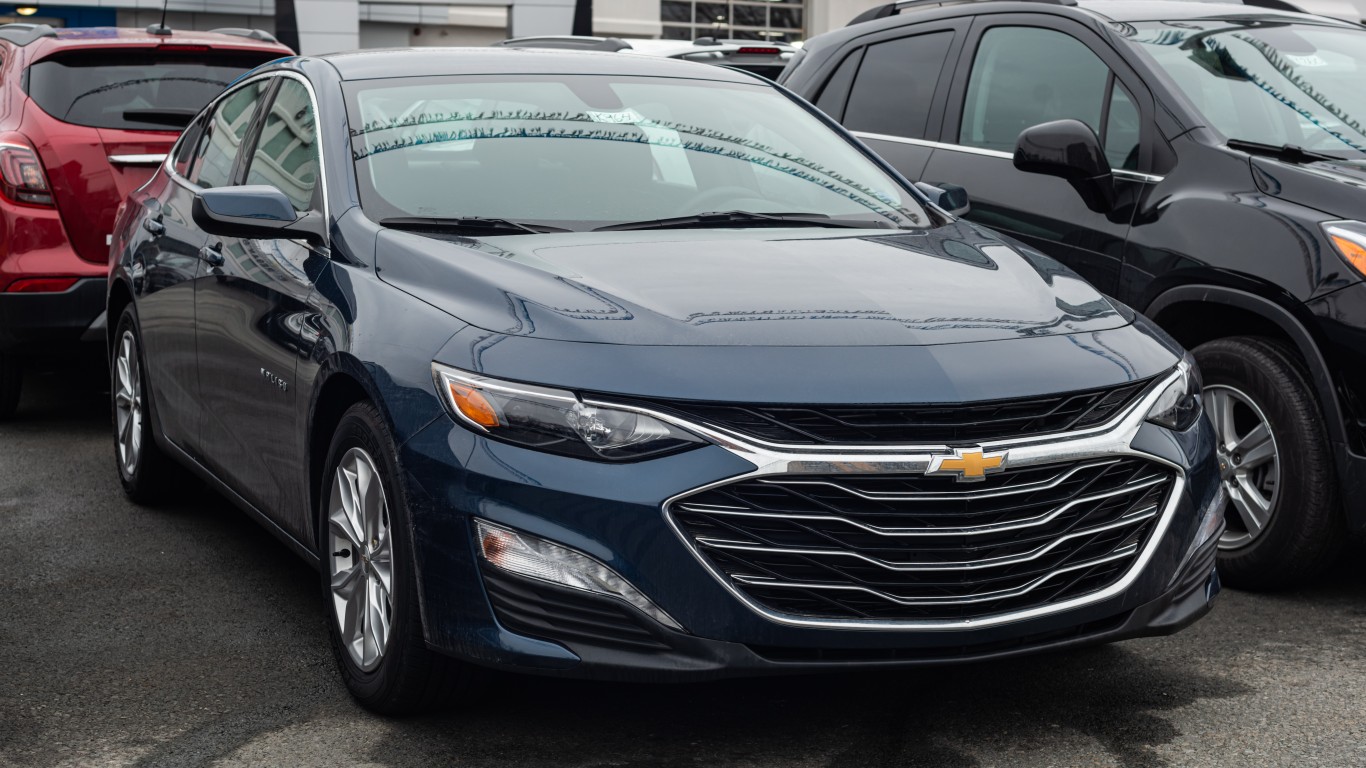
7. Chevrolet Malibu
> Fatal crashes to sales, 2018-2020: 4.4 per 10,000 sold cars
> Fatal crashes, 2018-2020: 163
> Sales, 2018-2020: 367,496
[in-text-ad-2]
6. Ford Fiesta
> Fatal crashes to sales, 2018-2020: 4.9 per 10,000 sold cars
> Fatal crashes, 2018-2020: 56
> Sales, 2018-2020: 115,232
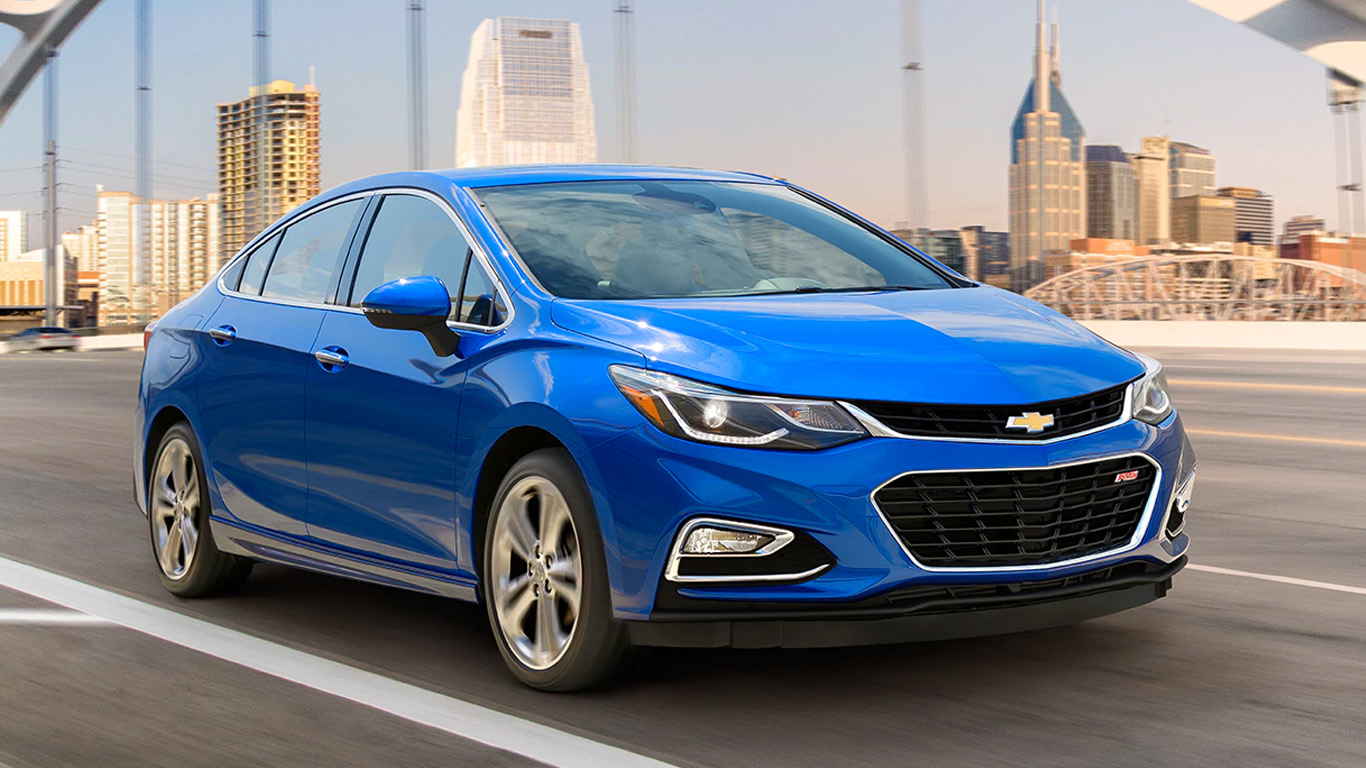
5. Chevrolet Cruze
> Fatal crashes to sales, 2018-2020: 5.0 per 10,000 sold cars
> Fatal crashes, 2018-2020: 96
> Sales, 2018-2020: 191,376
[in-text-ad]
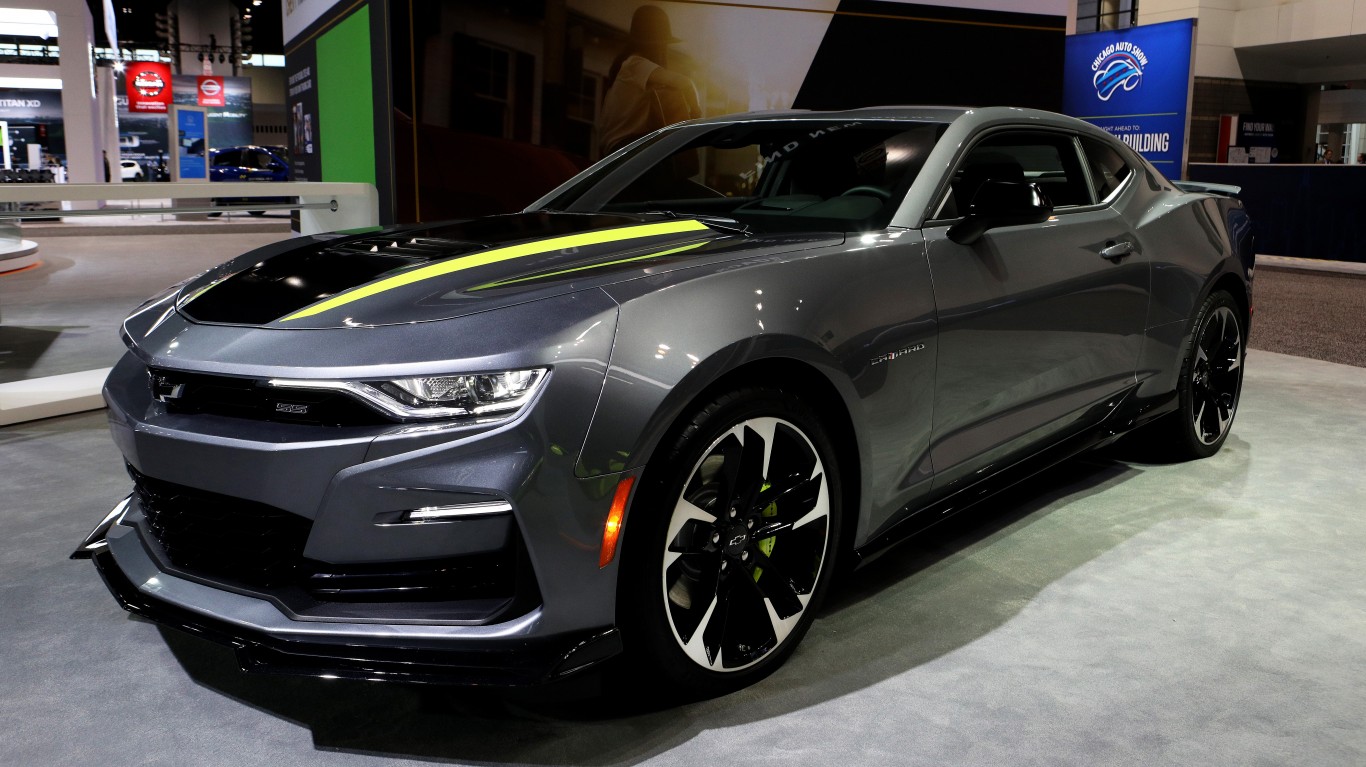
4. Chevrolet Camaro
> Fatal crashes to sales, 2018-2020: 5.7 per 10,000 sold cars
> Fatal crashes, 2018-2020: 74
> Sales, 2018-2020: 129,006
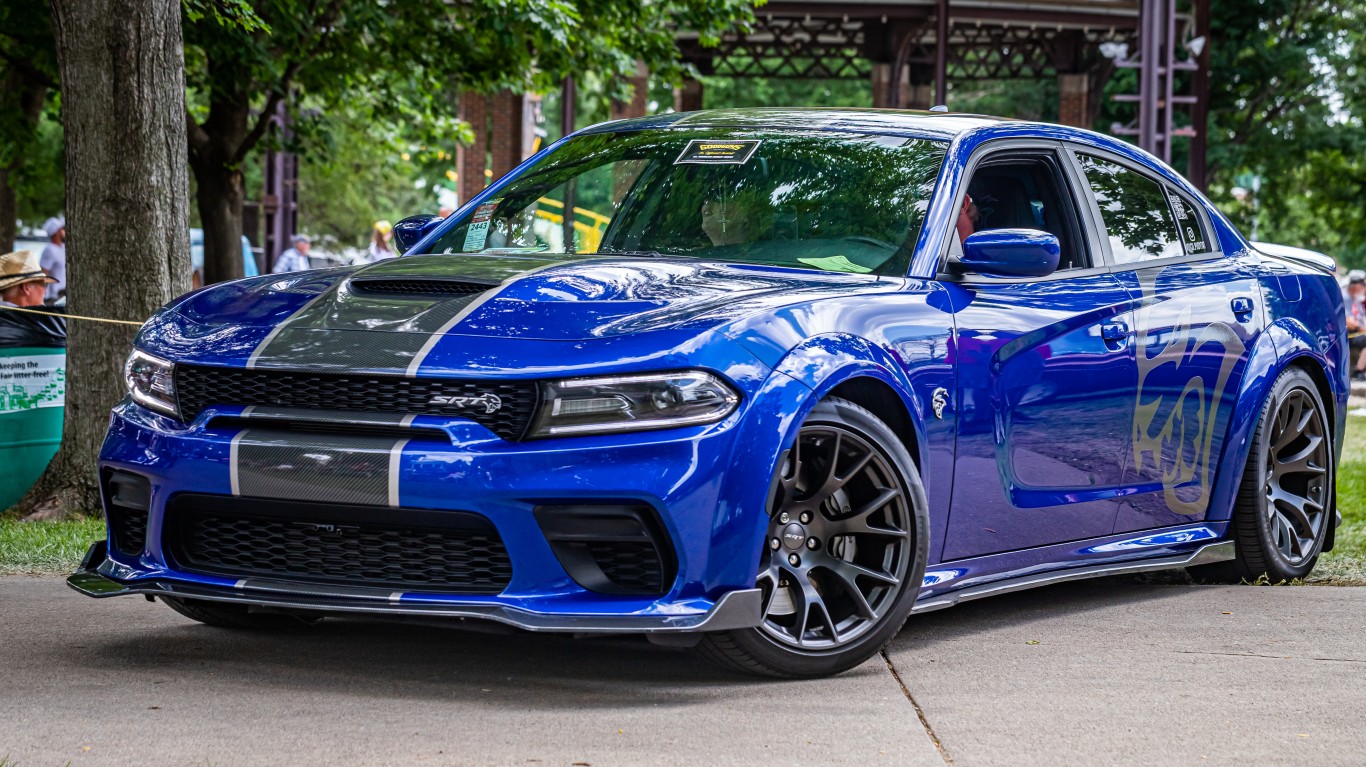
3. Dodge Charger
> Fatal crashes to sales, 2018-2020: 6.0 per 10,000 sold cars
> Fatal crashes, 2018-2020: 152
> Sales, 2018-2020: 254,588
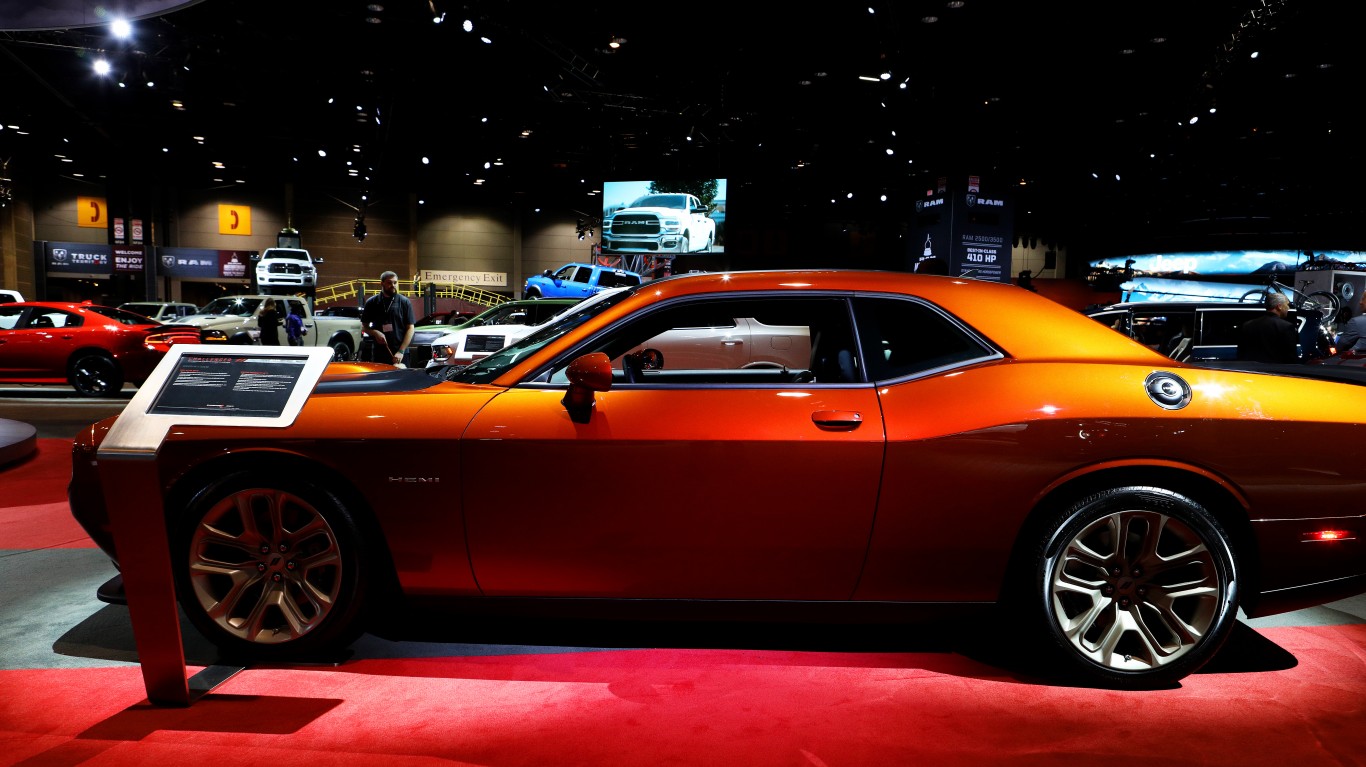
2. Dodge Challenger
> Fatal crashes to sales, 2018-2020: 6.1 per 10,000 sold cars
> Fatal crashes, 2018-2020: 111
> Sales, 2018-2020: 180,668
[in-text-ad-2]
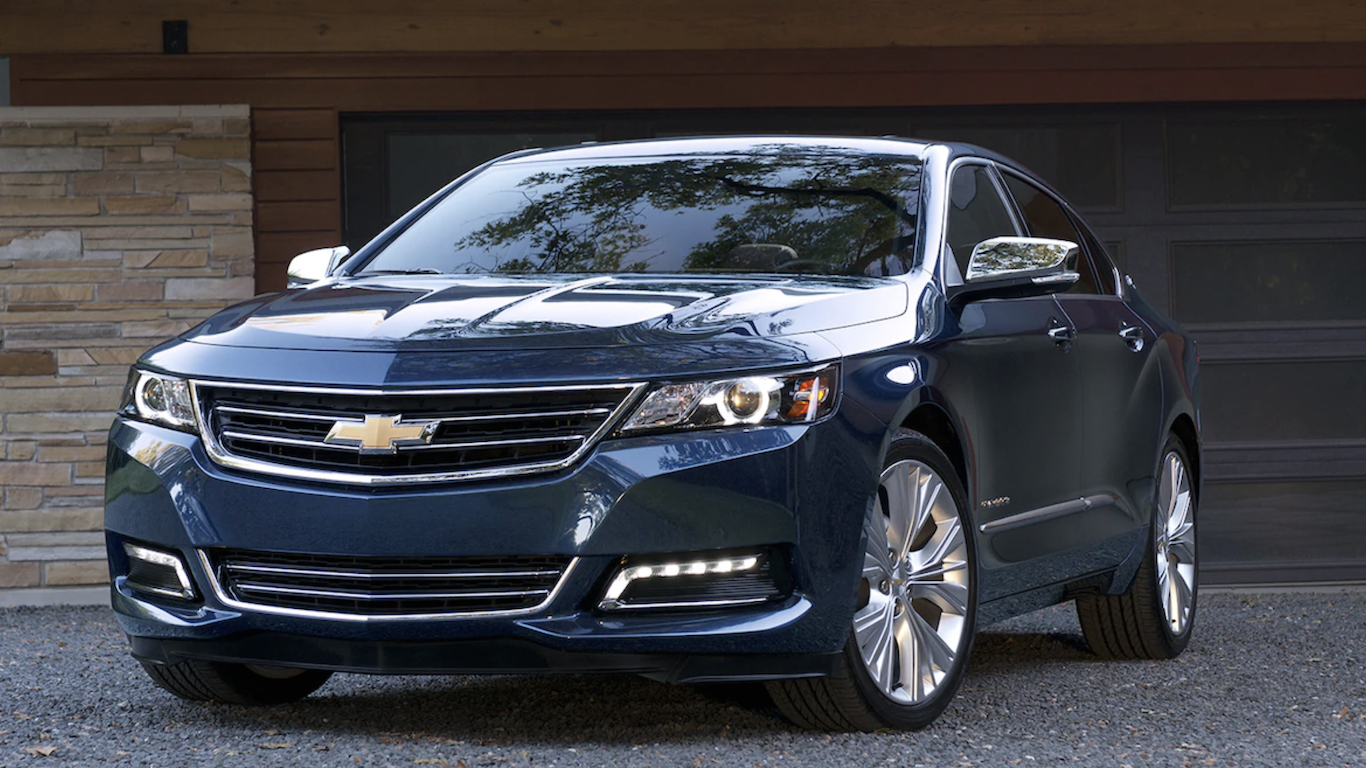
1. Chevrolet Impala
> Fatal crashes to sales, 2018-2020: 7.0 per 10,000 sold cars
> Fatal crashes, 2018-2020: 78
> Sales, 2018-2020: 111,478
It’s Your Money, Your Future—Own It (sponsor)
Retirement can be daunting, but it doesn’t need to be.
Imagine having an expert in your corner to help you with your financial goals. Someone to help you determine if you’re ahead, behind, or right on track. With SmartAsset, that’s not just a dream—it’s reality. This free tool connects you with pre-screened financial advisors who work in your best interests. It’s quick, it’s easy, so take the leap today and start planning smarter!
Don’t waste another minute; get started right here and help your retirement dreams become a retirement reality.
Thank you for reading! Have some feedback for us?
Contact the 24/7 Wall St. editorial team.
 24/7 Wall St.
 24/7 Wall St.