
The wage premium on city jobs is a well known if not completely understood fact in the U.S. economy. Leaving a small town for a big city is likely to lead to more job options at higher wages, and bigger cities tend to have more productive economies and higher-income residents.
The median annual household annual income in nearly all (17) of the 20 largest U.S. metro areas exceeds the national median household income of $74,755. The opposite is true in the 20 lowest-population metro areas– the median household income surpasses the national figure in just two cities (Midland, Michigan, and Fairbanks, Alaska). These are the cities that attracted the most new residents last year.
The U.S. Census Bureau, which tracks this information, released its 2022 data for large geographic areas, including states, metropolitan areas, and mid- to large-sized cities on Sept. 14 this year. Amid a historic rise in the inflation rate, real median household income fell by 2.3% from $76,330 in 2021 to $74,580 in 2022. Between 2021 and 2022, inflation rose by 7.8% — the largest annual increase in the cost-of-living adjustment since 1981, according to the release.
Which cities, even with the advantage a larger population size seems to offer, still trail most other cities in terms of the income of a typical household? To answer this question, 24/7 Wall St. reviewed the median annual household income in the 192 metropolitan areas with a population of 250,000 or less (about half of the 382 U.S. metropolitan statistical areas considered by the 2022 American Community Survey). (Also see, people are leaving these 50 American cities in droves.)
These are America’s poorest metro areas.
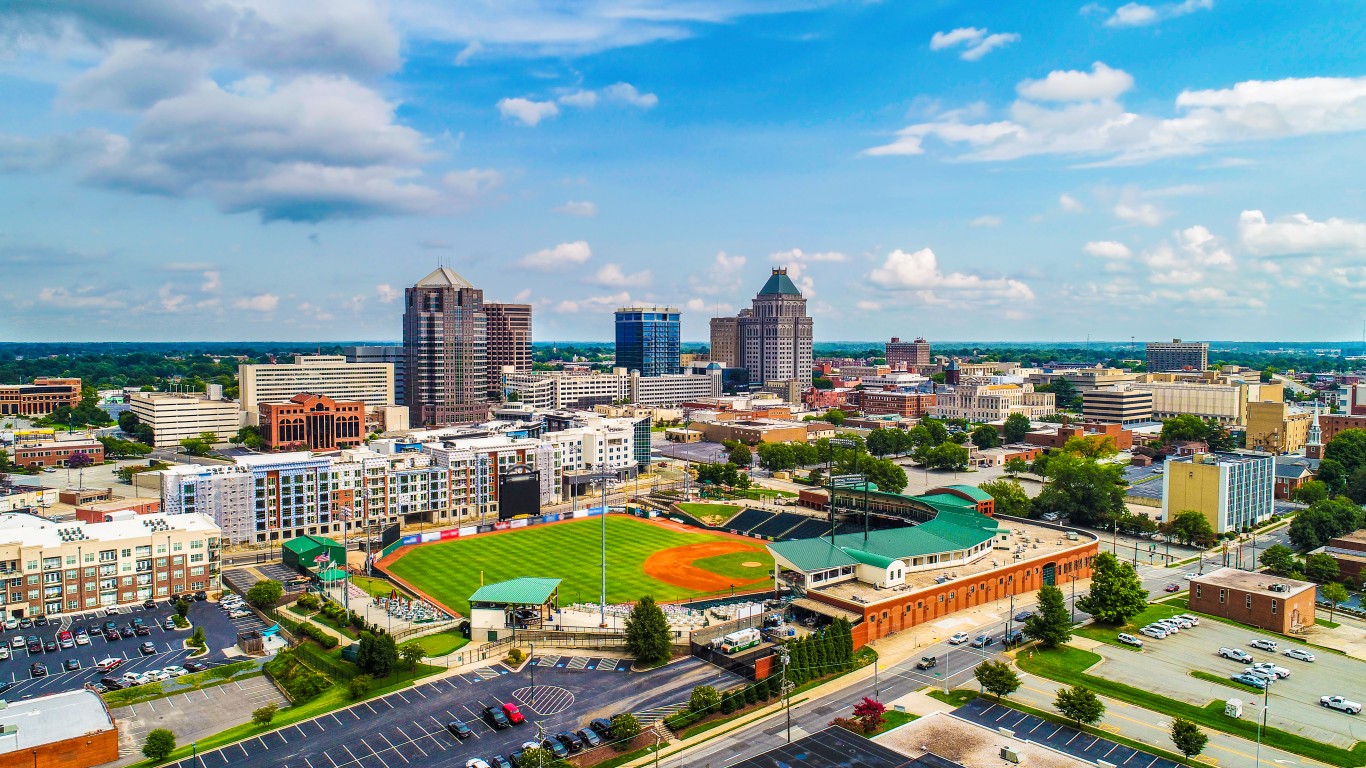
26. Greensboro-High Point, NC
> Median household annual income: $60,271
> Households with incomes under $10,000: 21,179 (6.6%% of households – #98 highest out of 382 MSAs)
> People in households with incomes under poverty line: 126,855 (16.8%% – #76 highest out of 382 MSAs)
> Population: 784,101 – #79 largest MSA
[in-text-ad]

25. Hickory-Lenoir-Morganton, NC
> Median household annual income: $60,209
> Households with incomes under $10,000: 6,365 (4.2%% of households – #317 highest out of 382 MSAs)
> People in households with incomes under poverty line: 49,766 (13.8%% – #166 highest out of 382 MSAs)
> Population: 368,347 – #148 largest MSA

24. Beaumont-Port Arthur, TX
> Median household annual income: $60,067
> Households with incomes under $10,000: 12,527 (8.2%% of households – #39 highest out of 382 MSAs)
> People in households with incomes under poverty line: 63,683 (16.9%% – #74 highest out of 382 MSAs)
> Population: 393,575 – #141 largest MSA
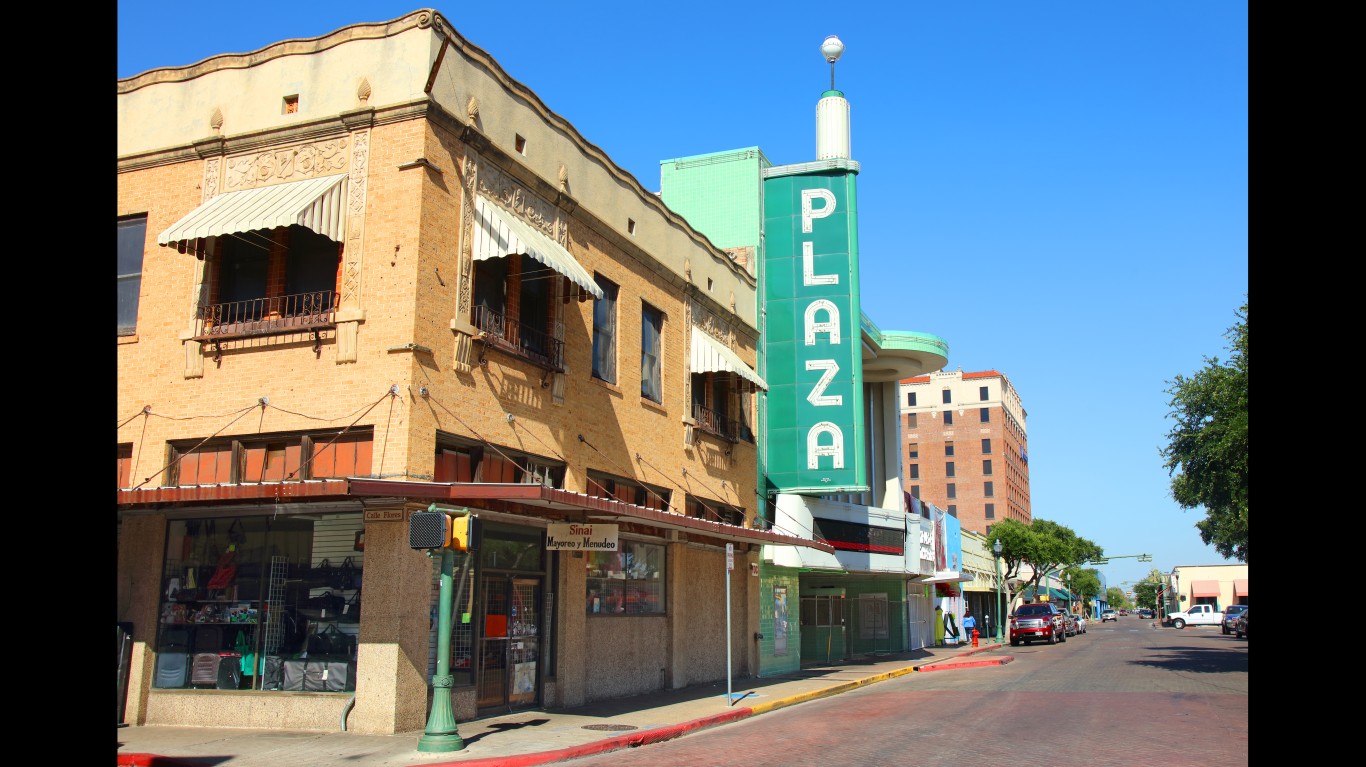
23. Laredo, TX
> Median household annual income: $59,603
> Households with incomes under $10,000: 4,584 (5.6%% of households – #176 highest out of 382 MSAs)
> People in households with incomes under poverty line: 52,898 (20.1%% – #19 highest out of 382 MSAs)
> Population: 267,780 – #185 largest MSA
[in-text-ad-2]
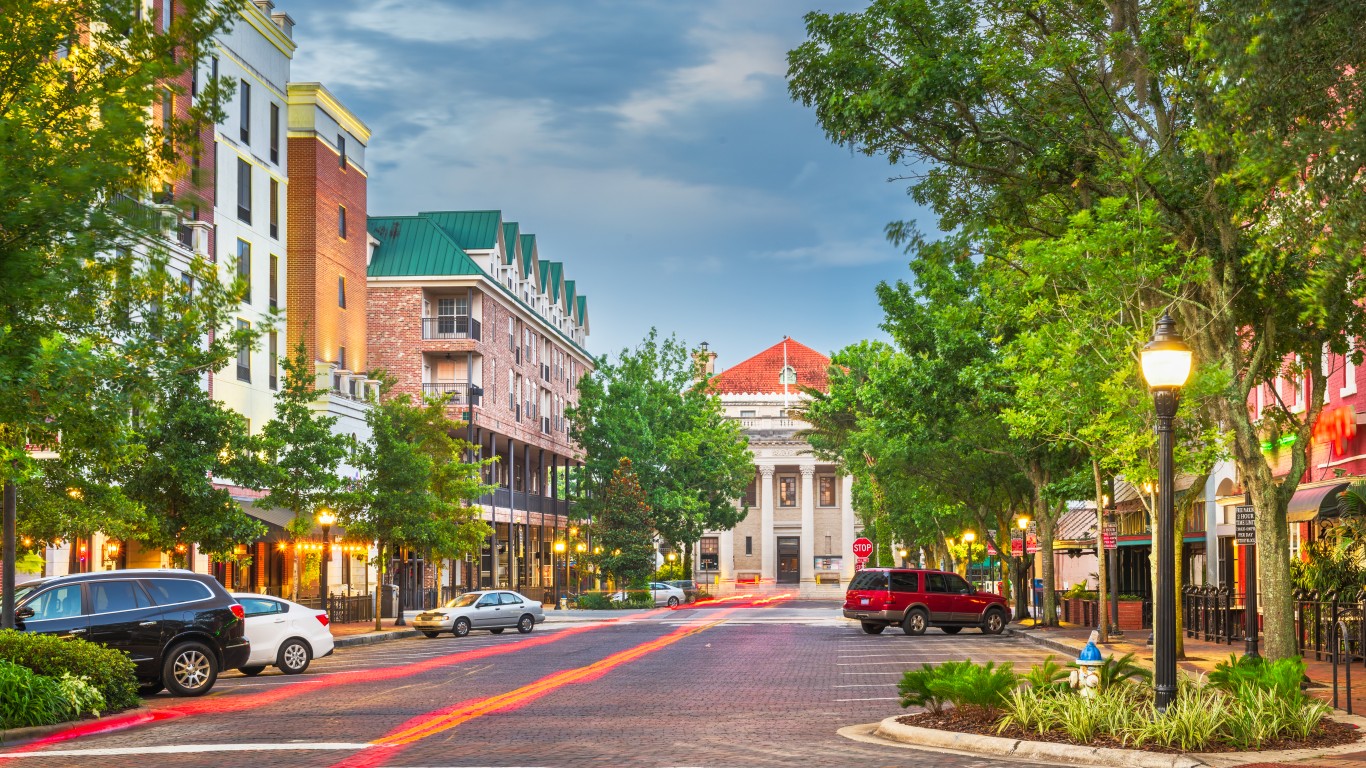
22. Gainesville, FL
> Median household annual income: $59,516
> Households with incomes under $10,000: 13,099 (9.2%% of households – #17 highest out of 382 MSAs)
> People in households with incomes under poverty line: 60,180 (18.0%% – #51 highest out of 382 MSAs)
> Population: 350,903 – #152 largest MSA

21. Lubbock, TX
> Median household annual income: $59,228
> Households with incomes under $10,000: 10,015 (7.6%% of households – #60 highest out of 382 MSAs)
> People in households with incomes under poverty line: 55,357 (17.5%% – #59 highest out of 382 MSAs)
> Population: 328,173 – #159 largest MSA
[in-text-ad]

20. Tuscaloosa, AL
> Median household annual income: $58,620
> Households with incomes under $10,000: 9,098 (8.5%% of households – #31 highest out of 382 MSAs)
> People in households with incomes under poverty line: 44,781 (17.3%% – #65 highest out of 382 MSAs)
> Population: 277,274 – #180 largest MSA
19. Jackson, MS
> Median household annual income: $58,064
> Households with incomes under $10,000: 15,618 (7.0%% of households – #87 highest out of 382 MSAs)
> People in households with incomes under poverty line: 94,502 (16.9%% – #73 highest out of 382 MSAs)
> Population: 580,661 – #99 largest MSA

18. Tallahassee, FL
> Median household annual income: $58,018
> Households with incomes under $10,000: 13,740 (8.8%% of households – #28 highest out of 382 MSAs)
> People in households with incomes under poverty line: 72,023 (19.6%% – #23 highest out of 382 MSAs)
> Population: 391,680 – #142 largest MSA
[in-text-ad-2]
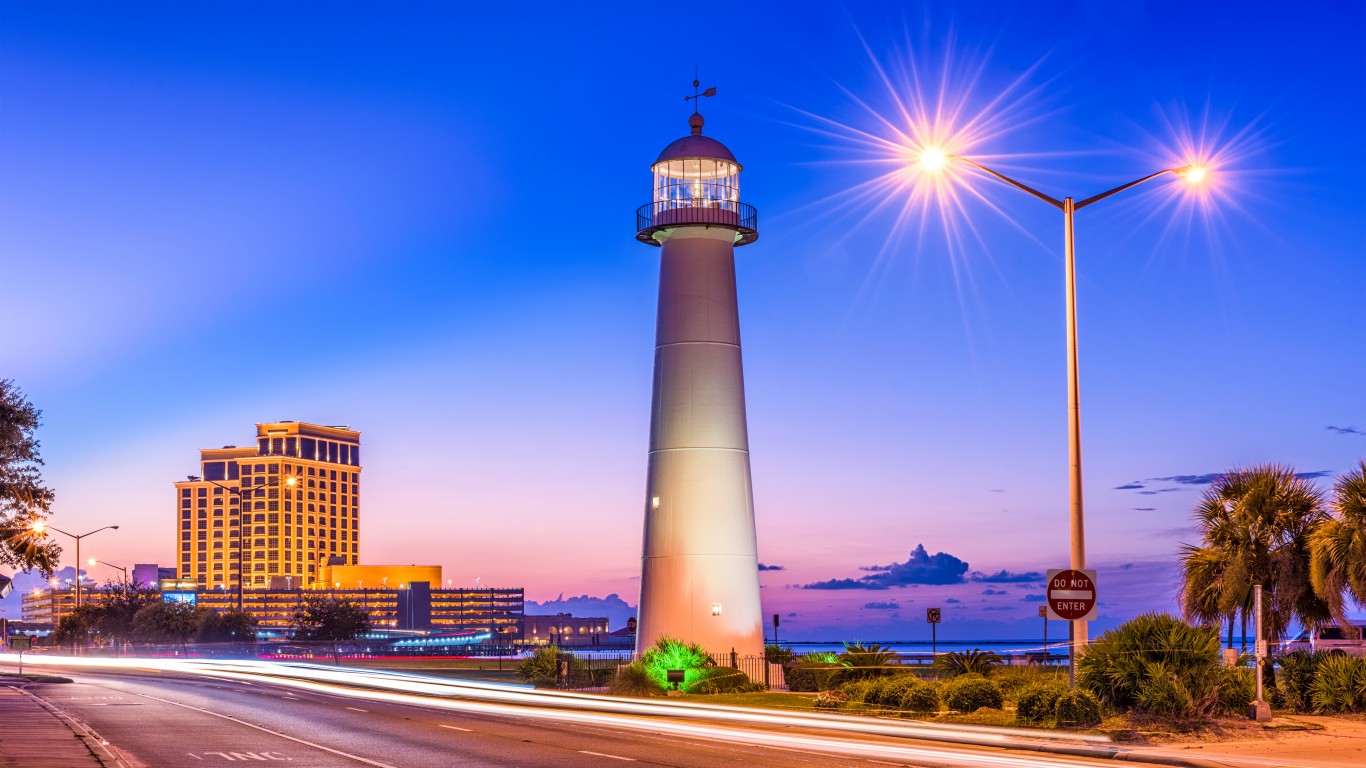
17. Gulfport-Biloxi, MS
> Median household annual income: $58,007
> Households with incomes under $10,000: 13,401 (7.9%% of households – #44 highest out of 382 MSAs)
> People in households with incomes under poverty line: 72,385 (17.5%% – #61 highest out of 382 MSAs)
> Population: 420,782 – #133 largest MSA
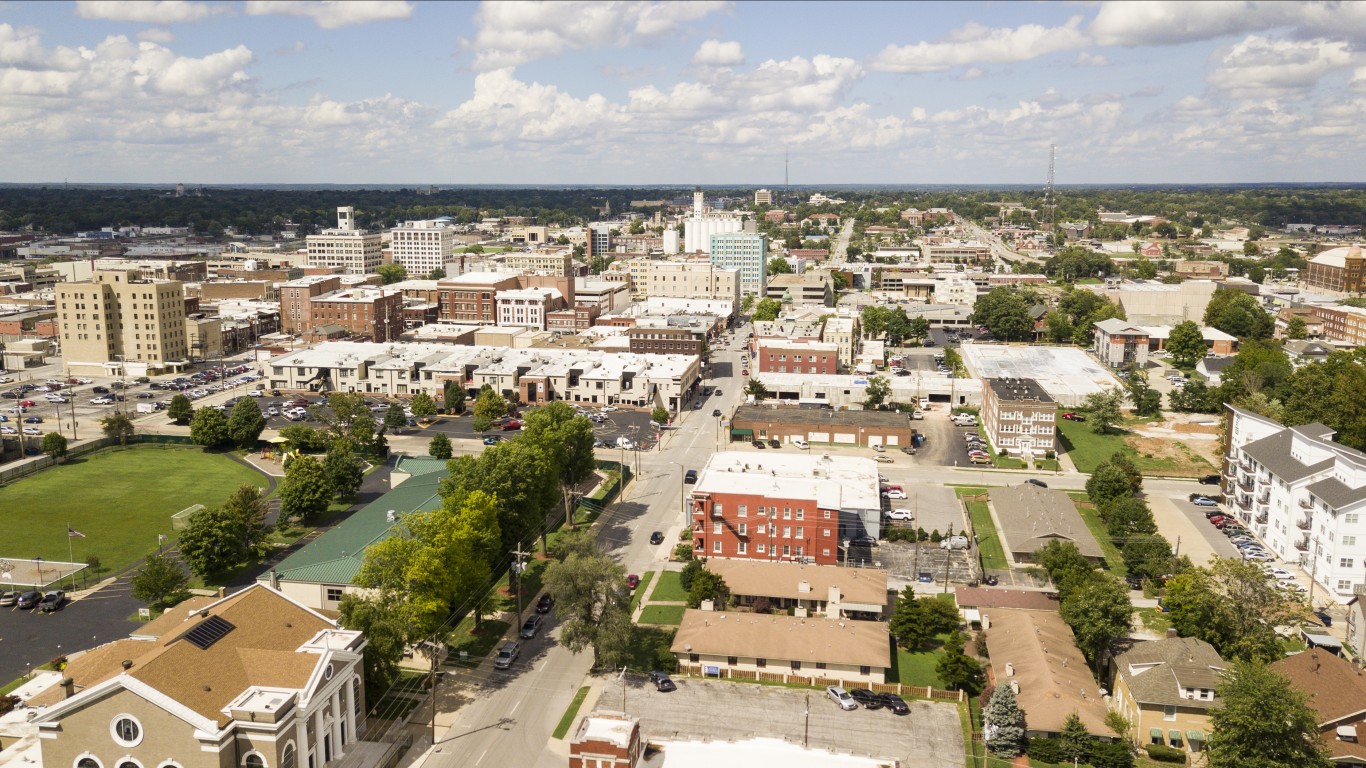
16. Springfield, MO
> Median household annual income: $57,822
> Households with incomes under $10,000: 9,491 (4.7%% of households – #266 highest out of 382 MSAs)
> People in households with incomes under poverty line: 67,376 (14.3%% – #149 highest out of 382 MSAs)
> Population: 484,613 – #116 largest MSA
[in-text-ad]
15. Spartanburg, SC
> Median household annual income: $57,755
> Households with incomes under $10,000: 7,365 (5.5%% of households – #180 highest out of 382 MSAs)
> People in households with incomes under poverty line: 49,977 (14.8%% – #128 highest out of 382 MSAs)
> Population: 345,831 – #154 largest MSA

14. Flint, MI
> Median household annual income: $57,003
> Households with incomes under $10,000: 11,811 (7.0%% of households – #84 highest out of 382 MSAs)
> People in households with incomes under poverty line: 64,988 (16.4%% – #84 highest out of 382 MSAs)
> Population: 401,983 – #135 largest MSA

13. Huntington-Ashland, WV-KY-OH
> Median household annual income: $56,806
> Households with incomes under $10,000: 9,691 (6.6%% of households – #104 highest out of 382 MSAs)
> People in households with incomes under poverty line: 56,388 (16.3%% – #87 highest out of 382 MSAs)
> Population: 354,304 – #151 largest MSA
[in-text-ad-2]

12. Erie, PA
> Median household annual income: $56,094
> Households with incomes under $10,000: 8,266 (7.4%% of households – #68 highest out of 382 MSAs)
> People in households with incomes under poverty line: 38,548 (15.1%% – #119 highest out of 382 MSAs)
> Population: 267,689 – #186 largest MSA

11. Youngstown-Warren-Boardman, OH-PA
> Median household annual income: $54,506
> Households with incomes under $10,000: 17,638 (7.7%% of households – #54 highest out of 382 MSAs)
> People in households with incomes under poverty line: 87,327 (16.8%% – #75 highest out of 382 MSAs)
> Population: 535,499 – #108 largest MSA
[in-text-ad]
10. Mobile, AL
> Median household annual income: $54,313
> Households with incomes under $10,000: 13,824 (8.2%% of households – #40 highest out of 382 MSAs)
> People in households with incomes under poverty line: 78,725 (18.7%% – #39 highest out of 382 MSAs)
> Population: 428,780 – #128 largest MSA

9. Ocala, FL
> Median household annual income: $54,190
> Households with incomes under $10,000: 11,115 (6.8%% of households – #93 highest out of 382 MSAs)
> People in households with incomes under poverty line: 62,026 (16.1%% – #90 highest out of 382 MSAs)
> Population: 396,415 – #140 largest MSA
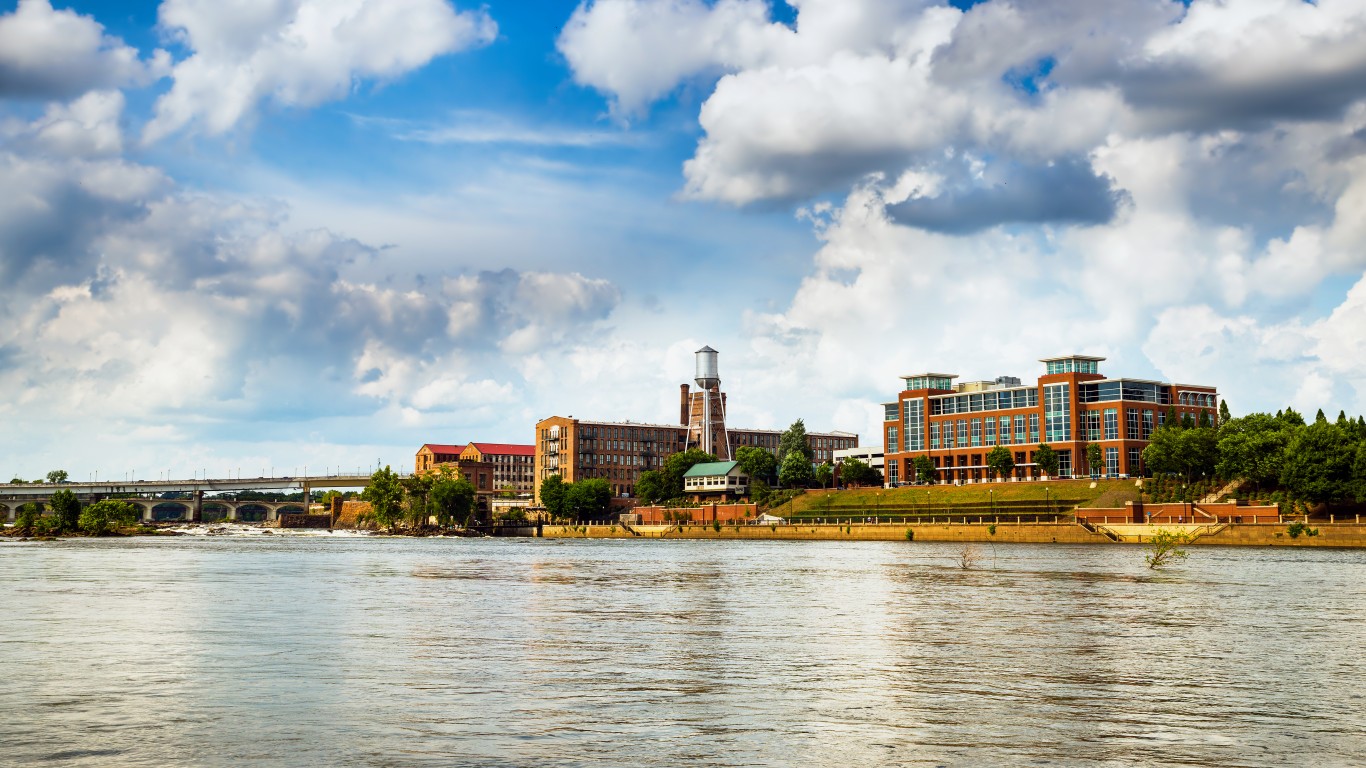
8. Columbus, GA-AL
> Median household annual income: $54,106
> Households with incomes under $10,000: 11,192 (8.9%% of households – #26 highest out of 382 MSAs)
> People in households with incomes under poverty line: 57,340 (18.5%% – #43 highest out of 382 MSAs)
> Population: 324,416 – #161 largest MSA
[in-text-ad-2]

7. El Paso, TX
> Median household annual income: $53,359
> Households with incomes under $10,000: 23,065 (7.7%% of households – #57 highest out of 382 MSAs)
> People in households with incomes under poverty line: 182,677 (21.3%% – #11 highest out of 382 MSAs)
> Population: 871,323 – #68 largest MSA

6. Charleston, WV
> Median household annual income: $53,157
> Households with incomes under $10,000: 8,095 (7.6%% of households – #62 highest out of 382 MSAs)
> People in households with incomes under poverty line: 48,536 (19.7%% – #22 highest out of 382 MSAs)
> Population: 250,554 – #192 largest MSA
[in-text-ad]
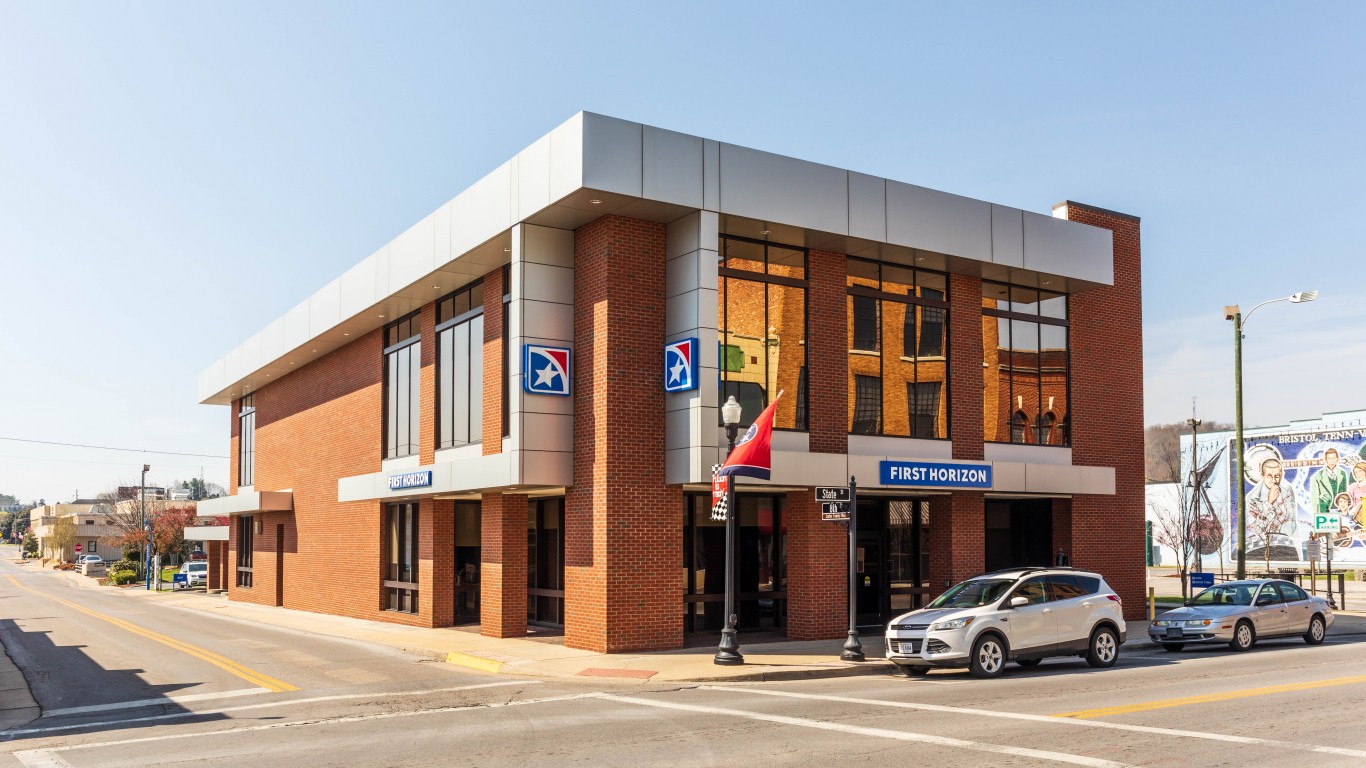
5. Kingsport-Bristol, TN-VA
> Median household annual income: $52,887
> Households with incomes under $10,000: 7,265 (5.5%% of households – #188 highest out of 382 MSAs)
> People in households with incomes under poverty line: 44,438 (14.5%% – #135 highest out of 382 MSAs)
> Population: 310,483 – #166 largest MSA

4. Shreveport-Bossier City, LA
> Median household annual income: $52,775
> Households with incomes under $10,000: 13,707 (8.7%% of households – #30 highest out of 382 MSAs)
> People in households with incomes under poverty line: 71,904 (19.1%% – #29 highest out of 382 MSAs)
> Population: 385,154 – #144 largest MSA

3. Lafayette, LA
> Median household annual income: $50,837
> Households with incomes under $10,000: 16,255 (8.4%% of households – #33 highest out of 382 MSAs)
> People in households with incomes under poverty line: 96,101 (20.2%% – #16 highest out of 382 MSAs)
> Population: 481,125 – #118 largest MSA
[in-text-ad-2]
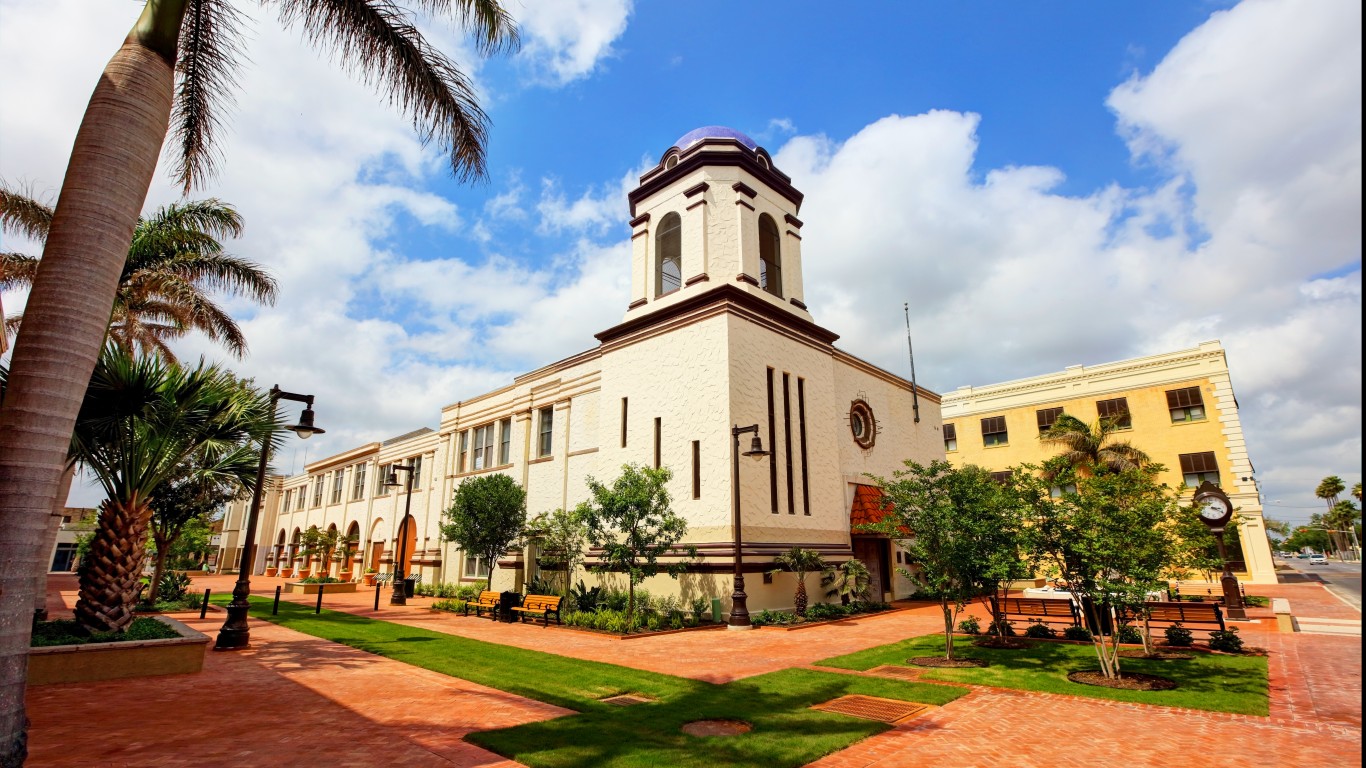
2. Brownsville-Harlingen, TX
> Median household annual income: $50,649
> Households with incomes under $10,000: 11,365 (8.2%% of households – #37 highest out of 382 MSAs)
> People in households with incomes under poverty line: 93,839 (22.3%% – #9 highest out of 382 MSAs)
> Population: 425,208 – #131 largest MSA
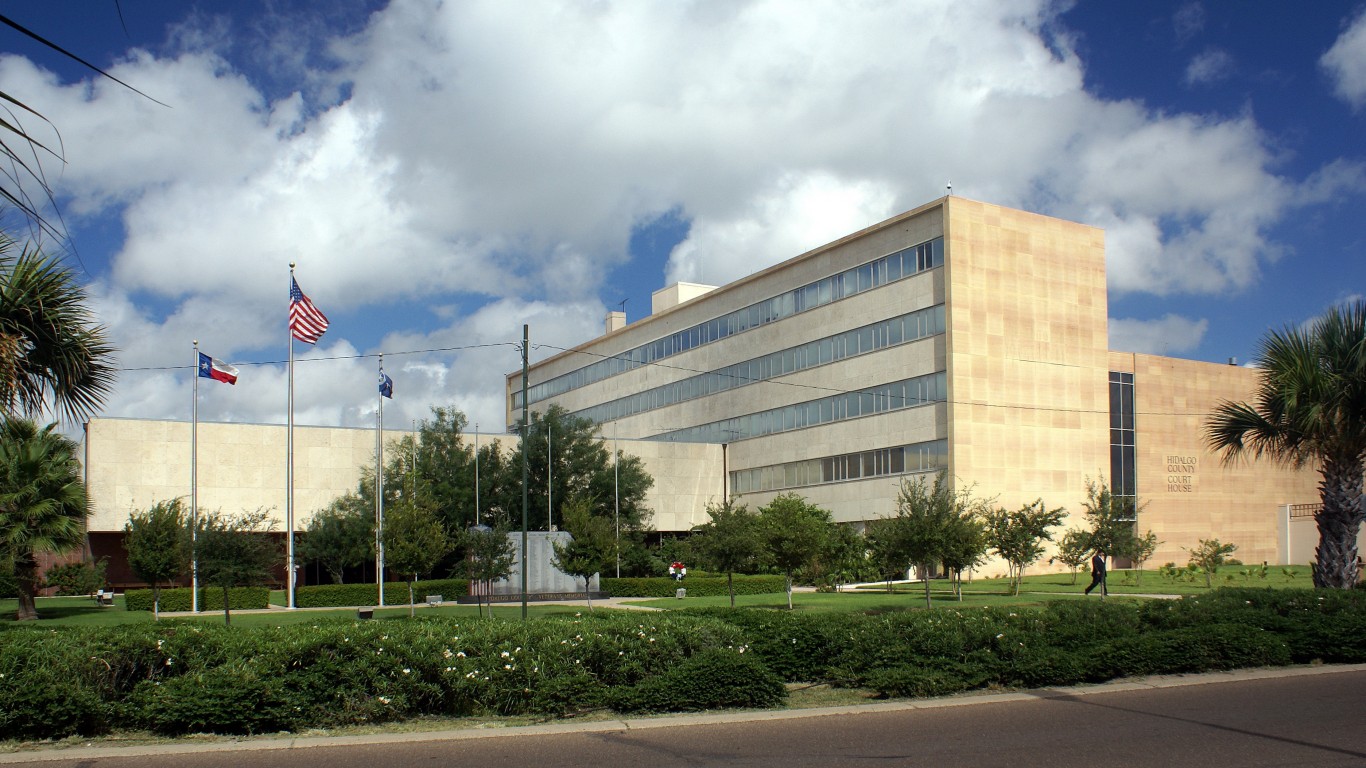
1. McAllen-Edinburg-Mission, TX
> Median household annual income: $49,142
> Households with incomes under $10,000: 20,735 (7.7%% of households – #56 highest out of 382 MSAs)
> People in households with incomes under poverty line: 243,504 (27.6%% – #1 highest out of 382 MSAs)
> Population: 888,367 – #66 largest MSA
Want to Retire Early? Start Here (Sponsor)
Want retirement to come a few years earlier than you’d planned? Or are you ready to retire now, but want an extra set of eyes on your finances?
Now you can speak with up to 3 financial experts in your area for FREE. By simply clicking here you can begin to match with financial professionals who can help you build your plan to retire early. And the best part? The first conversation with them is free.
Click here to match with up to 3 financial pros who would be excited to help you make financial decisions.
Have questions about retirement or personal finance? Email us at [email protected]!
By emailing your questions to 24/7 Wall St., you agree to have them published anonymously on a673b.bigscoots-temp.com.
By submitting your story, you understand and agree that we may use your story, or versions of it, in all media and platforms, including via third parties.
Thank you for reading! Have some feedback for us?
Contact the 24/7 Wall St. editorial team.



 24/7 Wall St.
 24/7 Wall St.


