Special Report
This Is the Car Brand Americans Hate the Most
Published:
Last Updated:

What do drivers want in their new car in order to be satisfied? While drivers may put different emphasis on certain factors and vehicle characteristics, those include vehicle startup, driving feel, fuel efficiency, safety, comfort, exterior and interior appeal, infotainment system, and more. When drivers are not satisfied with these characteristics, motorists let carmakers know. (Also see, America’s least reliable new cars.)
To find the car brand that most Americans hate, 24/7 Wall St. reviewed the 2023 J.D. Power’s 2023 U.S. Automotive Performance, Execution and Layout (APEAL) Study. The study ranks car brands by owners’ emotional attachment and level of excitement with their new vehicle. J.D. Power asked new-vehicle owners to consider 37 attributes, ranging from how comfortable it is to get in and out of the vehicle and driving feel, and computed an overall APEAL Index score on a 1,000 point scale. We included last year’s index score and car sales for each brand for the first half of 2023 from Goodcarbadcar. Ties in the APEAL score were broken using sales figures.
The least-appealing of the car brands were mostly similar to the ones from the survey of a year ago. One notable change was Honda, the most-hated car in 2022, which rose seven spots, improving its APEAL score from 824 to 835, though still well below the segment average score of 837. Honda handed over the most-hated distinction to Chrysler, which was the second-most detested brand a year ago.
The most reviled car brands were mass-market plates, which occupied the bottom 14 spots. Eight of the brands were below the segment average of 837. Notable mass-market outliers that exceeded the segment average were Dodge, Ram, and GMC.
Seven premium brands had an APEAL score less than the segment average of 871. Acura, with a tally of 853, was the most-hated premium car brand.
In terms of notable movement on the list, Genesis tumbled from having the second highest score last year to having the sixth highest score this year, and Cadillac slid from the third highest score to the 10th highest score. Dodge climbed to the top score from the fourth highest score a year ago, and Jaguar vaulted to second highest score from ninth.
Low APEAL scores do not necessarily translate into lower sales. Only six of the car brands on the list had lower first-half sales than for the same period in 2022. Toyota, the third least-liked car brand, recorded sales of 875,959 in the first half of 2023, a 3% increase from a year ago, and the second-highest sales total behind Ford. (This is the best selling car in America.)
Alfa Romeo, the 12th-most liked car brand, posted a sales drop of 26.2% in the first half of 2023, the most of any car brand.
Click here to see the car brand Americans hate the most.
32. Dodge
> 2023 APEAL score: 887/1,000
> Segment: Mass Market — segment average score: 837
> 2022 APEAL score: 882/1000 #4 out of 32
> Sales H1, 2023: 110,721 (+29.8% from H1, 2022)
> Parent company: Stellantis
[in-text-ad]
31. Jaguar
> 2023 APEAL score: 887/1,000
> Segment: Premium — segment average score: 871
> 2022 APEAL score: 868/1000 #9 (tied) out of 32
> Sales H1, 2023: 4,369 (-8.3% from H1, 2022)
> Parent company: JLR/Tata Motors
30. Porsche
> 2023 APEAL score: 883/1,000
> Segment: Premium — segment average score: 871
> 2022 APEAL score: 888/1000 #1 out of 32
> Sales H1, 2023: 36,336 (+11.7% from H1, 2022)
> Parent company: Volkswagen Group
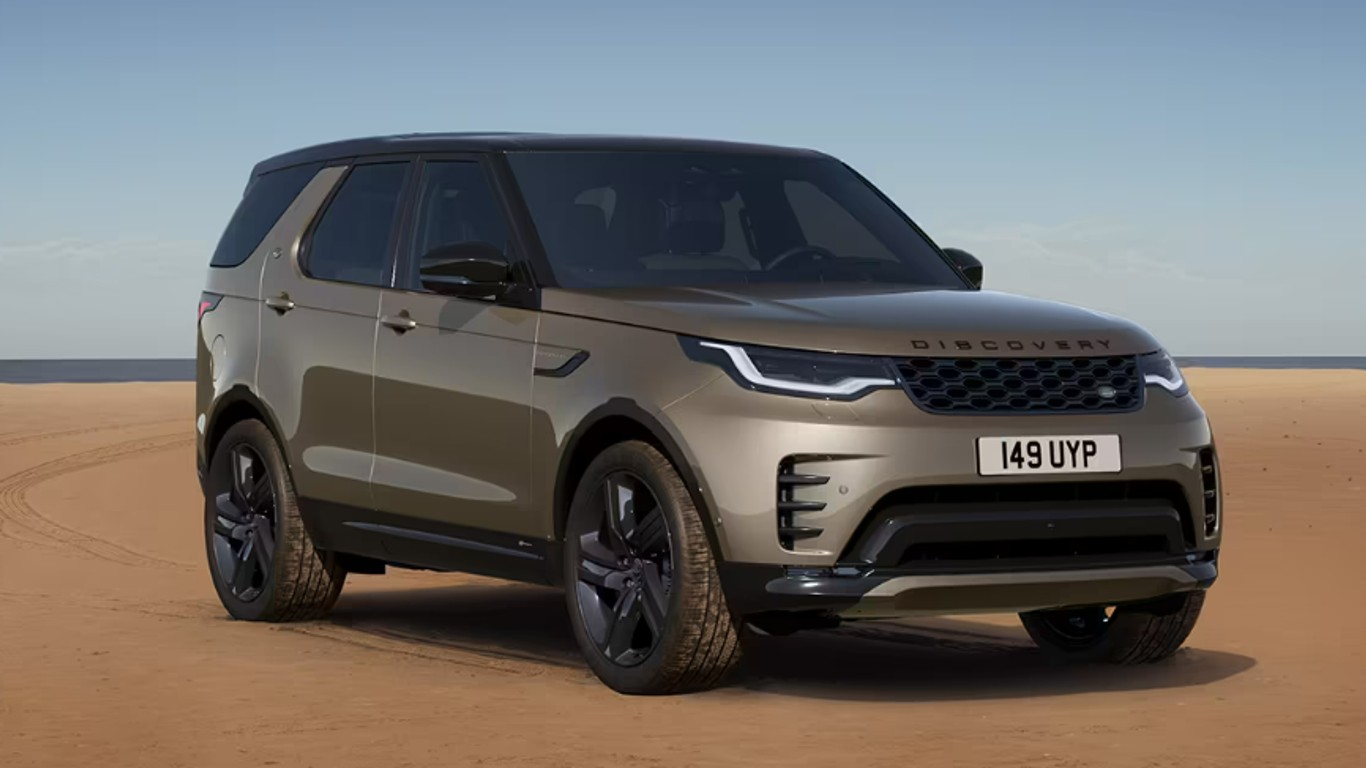
29. Land Rover
> 2023 APEAL score: 883/1,000
> Segment: Premium — segment average score: 871
> 2022 APEAL score: 871/1000 #7 out of 32
> Sales H1, 2023: 28,503 (+2.3% from H1, 2022)
> Parent company: Tata Motors
[in-text-ad-2]
28. BMW
> 2023 APEAL score: 878/1,000
> Segment: Premium — segment average score: 871
> 2022 APEAL score: 875/1000 #6 out of 32
> Sales H1, 2023: 169,819 (+11.3% from H1, 2022)
> Parent company: BMW Group
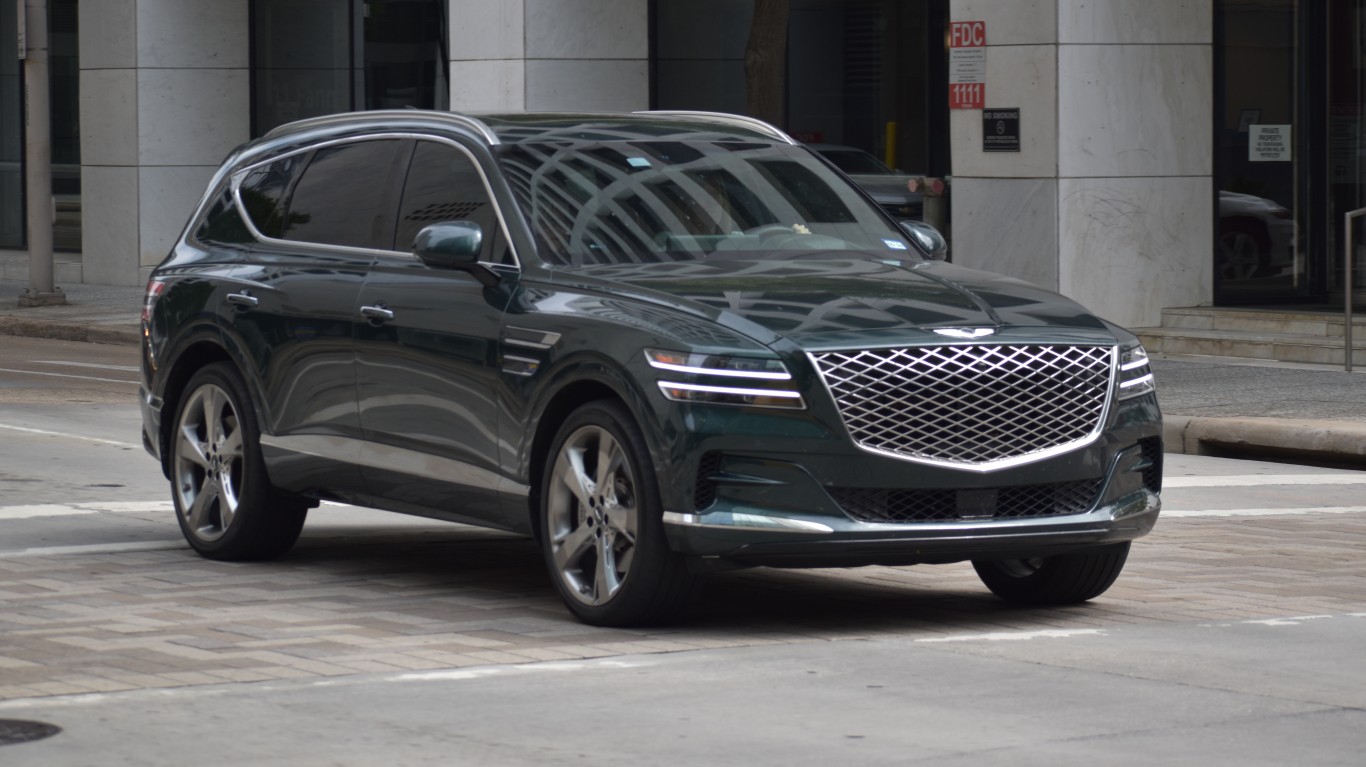
27. Genesis
> 2023 APEAL score: 877/1,000
> Segment: Premium — segment average score: 871
> 2022 APEAL score: 886/1000 #2 out of 32
> Sales H1, 2023: 30,914 (+20.4% from H1, 2022)
> Parent company: Hyundai Motor Group
[in-text-ad]

26. Mercedes-Benz
> 2023 APEAL score: 876/1,000
> Segment: Premium — segment average score: 871
> 2022 APEAL score: 876/1000 #5 out of 32
> Sales H1, 2023: 169,449 (+0.9% from H1, 2022)
> Parent company: Mercedes-Benz Group AG
25. Ram
> 2023 APEAL score: 873/1,000
> Segment: Mass Market — segment average score: 837
> 2022 APEAL score: 863/1000 #12 (tied) out of 32
> Sales H1, 2023: 270,736 (-1.9% from H1, 2022)
> Parent company: Stellantis
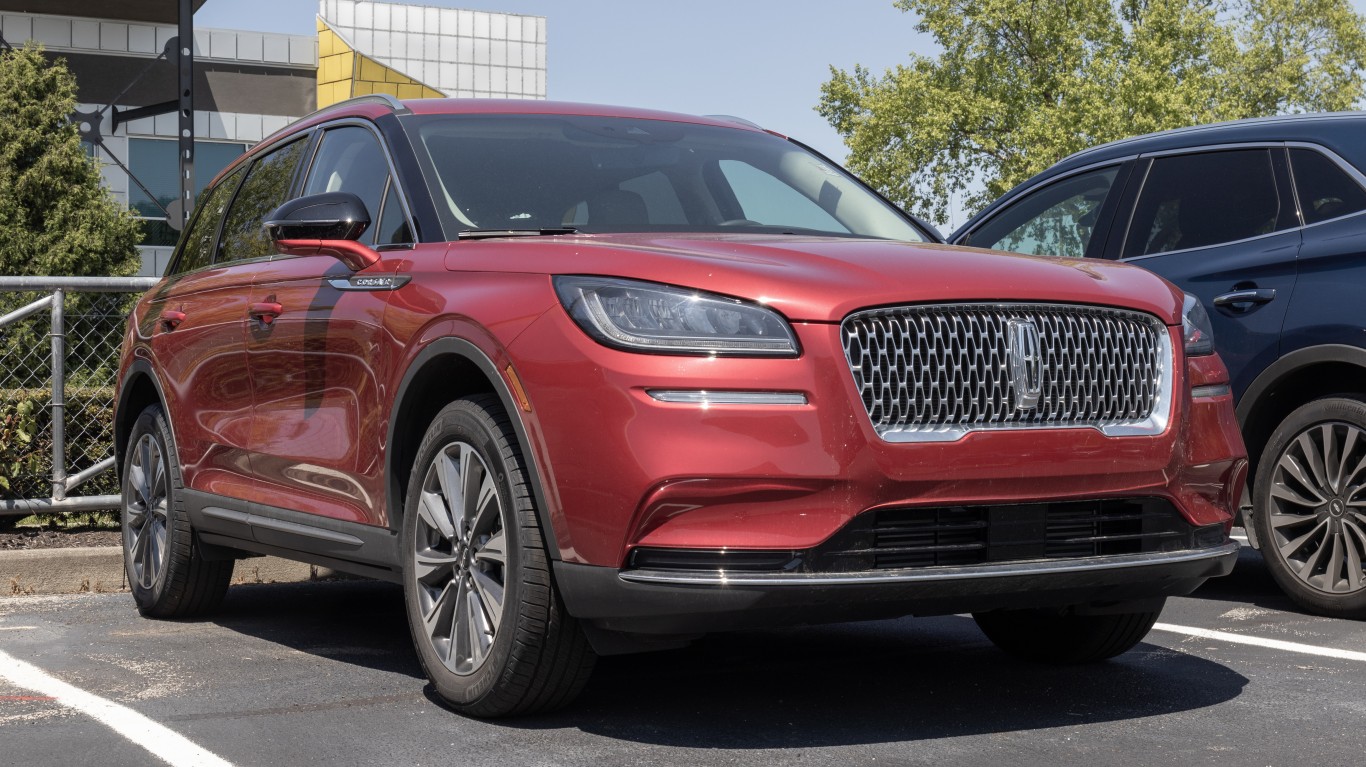
24. Lincoln
> 2023 APEAL score: 873/1,000
> Segment: Premium — segment average score: 871
> 2022 APEAL score: 870/1000 #8 out of 32
> Sales H1, 2023: 38,684 (-9.8% from H1, 2022)
> Parent company: Ford Motor Co.
[in-text-ad-2]

23. Cadillac
> 2023 APEAL score: 865/1,000
> Segment: Premium — segment average score: 871
> 2022 APEAL score: 885/1000 #3 out of 32
> Sales H1, 2023: 75,197 (+21.5% from H1, 2022)
> Parent company: General Motors
22. Lexus
> 2023 APEAL score: 864/1,000
> Segment: Premium — segment average score: 871
> 2022 APEAL score: 863/1000 #12 (tied) out of 32
> Sales H1, 2023: 149,413 (+14.0% from H1, 2022)
> Parent company: Toyota Motor Corp.
[in-text-ad]
21. Alfa Romeo
> 2023 APEAL score: 859/1,000
> Segment: Premium — segment average score: 871
> 2022 APEAL score: 868/1000 #9 (tied) out of 32
> Sales H1, 2023: 4,700 (-26.2% from H1, 2022)
> Parent company: Stellantis
20. GMC
> 2023 APEAL score: 858/1,000
> Segment: Mass Market — segment average score: 837
> 2022 APEAL score: 856/1000 #14 out of 32
> Sales H1, 2023: 286,627 (+13.1% from H1, 2022)
> Parent company: General Motors
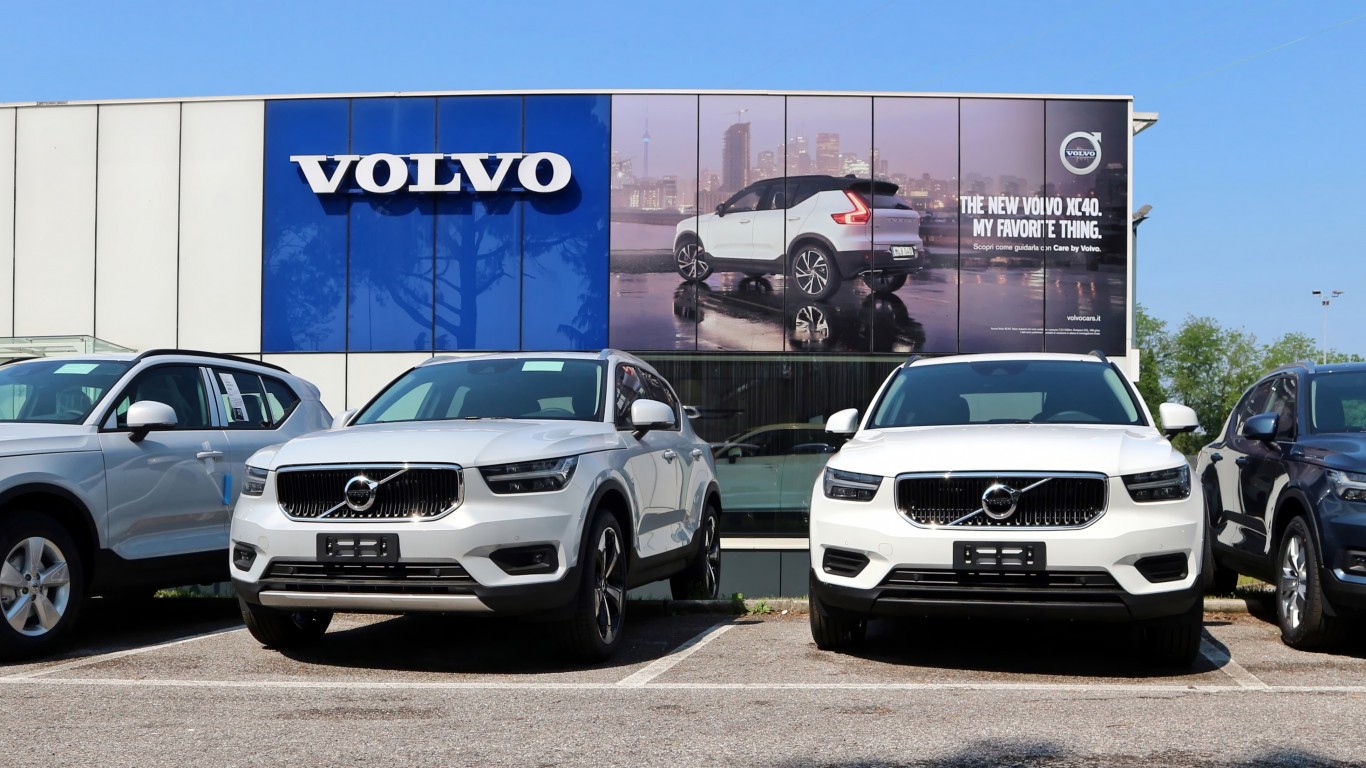
19. Volvo
> 2023 APEAL score: 856/1,000
> Segment: Premium — segment average score: 871
> 2022 APEAL score: 852/1000 #15 out of 32
> Sales H1, 2023: 59,750 (+18.3% from H1, 2022)
> Parent company: Zhejiang Geely Holding Group
[in-text-ad-2]
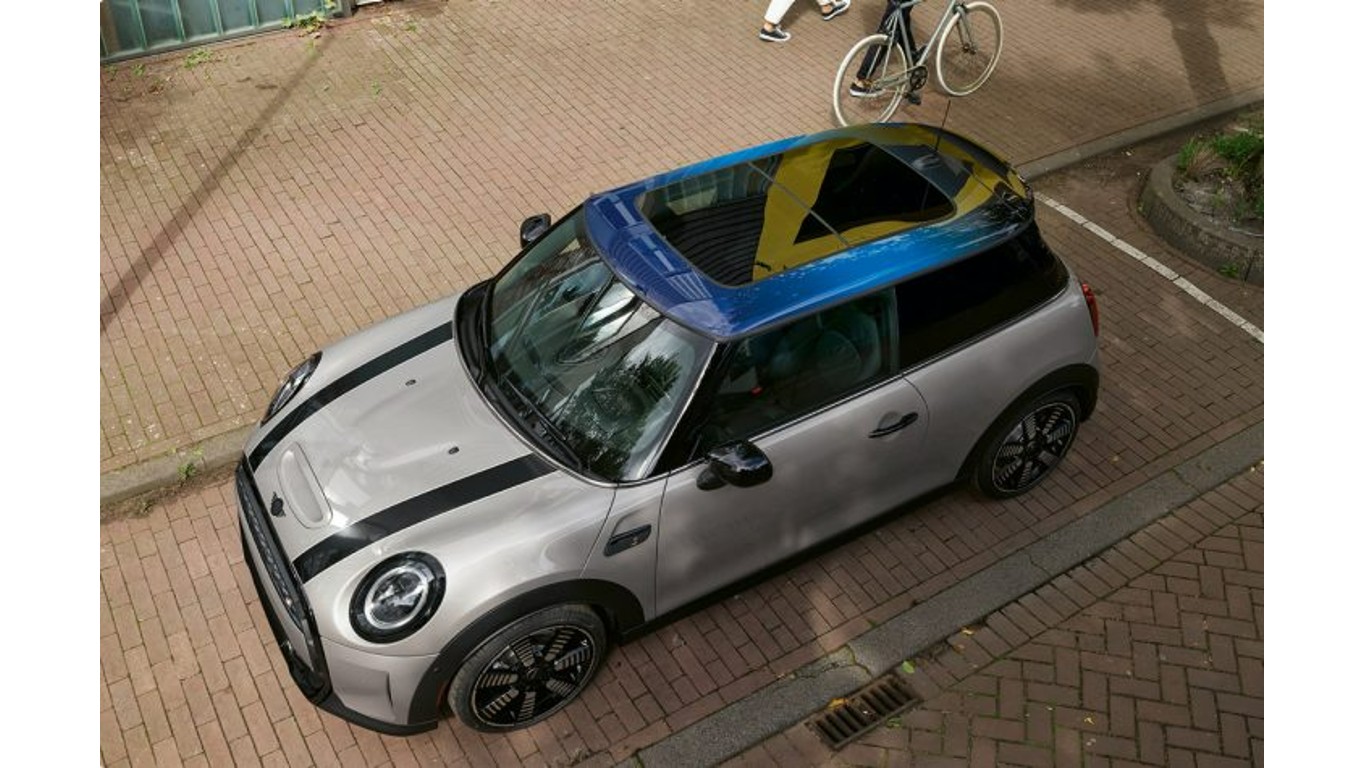
18. MINI
> 2023 APEAL score: 856/1,000
> Segment: Mass Market — segment average score: 837
> 2022 APEAL score: 848/1000 #19 out of 32
> Sales H1, 2023: 14,868 (+23.9% from H1, 2022)
> Parent company: BMW Group
17. Audi
> 2023 APEAL score: 855/1,000
> Segment: Premium — segment average score: 871
> 2022 APEAL score: 847/1000 #20 out of 32
> Sales H1, 2023: 108,190 (+27.1% from H1, 2022)
> Parent company: Volkswagen Group
[in-text-ad]
16. Infiniti
> 2023 APEAL score: 854/1,000
> Segment: Premium — segment average score: 871
> 2022 APEAL score: 866/1000 #11 out of 32
> Sales H1, 2023: 32,284 (+48.1% from H1, 2022)
> Parent company: Renault-Nissan-Mitsubishi Alliance
15. Acura
> 2023 APEAL score: 853/1,000
> Segment: Premium — segment average score: 871
> 2022 APEAL score: 851/1000 #16 (tied) out of 32
> Sales H1, 2023: 73,642 (+39.3% from H1, 2022)
> Parent company: Honda Motor Company
14. Kia
> 2023 APEAL score: 851/1,000
> Segment: Mass Market — segment average score: 837
> 2022 APEAL score: 849/1000 #18 out of 32
> Sales H1, 2023: 394,350 (+22.5% from H1, 2022)
> Parent company: Hyundai Motor Group
[in-text-ad-2]
13. Chevrolet
> 2023 APEAL score: 846/1,000
> Segment: Mass Market — segment average score: 837
> 2022 APEAL score: 851/1000 #16 (tied) out of 32
> Sales H1, 2023: 849,796 (+17.0% from H1, 2022)
> Parent company: General Motors
12. Hyundai
> 2023 APEAL score: 844/1,000
> Segment: Mass Market — segment average score: 837
> 2022 APEAL score: 846/1000 #21 out of 32
> Sales H1, 2023: 389,924 (+15.9% from H1, 2022)
> Parent company: Hyundai Motor Group
[in-text-ad]
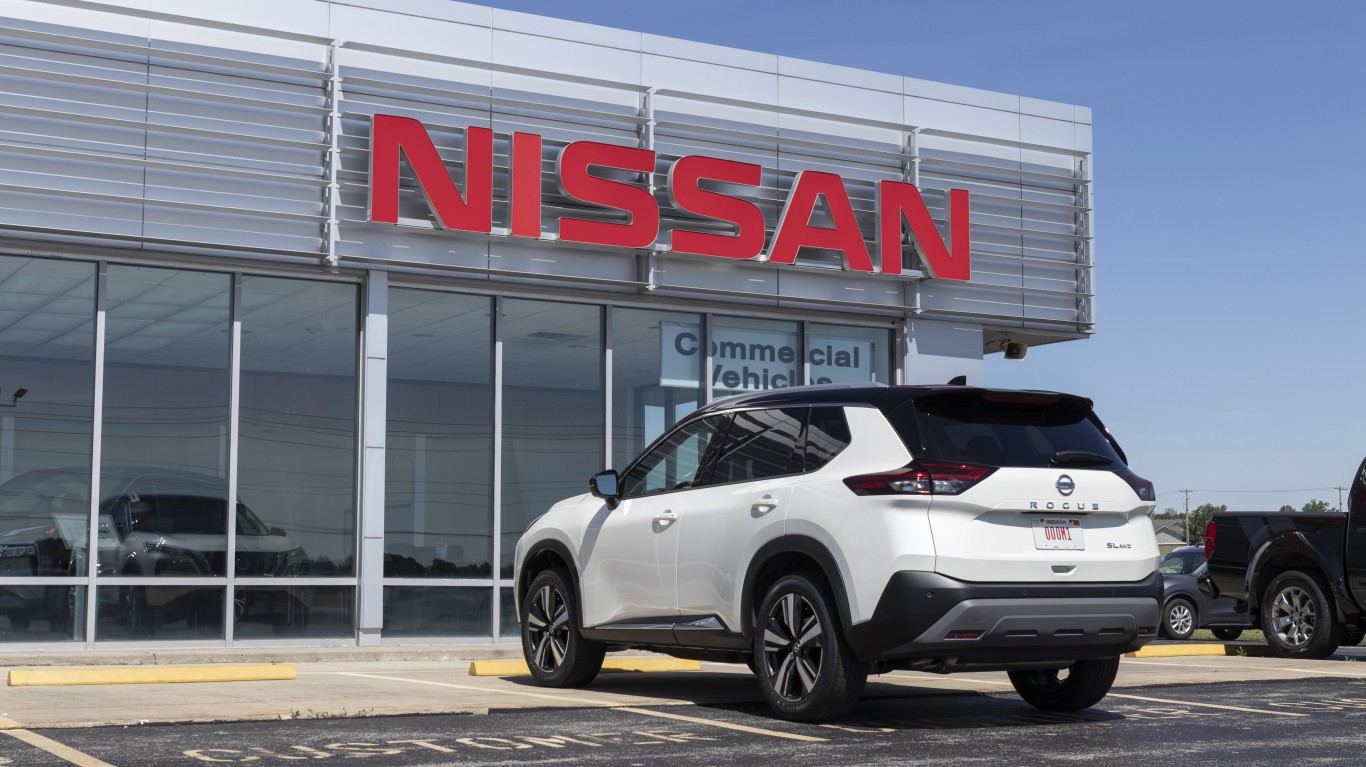
11. Nissan
> 2023 APEAL score: 843/1,000
> Segment: Mass Market — segment average score: 837
> 2022 APEAL score: 845/1000 #22 (tied) out of 32
> Sales H1, 2023: 447,882 (+23.6% from H1, 2022)
> Parent company: Renault-Nissan-Mitsubishi Alliance
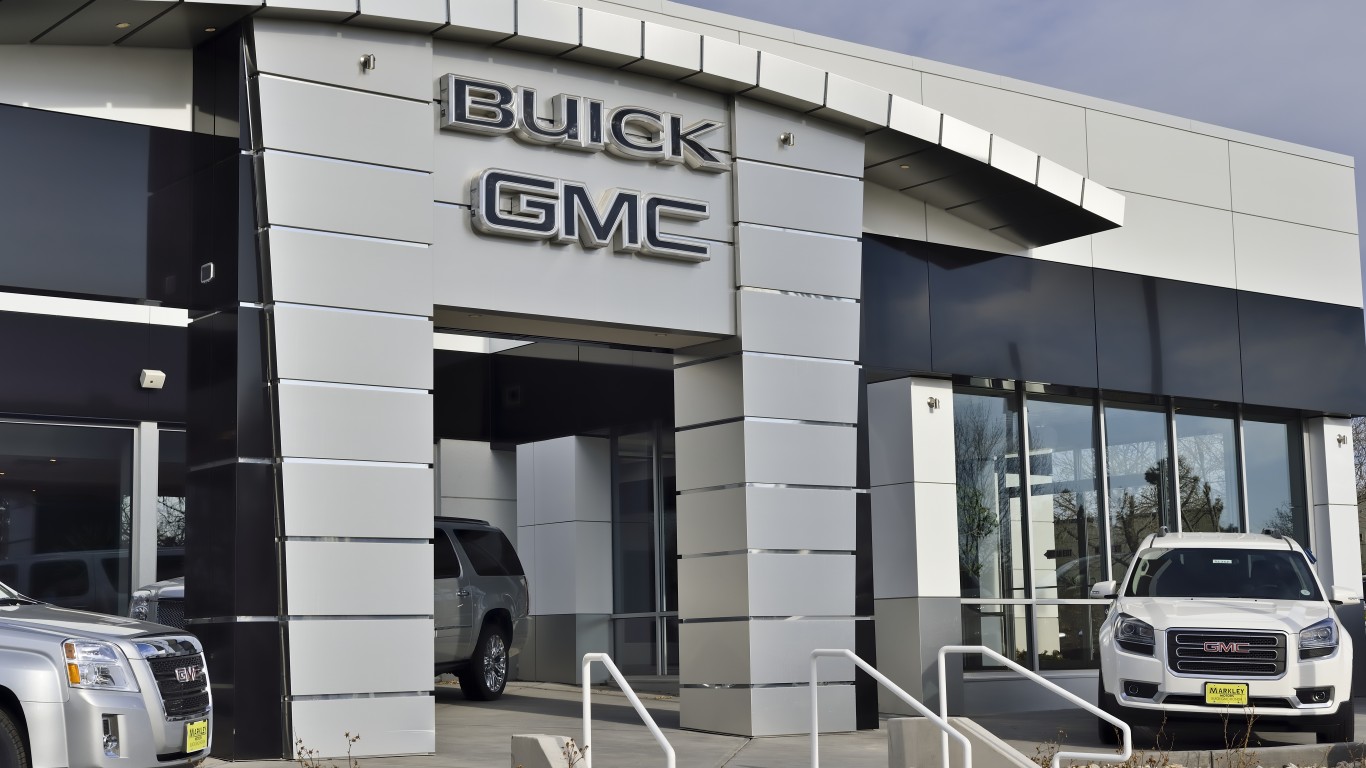
10. Buick
> 2023 APEAL score: 841/1,000
> Segment: Mass Market — segment average score: 837
> 2022 APEAL score: 843/1000 #25 out of 32
> Sales H1, 2023: 80,891 (+68.4% from H1, 2022)
> Parent company: General Motors
9. Ford
> 2023 APEAL score: 838/1,000
> Segment: Mass Market — segment average score: 837
> 2022 APEAL score: 845/1000 #22 (tied) out of 32
> Sales H1, 2023: 965,232 (+11.4% from H1, 2022)
> Parent company: Ford Motor Co.
[in-text-ad-2]
8. Honda
> 2023 APEAL score: 835/1,000
> Segment: Mass Market — segment average score: 837
> 2022 APEAL score: 824/1000 #32 out of 32
> Sales H1, 2023: 557,890 (+23.1% from H1, 2022)
> Parent company: Honda Motor Co.
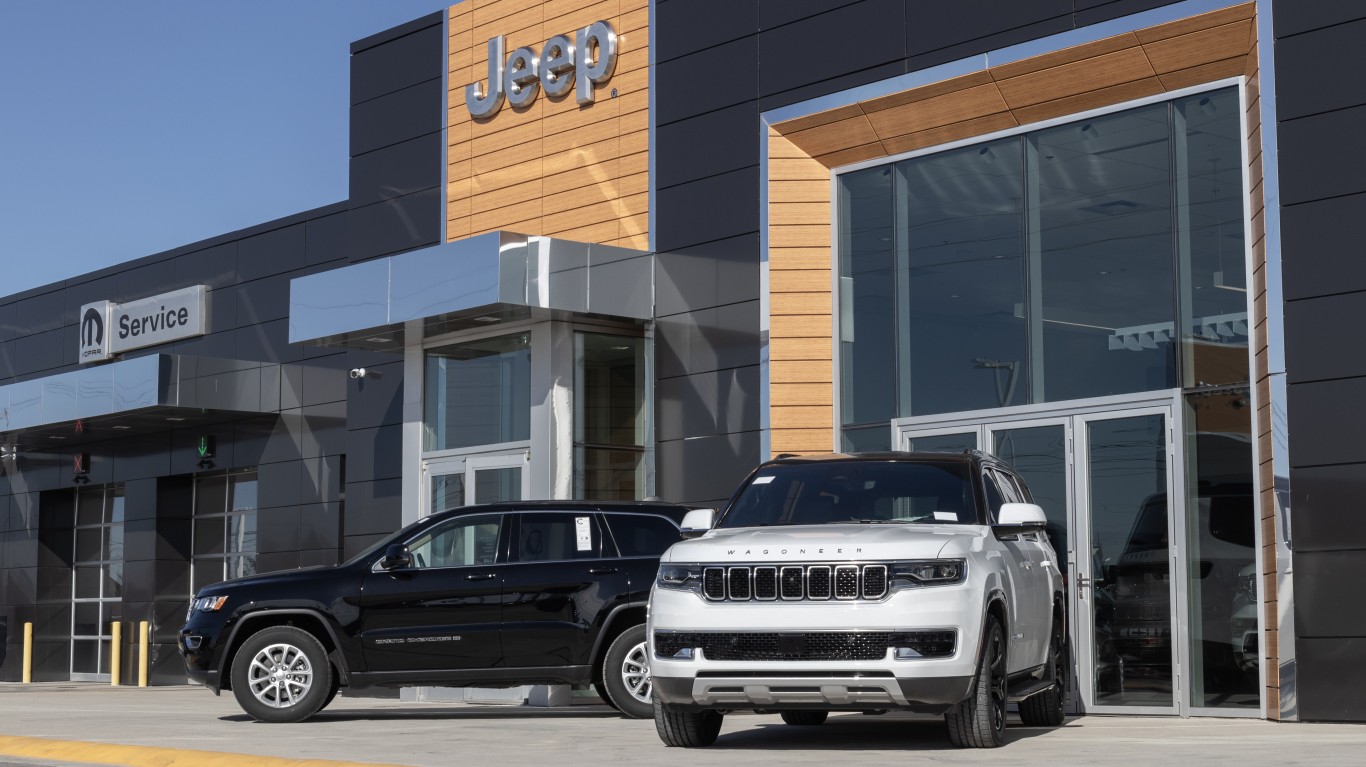
7. Jeep
> 2023 APEAL score: 831/1,000
> Segment: Mass Market — segment average score: 837
> 2022 APEAL score: 845/1000 #22 (tied) out of 32
> Sales H1, 2023: 334,818 (-11.9% from H1, 2022)
> Parent company: Stellantis
[in-text-ad]
6. Mitsubishi
> 2023 APEAL score: 831/1,000
> Segment: Mass Market — segment average score: 837
> 2022 APEAL score: 840/1000 #26 out of 32
> Sales H1, 2023: 45,538 (-5.7% from H1, 2022)
> Parent company: Renault-Nissan-Mitsubishi Alliance
5. Mazda
> 2023 APEAL score: 828/1,000
> Segment: Mass Market — segment average score: 837
> 2022 APEAL score: 839/1000 #27 (tied) out of 32
> Sales H1, 2023: 185,473 (+29.9% from H1, 2022)
> Parent company: Mazda Motor Corp.
4. Volkswagen
> 2023 APEAL score: 827/1,000
> Segment: Mass Market — segment average score: 837
> 2022 APEAL score: 839/1000 #27 (tied) out of 32
> Sales H1, 2023: 144,784 (+1.8% from H1, 2022)
> Parent company: Volkswagen Group
[in-text-ad-2]
3. Toyota
> 2023 APEAL score: 824/1,000
> Segment: Mass Market — segment average score: 837
> 2022 APEAL score: 831/1000 #30 out of 32
> Sales H1, 2023: 875,959 (+3.0% from H1, 2022)
> Parent company: Toyota Motor Corp.
2. Subaru
> 2023 APEAL score: 824/1,000
> Segment: Mass Market — segment average score: 837
> 2022 APEAL score: 833/1000 #29 out of 32
> Sales H1, 2023: 304,089 (+15.3% from H1, 2022)
> Parent company: Subaru Corp.
[in-text-ad]
1. Chrysler
> 2023 APEAL score: 810/1,000
> Segment: Mass Market — segment average score: 837
> 2022 APEAL score: 829/1000 #31 out of 32
> Sales H1, 2023: 81,042 (+22.7% from H1, 2022)
> Parent company: Stellantis
Are you ahead, or behind on retirement? For families with more than $500,000 saved for retirement, finding a financial advisor who puts your interest first can be the difference, and today it’s easier than ever. SmartAsset’s free tool matches you with up to three fiduciary financial advisors who serve your area in minutes. Each advisor has been carefully vetted and must act in your best interests. Start your search now.
If you’ve saved and built a substantial nest egg for you and your family, don’t delay; get started right here and help your retirement dreams become a retirement reality.
Thank you for reading! Have some feedback for us?
Contact the 24/7 Wall St. editorial team.