Special Report
Weekly Update: Here's How Bad COVID Is Right Now in Every State

Published:

As the world cautiously emerges from the grip of the COVID-19 pandemic, concerns loom large as surges of the virus reemerge in various regions. In the U.S., several states are seeing upticks in hospitalizations and positive test rates, and health officials and local governments are once again urging measures such as mask mandates and booster shots to curb the spread. (These are the states with the most health-conscious residents.)
To determine the states where COVID-19 is the worst right now, 24/7 Tempo reviewed data on recent COVID-19 hospital admissions from the Centers for Disease Control and Prevention. States were ranked based on the number of new hospital admissions due to COVID-19 per 100,000 state residents for the week of Sept. 3-9, 2023.
Analysis of CDC data shows clear regional divides, which have not changed much since the previous week. Generally, Southern states are still dealing with the highest new weekly COVID-19 hospitalization admission rates, with Florida again topping the list for new weekly admissions per capita, followed closely by Arkansas and Louisiana. (Florida accounts for almost half the places on our list of 25 American vacation destinations emerging as COVID hotspots.)
The news is bad in other places, too. Positive test rates have skyrocketed to over 17% in New Mexico, Oklahoma, and Arkansas, indicating widespread community transmission.
Click here to learn how bad COVID is right now in every state
Click here for a detailed methodology
States like Minnesota and New Hampshire have relatively low hospital admission rates and have maintained this performance since August 2020. This suggests stable COVID-19 management. Vermont and Hawaii are among the states with consistently low death rates as well as hospital admissions, again indicating successful management of the pandemic.
Though COVID precautions have long been relaxed, the brewing fall surge reminds us that the virus remains a threat. With colder weather approaching, health experts warn vulnerable individuals to exercise caution, as runaway COVID transmission could continue getting people very sick this winter.

50. Maine
> New weekly COVID-19 hospital admissions, Sept. 3-9, 2023: 2.7 per 100,000 (38 total)
> Avg COVID-19 hospital admissions rate since Aug. 1, 2020: 1,092.2 per 100,000 (4th lowest)
> Avg COVID-19 death rate since January 2020: 237.1 per 100,000 (8th lowest)
> Current COVID-19 test positivity rate: 12.4% (11th lowest)
[in-text-ad]
49. North Dakota
> New weekly COVID-19 hospital admissions, Sept. 3-9, 2023: 3.0 per 100,000 (23 total)
> Avg COVID-19 hospital admissions rate since Aug. 1, 2020: 1,930.5 per 100,000 (21st highest)
> Avg COVID-19 death rate since January 2020: 338.5 per 100,000 (21st lowest)
> Current COVID-19 test positivity rate: 12.5% (17th lowest)

48. Minnesota
> New weekly COVID-19 hospital admissions, Sept. 3-9, 2023: 3.1 per 100,000 (176 total)
> Avg COVID-19 hospital admissions rate since Aug. 1, 2020: 1,378.8 per 100,000 (9th lowest)
> Avg COVID-19 death rate since January 2020: 271.9 per 100,000 (10th lowest)
> Current COVID-19 test positivity rate: 13.4% (16th highest)

47. New Mexico
> New weekly COVID-19 hospital admissions, Sept. 3-9, 2023: 3.2 per 100,000 (68 total)
> Avg COVID-19 hospital admissions rate since Aug. 1, 2020: 1,810.5 per 100,000 (22nd lowest)
> Avg COVID-19 death rate since January 2020: 441.9 per 100,000 (5th highest)
> Current COVID-19 test positivity rate: 17.3% (the highest)
[in-text-ad-2]
46. Iowa
> New weekly COVID-19 hospital admissions, Sept. 3-9, 2023: 3.2 per 100,000 (104 total)
> Avg COVID-19 hospital admissions rate since Aug. 1, 2020: 1,696.2 per 100,000 (19th lowest)
> Avg COVID-19 death rate since January 2020: 347.6 per 100,000 (25th highest)
> Current COVID-19 test positivity rate: 16.4% (6th highest)

45. Wisconsin
> New weekly COVID-19 hospital admissions, Sept. 3-9, 2023: 3.3 per 100,000 (192 total)
> Avg COVID-19 hospital admissions rate since Aug. 1, 2020: 2,145.3 per 100,000 (10th highest)
> Avg COVID-19 death rate since January 2020: 291.3 per 100,000 (14th lowest)
> Current COVID-19 test positivity rate: 13.4% (16th highest)
[in-text-ad]
44. Nebraska
> New weekly COVID-19 hospital admissions, Sept. 3-9, 2023: 3.3 per 100,000 (65 total)
> Avg COVID-19 hospital admissions rate since Aug. 1, 2020: 1,602.7 per 100,000 (17th lowest)
> Avg COVID-19 death rate since January 2020: 293.3 per 100,000 (15th lowest)
> Current COVID-19 test positivity rate: 16.4% (6th highest)

43. Arizona
> New weekly COVID-19 hospital admissions, Sept. 3-9, 2023: 3.6 per 100,000 (262 total)
> Avg COVID-19 hospital admissions rate since Aug. 1, 2020: 2,086.5 per 100,000 (14th highest)
> Avg COVID-19 death rate since January 2020: 403.8 per 100,000 (12th highest)
> Current COVID-19 test positivity rate: 13.2% (22nd highest)
42. New Hampshire
> New weekly COVID-19 hospital admissions, Sept. 3-9, 2023: 3.6 per 100,000 (50 total)
> Avg COVID-19 hospital admissions rate since Aug. 1, 2020: 1,301.2 per 100,000 (6th lowest)
> Avg COVID-19 death rate since January 2020: 236.1 per 100,000 (7th lowest)
> Current COVID-19 test positivity rate: 12.4% (11th lowest)
[in-text-ad-2]

41. Utah
> New weekly COVID-19 hospital admissions, Sept. 3-9, 2023: 3.7 per 100,000 (125 total)
> Avg COVID-19 hospital admissions rate since Aug. 1, 2020: 1,388.3 per 100,000 (10th lowest)
> Avg COVID-19 death rate since January 2020: 163.5 per 100,000 (3rd lowest)
> Current COVID-19 test positivity rate: 12.5% (17th lowest)

40. Idaho
> New weekly COVID-19 hospital admissions, Sept. 3-9, 2023: 3.9 per 100,000 (75 total)
> Avg COVID-19 hospital admissions rate since Aug. 1, 2020: 1,426.5 per 100,000 (12th lowest)
> Avg COVID-19 death rate since January 2020: 284.4 per 100,000 (13th lowest)
> Current COVID-19 test positivity rate: 14.4% (12th highest)
[in-text-ad]

39. Washington
> New weekly COVID-19 hospital admissions, Sept. 3-9, 2023: 4.0 per 100,000 (313 total)
> Avg COVID-19 hospital admissions rate since Aug. 1, 2020: 986.2 per 100,000 (2nd lowest)
> Avg COVID-19 death rate since January 2020: 193.6 per 100,000 (4th lowest)
> Current COVID-19 test positivity rate: 14.4% (12th highest)
38. Michigan
> New weekly COVID-19 hospital admissions, Sept. 3-9, 2023: 4.1 per 100,000 (415 total)
> Avg COVID-19 hospital admissions rate since Aug. 1, 2020: 1,919.9 per 100,000 (22nd highest)
> Avg COVID-19 death rate since January 2020: 376.2 per 100,000 (17th highest)
> Current COVID-19 test positivity rate: 13.4% (16th highest)
37. Delaware
> New weekly COVID-19 hospital admissions, Sept. 3-9, 2023: 4.3 per 100,000 (44 total)
> Avg COVID-19 hospital admissions rate since Aug. 1, 2020: 1,975.2 per 100,000 (18th highest)
> Avg COVID-19 death rate since January 2020: 339.7 per 100,000 (23rd lowest)
> Current COVID-19 test positivity rate: 10.4% (5th lowest)
[in-text-ad-2]
36. Colorado
> New weekly COVID-19 hospital admissions, Sept. 3-9, 2023: 4.5 per 100,000 (262 total)
> Avg COVID-19 hospital admissions rate since Aug. 1, 2020: 1,658.2 per 100,000 (18th lowest)
> Avg COVID-19 death rate since January 2020: 256.5 per 100,000 (9th lowest)
> Current COVID-19 test positivity rate: 12.5% (17th lowest)

35. Rhode Island
> New weekly COVID-19 hospital admissions, Sept. 3-9, 2023: 4.6 per 100,000 (50 total)
> Avg COVID-19 hospital admissions rate since Aug. 1, 2020: 1,200.8 per 100,000 (5th lowest)
> Avg COVID-19 death rate since January 2020: 364.5 per 100,000 (20th highest)
> Current COVID-19 test positivity rate: 12.4% (11th lowest)
[in-text-ad]

34. Alaska
> New weekly COVID-19 hospital admissions, Sept. 3-9, 2023: 4.6 per 100,000 (34 total)
> Avg COVID-19 hospital admissions rate since Aug. 1, 2020: 1,327.9 per 100,000 (7th lowest)
> Avg COVID-19 death rate since January 2020: 206.9 per 100,000 (5th lowest)
> Current COVID-19 test positivity rate: 14.4% (12th highest)

33. Maryland
> New weekly COVID-19 hospital admissions, Sept. 3-9, 2023: 4.7 per 100,000 (290 total)
> Avg COVID-19 hospital admissions rate since Aug. 1, 2020: 1,555.8 per 100,000 (14th lowest)
> Avg COVID-19 death rate since January 2020: 294.1 per 100,000 (16th lowest)
> Current COVID-19 test positivity rate: 10.4% (5th lowest)

32. Indiana
> New weekly COVID-19 hospital admissions, Sept. 3-9, 2023: 4.8 per 100,000 (331 total)
> Avg COVID-19 hospital admissions rate since Aug. 1, 2020: 2,039.8 per 100,000 (15th highest)
> Avg COVID-19 death rate since January 2020: 379.8 per 100,000 (16th highest)
> Current COVID-19 test positivity rate: 13.4% (16th highest)
[in-text-ad-2]

31. New Jersey
> New weekly COVID-19 hospital admissions, Sept. 3-9, 2023: 4.9 per 100,000 (450 total)
> Avg COVID-19 hospital admissions rate since Aug. 1, 2020: 1,862.7 per 100,000 (25th lowest)
> Avg COVID-19 death rate since January 2020: 381.7 per 100,000 (15th highest)
> Current COVID-19 test positivity rate: 14.9% (10th highest)

30. Ohio
> New weekly COVID-19 hospital admissions, Sept. 3-9, 2023: 5.0 per 100,000 (587 total)
> Avg COVID-19 hospital admissions rate since Aug. 1, 2020: 2,217.2 per 100,000 (7th highest)
> Avg COVID-19 death rate since January 2020: 423.2 per 100,000 (7th highest)
> Current COVID-19 test positivity rate: 13.4% (16th highest)
[in-text-ad]
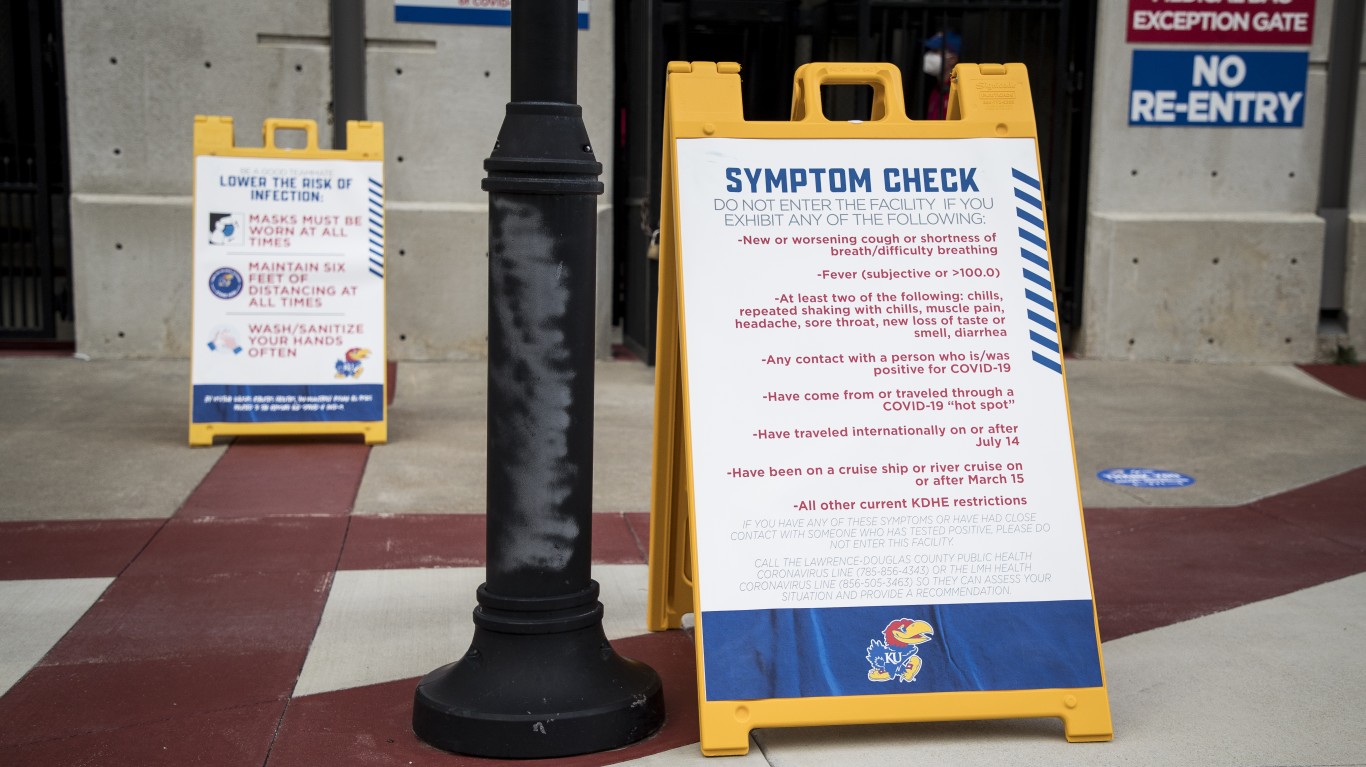
29. Kansas
> New weekly COVID-19 hospital admissions, Sept. 3-9, 2023: 5.0 per 100,000 (148 total)
> Avg COVID-19 hospital admissions rate since Aug. 1, 2020: 1,942.1 per 100,000 (20th highest)
> Avg COVID-19 death rate since January 2020: 360.8 per 100,000 (22nd highest)
> Current COVID-19 test positivity rate: 16.4% (6th highest)

28. Mississippi
> New weekly COVID-19 hospital admissions, Sept. 3-9, 2023: 5.1 per 100,000 (149 total)
> Avg COVID-19 hospital admissions rate since Aug. 1, 2020: 1,899.2 per 100,000 (24th highest)
> Avg COVID-19 death rate since January 2020: 504.7 per 100,000 (the highest)
> Current COVID-19 test positivity rate: 12.7% (25th lowest)

27. Illinois
> New weekly COVID-19 hospital admissions, Sept. 3-9, 2023: 5.1 per 100,000 (643 total)
> Avg COVID-19 hospital admissions rate since Aug. 1, 2020: 1,822.5 per 100,000 (23rd lowest)
> Avg COVID-19 death rate since January 2020: 320.9 per 100,000 (19th lowest)
> Current COVID-19 test positivity rate: 13.4% (16th highest)
[in-text-ad-2]

26. Nevada
> New weekly COVID-19 hospital admissions, Sept. 3-9, 2023: 5.2 per 100,000 (166 total)
> Avg COVID-19 hospital admissions rate since Aug. 1, 2020: 2,029.8 per 100,000 (16th highest)
> Avg COVID-19 death rate since January 2020: 375.5 per 100,000 (18th highest)
> Current COVID-19 test positivity rate: 13.2% (22nd highest)

25. Pennsylvania
> New weekly COVID-19 hospital admissions, Sept. 3-9, 2023: 5.2 per 100,000 (680 total)
> Avg COVID-19 hospital admissions rate since Aug. 1, 2020: 1,890.3 per 100,000 (25th highest)
> Avg COVID-19 death rate since January 2020: 406.4 per 100,000 (11th highest)
> Current COVID-19 test positivity rate: 10.4% (5th lowest)
[in-text-ad]

24. Vermont
> New weekly COVID-19 hospital admissions, Sept. 3-9, 2023: 5.3 per 100,000 (34 total)
> Avg COVID-19 hospital admissions rate since Aug. 1, 2020: 973.6 per 100,000 (the lowest)
> Avg COVID-19 death rate since January 2020: 158.7 per 100,000 (2nd lowest)
> Current COVID-19 test positivity rate: 12.4% (11th lowest)

23. Virginia
> New weekly COVID-19 hospital admissions, Sept. 3-9, 2023: 5.5 per 100,000 (478 total)
> Avg COVID-19 hospital admissions rate since Aug. 1, 2020: 1,398.5 per 100,000 (11th lowest)
> Avg COVID-19 death rate since January 2020: 271.9 per 100,000 (11th lowest)
> Current COVID-19 test positivity rate: 10.4% (5th lowest)

22. Connecticut
> New weekly COVID-19 hospital admissions, Sept. 3-9, 2023: 5.6 per 100,000 (203 total)
> Avg COVID-19 hospital admissions rate since Aug. 1, 2020: 1,784.8 per 100,000 (20th lowest)
> Avg COVID-19 death rate since January 2020: 338.8 per 100,000 (22nd lowest)
> Current COVID-19 test positivity rate: 12.4% (11th lowest)
[in-text-ad-2]

21. Wyoming
> New weekly COVID-19 hospital admissions, Sept. 3-9, 2023: 5.7 per 100,000 (33 total)
> Avg COVID-19 hospital admissions rate since Aug. 1, 2020: 1,961.0 per 100,000 (19th highest)
> Avg COVID-19 death rate since January 2020: 368.6 per 100,000 (19th highest)
> Current COVID-19 test positivity rate: 12.5% (17th lowest)
20. North Carolina
> New weekly COVID-19 hospital admissions, Sept. 3-9, 2023: 5.8 per 100,000 (625 total)
> Avg COVID-19 hospital admissions rate since Aug. 1, 2020: 1,572.3 per 100,000 (16th lowest)
> Avg COVID-19 death rate since January 2020: 317.1 per 100,000 (18th lowest)
> Current COVID-19 test positivity rate: 12.7% (25th lowest)
[in-text-ad]

19. Oregon
> New weekly COVID-19 hospital admissions, Sept. 3-9, 2023: 5.9 per 100,000 (249 total)
> Avg COVID-19 hospital admissions rate since Aug. 1, 2020: 1,091.7 per 100,000 (3rd lowest)
> Avg COVID-19 death rate since January 2020: 219.3 per 100,000 (6th lowest)
> Current COVID-19 test positivity rate: 14.4% (12th highest)
18. Oklahoma
> New weekly COVID-19 hospital admissions, Sept. 3-9, 2023: 5.9 per 100,000 (239 total)
> Avg COVID-19 hospital admissions rate since Aug. 1, 2020: 2,736.1 per 100,000 (2nd highest)
> Avg COVID-19 death rate since January 2020: 486.2 per 100,000 (3rd highest)
> Current COVID-19 test positivity rate: 17.3% (the highest)

17. Montana
> New weekly COVID-19 hospital admissions, Sept. 3-9, 2023: 6.0 per 100,000 (67 total)
> Avg COVID-19 hospital admissions rate since Aug. 1, 2020: 2,678.7 per 100,000 (3rd highest)
> Avg COVID-19 death rate since January 2020: 344.7 per 100,000 (25th lowest)
> Current COVID-19 test positivity rate: 12.5% (17th lowest)
[in-text-ad-2]

16. Georgia
> New weekly COVID-19 hospital admissions, Sept. 3-9, 2023: 6.0 per 100,000 (659 total)
> Avg COVID-19 hospital admissions rate since Aug. 1, 2020: 2,194.8 per 100,000 (9th highest)
> Avg COVID-19 death rate since January 2020: 331.8 per 100,000 (20th lowest)
> Current COVID-19 test positivity rate: 12.7% (25th lowest)

15. South Dakota
> New weekly COVID-19 hospital admissions, Sept. 3-9, 2023: 6.3 per 100,000 (57 total)
> Avg COVID-19 hospital admissions rate since Aug. 1, 2020: 2,112.8 per 100,000 (11th highest)
> Avg COVID-19 death rate since January 2020: 360.3 per 100,000 (23rd highest)
> Current COVID-19 test positivity rate: 12.5% (17th lowest)
[in-text-ad]

14. Massachusetts
> New weekly COVID-19 hospital admissions, Sept. 3-9, 2023: 6.5 per 100,000 (453 total)
> Avg COVID-19 hospital admissions rate since Aug. 1, 2020: 1,487.5 per 100,000 (13th lowest)
> Avg COVID-19 death rate since January 2020: 300.3 per 100,000 (17th lowest)
> Current COVID-19 test positivity rate: 12.4% (11th lowest)

13. Tennessee
> New weekly COVID-19 hospital admissions, Sept. 3-9, 2023: 6.6 per 100,000 (465 total)
> Avg COVID-19 hospital admissions rate since Aug. 1, 2020: 1,853.5 per 100,000 (24th lowest)
> Avg COVID-19 death rate since January 2020: 407.3 per 100,000 (10th highest)
> Current COVID-19 test positivity rate: 12.7% (25th lowest)

12. Texas
> New weekly COVID-19 hospital admissions, Sept. 3-9, 2023: 6.7 per 100,000 (2,003 total)
> Avg COVID-19 hospital admissions rate since Aug. 1, 2020: 2,028.4 per 100,000 (17th highest)
> Avg COVID-19 death rate since January 2020: 340.7 per 100,000 (24th lowest)
> Current COVID-19 test positivity rate: 17.3% (the highest)
[in-text-ad-2]

11. Missouri
> New weekly COVID-19 hospital admissions, Sept. 3-9, 2023: 6.8 per 100,000 (418 total)
> Avg COVID-19 hospital admissions rate since Aug. 1, 2020: 2,112.5 per 100,000 (12th highest)
> Avg COVID-19 death rate since January 2020: 364.1 per 100,000 (21st highest)
> Current COVID-19 test positivity rate: 16.4% (6th highest)

10. California
> New weekly COVID-19 hospital admissions, Sept. 3-9, 2023: 7.0 per 100,000 (2,744 total)
> Avg COVID-19 hospital admissions rate since Aug. 1, 2020: 1,561.2 per 100,000 (15th lowest)
> Avg COVID-19 death rate since January 2020: 279.3 per 100,000 (12th lowest)
> Current COVID-19 test positivity rate: 13.2% (22nd highest)
[in-text-ad]

9. South Carolina
> New weekly COVID-19 hospital admissions, Sept. 3-9, 2023: 7.3 per 100,000 (386 total)
> Avg COVID-19 hospital admissions rate since Aug. 1, 2020: 1,797.9 per 100,000 (21st lowest)
> Avg COVID-19 death rate since January 2020: 403.5 per 100,000 (13th highest)
> Current COVID-19 test positivity rate: 12.7% (25th lowest)

8. Kentucky
> New weekly COVID-19 hospital admissions, Sept. 3-9, 2023: 7.7 per 100,000 (348 total)
> Avg COVID-19 hospital admissions rate since Aug. 1, 2020: 3,452.1 per 100,000 (the highest)
> Avg COVID-19 death rate since January 2020: 442.9 per 100,000 (4th highest)
> Current COVID-19 test positivity rate: 12.7% (25th lowest)

7. New York
> New weekly COVID-19 hospital admissions, Sept. 3-9, 2023: 7.8 per 100,000 (1,539 total)
> Avg COVID-19 hospital admissions rate since Aug. 1, 2020: 1,912.4 per 100,000 (23rd highest)
> Avg COVID-19 death rate since January 2020: 412.8 per 100,000 (8th highest)
> Current COVID-19 test positivity rate: 14.9% (10th highest)
[in-text-ad-2]

6. Hawaii
> New weekly COVID-19 hospital admissions, Sept. 3-9, 2023: 7.9 per 100,000 (114 total)
> Avg COVID-19 hospital admissions rate since Aug. 1, 2020: 1,356.3 per 100,000 (8th lowest)
> Avg COVID-19 death rate since January 2020: 136.2 per 100,000 (the lowest)
> Current COVID-19 test positivity rate: 13.2% (22nd highest)

5. Alabama
> New weekly COVID-19 hospital admissions, Sept. 3-9, 2023: 8.1 per 100,000 (410 total)
> Avg COVID-19 hospital admissions rate since Aug. 1, 2020: 2,306.7 per 100,000 (6th highest)
> Avg COVID-19 death rate since January 2020: 441.2 per 100,000 (6th highest)
> Current COVID-19 test positivity rate: 12.7% (25th lowest)
[in-text-ad]

4. West Virginia
> New weekly COVID-19 hospital admissions, Sept. 3-9, 2023: 8.2 per 100,000 (146 total)
> Avg COVID-19 hospital admissions rate since Aug. 1, 2020: 2,387.7 per 100,000 (5th highest)
> Avg COVID-19 death rate since January 2020: 487.5 per 100,000 (2nd highest)
> Current COVID-19 test positivity rate: 10.4% (5th lowest)

3. Louisiana
> New weekly COVID-19 hospital admissions, Sept. 3-9, 2023: 8.4 per 100,000 (384 total)
> Avg COVID-19 hospital admissions rate since Aug. 1, 2020: 2,090.7 per 100,000 (13th highest)
> Avg COVID-19 death rate since January 2020: 385.3 per 100,000 (14th highest)
> Current COVID-19 test positivity rate: 17.3% (the highest)

2. Arkansas
> New weekly COVID-19 hospital admissions, Sept. 3-9, 2023: 8.9 per 100,000 (270 total)
> Avg COVID-19 hospital admissions rate since Aug. 1, 2020: 2,212.6 per 100,000 (8th highest)
> Avg COVID-19 death rate since January 2020: 412.3 per 100,000 (9th highest)
> Current COVID-19 test positivity rate: 17.3% (the highest)
[in-text-ad-2]

1. Florida
> New weekly COVID-19 hospital admissions, Sept. 3-9, 2023: 10.3 per 100,000 (2,287 total)
> Avg COVID-19 hospital admissions rate since Aug. 1, 2020: 2,565.5 per 100,000 (4th highest)
> Avg COVID-19 death rate since January 2020: 360.1 per 100,000 (24th highest)
> Current COVID-19 test positivity rate: 12.7% (25th lowest)
Methodology
To determine the states where COVID-19 is the worst right now, 24/7 Tempo reviewed data on recent COVID-19 hospital admissions from the Centers for Disease Control and Prevention. States were ranked based on the number of new hospital admissions due to COVID-19 per 100,000 state residents for the week of Sept. 3-9, 2023. Supplemental data on the total number of recorded COVID-19 hospital admissions since Aug. 1, 2020; the total number of deaths due to COVID-19 since January 2020; and the COVID-19 test positivity rate for the week of Sept. 3-9, 2023 also came from the CDC. Population data used to adjust hospital admission and death counts per capita came from the U.S. Census Bureau’s Population and Housing Unit Estimates program and is for July 1, 2022.
Credit card companies are pulling out all the stops, with the issuers are offering insane travel rewards and perks.
We’re talking huge sign-up bonuses, points on every purchase, and benefits like lounge access, travel credits, and free hotel nights. For travelers, these rewards can add up to thousands of dollars in flights, upgrades, and luxury experiences every year.
It’s like getting paid to travel — and it’s available to qualified borrowers who know where to look.
We’ve rounded up some of the best travel credit cards on the market. Click here to see the list. Don’t miss these offers — they won’t be this good forever.
Thank you for reading! Have some feedback for us?
Contact the 24/7 Wall St. editorial team.