U.S. Census data confirms what has been reported in regard to population shifts in the United States in recent years and since the onset of the pandemic in 2020 — Americans moved out of higher-cost areas and decamped to more affordable towns and regions in the U.S.
Using metro area level data from the U.S. Census Bureau’s Population Estimates Program, 24/7 Tempo identified the cities losing the most people since the pandemic. Metro areas were ranked based on the percentage change in population due to net migration from April 1, 2020 to June 30, 2022. Data was aggregated from the county level to the metropolitan level using metropolitan statistical area definitions for July 2023 from the Census Bureau.
Major metropolitan areas such as New York City, Los Angeles, Chicago, San Francisco, and Washington, D.C., all experienced a decrease in population. High costs of living, increase in some forms of crime, and the ability for people to work remotely and therefore have the ability to move away from congested urban areas have all been factors in population loss. (These are America’s 26 poorest large cities.)
Of the 40 cities on the list, 14 are California metro areas. Residents fled six Louisiana metros on our list, including three in the top six: Houma-Bayou Cane-Thibodaux, New Orleans-Metairie, and Lake Charles. (See America’s best cities to live according to data.)
New York state, which has been losing population for some time before the pandemic, has four cities on the list, including Elmira — one of six on the list with a population of fewer than 100,000 people.
Click here for the 50 cities where the most people have left since the pandemic

50. Milwaukee-Waukesha, Wisconsin
> Population change due to net migration, 2020 to 2022: -1.1% (-17,421)
> Net domestic migration, 2020 to 2022: -22,312
> Net international migration, 2020 to 2022: +4,891
> Total population, 2022: 1,559,792
[in-text-ad]

49. Boston-Cambridge-Newton, Massachusetts-New Hampshire
> Population change due to net migration, 2020 to 2022: -1.1% (-55,269)
> Net domestic migration, 2020 to 2022: -104,501
> Net international migration, 2020 to 2022: +49,232
> Total population, 2022: 4,900,550

48. Boulder, Colorado
> Population change due to net migration, 2020 to 2022: -1.1% (-3,738)
> Net domestic migration, 2020 to 2022: -4,985
> Net international migration, 2020 to 2022: +1,247
> Total population, 2022: 327,468
47. Charleston, West Virginia
> Population change due to net migration, 2020 to 2022: -1.1% (-2,403)
> Net domestic migration, 2020 to 2022: -2,744
> Net international migration, 2020 to 2022: +341
> Total population, 2022: 204,297
[in-text-ad-2]

46. Washington-Arlington-Alexandria, DC-Virginia-Maryland-West Virginia
> Population change due to net migration, 2020 to 2022: -1.2% (-74,104)
> Net domestic migration, 2020 to 2022: -136,725
> Net international migration, 2020 to 2022: +62,621
> Total population, 2022: 6,265,183

45. Santa Rosa-Petaluma, California
> Population change due to net migration, 2020 to 2022: -1.2% (-5,780)
> Net domestic migration, 2020 to 2022: -6,612
> Net international migration, 2020 to 2022: +832
> Total population, 2022: 482,650
[in-text-ad]

44. Hanford-Corcoran, California
> Population change due to net migration, 2020 to 2022: -1.2% (-1,807)
> Net domestic migration, 2020 to 2022: -1,914
> Net international migration, 2020 to 2022: +107
> Total population, 2022: 152,981

43. Syracuse, New York
> Population change due to net migration, 2020 to 2022: -1.2% (-7,972)
> Net domestic migration, 2020 to 2022: -9,974
> Net international migration, 2020 to 2022: +2,002
> Total population, 2022: 653,633

42. Sumter, South Carolina
> Population change due to net migration, 2020 to 2022: -1.2% (-1,274)
> Net domestic migration, 2020 to 2022: -1,393
> Net international migration, 2020 to 2022: +119
> Total population, 2022: 104,012
[in-text-ad-2]

41. Jacksonville, North Carolina
> Population change due to net migration, 2020 to 2022: -1.2% (-2,476)
> Net domestic migration, 2020 to 2022: -2,458
> Net international migration, 2020 to 2022: -18
> Total population, 2022: 207,298

40. Peoria, Illinois
> Population change due to net migration, 2020 to 2022: -1.2% (-4,540)
> Net domestic migration, 2020 to 2022: -5,365
> Net international migration, 2020 to 2022: +825
> Total population, 2022: 363,445
[in-text-ad]

39. Enid, Oklahoma
> Population change due to net migration, 2020 to 2022: -1.2% (-785)
> Net domestic migration, 2020 to 2022: -913
> Net international migration, 2020 to 2022: +128
> Total population, 2022: 61,920

38. El Centro, California
> Population change due to net migration, 2020 to 2022: -1.4% (-2,487)
> Net domestic migration, 2020 to 2022: -2,782
> Net international migration, 2020 to 2022: +295
> Total population, 2022: 178,713
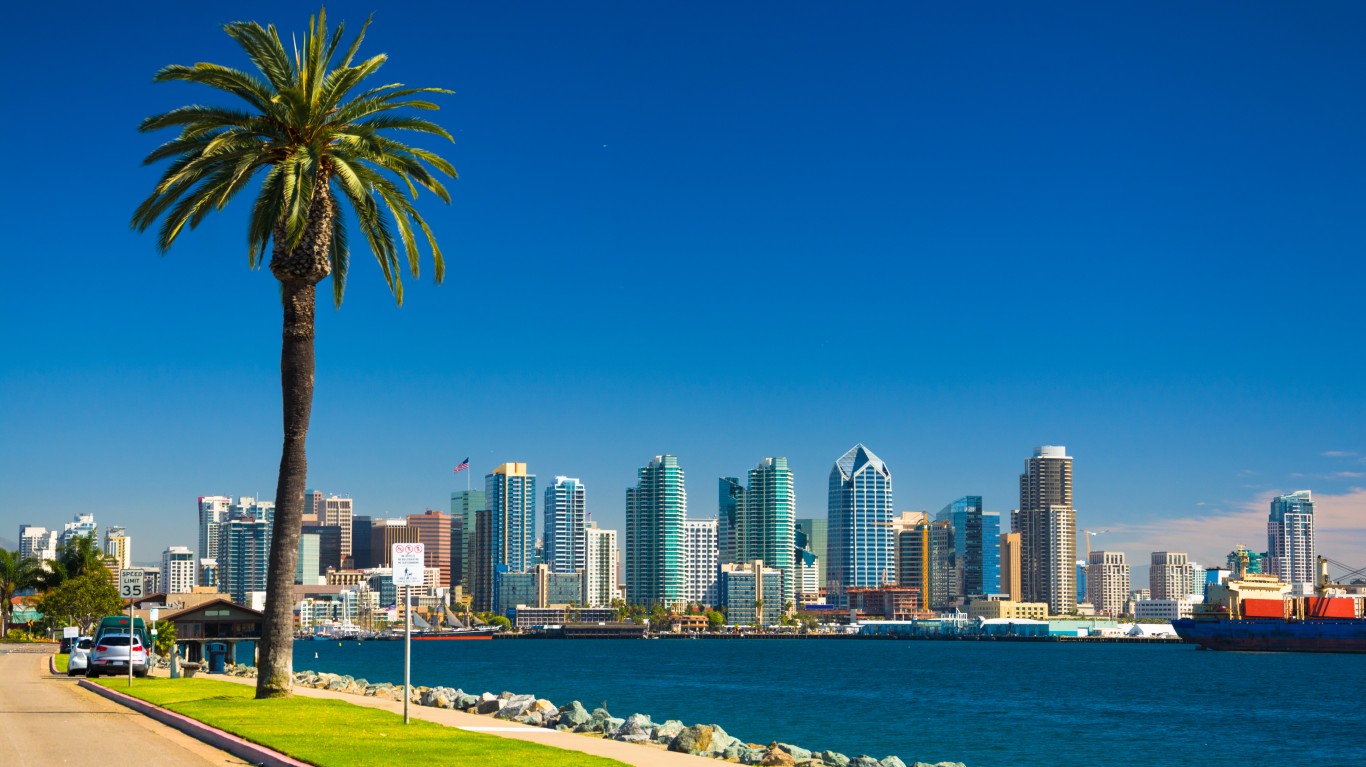
37. San Diego-Chula Vista-Carlsbad, California
> Population change due to net migration, 2020 to 2022: -1.4% (-46,521)
> Net domestic migration, 2020 to 2022: -58,429
> Net international migration, 2020 to 2022: +11,908
> Total population, 2022: 3,276,208
[in-text-ad-2]
36. Jackson, Mississippi
> Population change due to net migration, 2020 to 2022: -1.4% (-8,829)
> Net domestic migration, 2020 to 2022: -9,415
> Net international migration, 2020 to 2022: +586
> Total population, 2022: 610,904

35. Chico, California
> Population change due to net migration, 2020 to 2022: -1.5% (-3,085)
> Net domestic migration, 2020 to 2022: -3,323
> Net international migration, 2020 to 2022: +238
> Total population, 2022: 207,303
[in-text-ad]

34. Eagle Pass, Texas
> Population change due to net migration, 2020 to 2022: -1.5% (-847)
> Net domestic migration, 2020 to 2022: -1,100
> Net international migration, 2020 to 2022: +253
> Total population, 2022: 57,843

33. Vallejo, California
> Population change due to net migration, 2020 to 2022: -1.5% (-6,848)
> Net domestic migration, 2020 to 2022: -8,047
> Net international migration, 2020 to 2022: +1,199
> Total population, 2022: 448,747
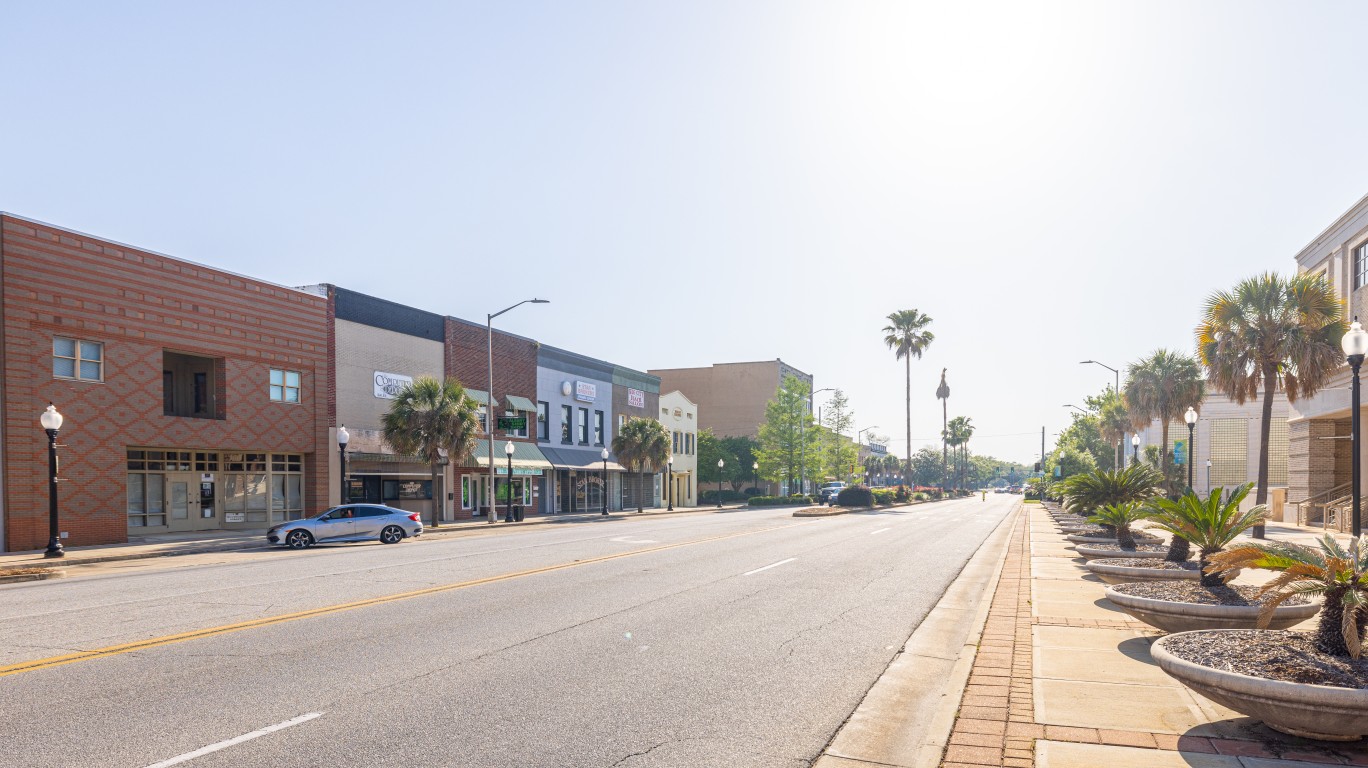
32. Albany, Georgia
> Population change due to net migration, 2020 to 2022: -1.5% (-2,272)
> Net domestic migration, 2020 to 2022: -2,356
> Net international migration, 2020 to 2022: +84
> Total population, 2022: 145,786
[in-text-ad-2]

31. Grand Island, Nebraska
> Population change due to net migration, 2020 to 2022: -1.5% (-1,183)
> Net domestic migration, 2020 to 2022: -1,567
> Net international migration, 2020 to 2022: +384
> Total population, 2022: 76,333

30. Monroe, Luoisiana
> Population change due to net migration, 2020 to 2022: -1.6% (-3,541)
> Net domestic migration, 2020 to 2022: -3,772
> Net international migration, 2020 to 2022: +231
> Total population, 2022: 222,695
[in-text-ad]

29. Columbus, Georgia-Alabama
> Population change due to net migration, 2020 to 2022: -1.6% (-5,207)
> Net domestic migration, 2020 to 2022: -6,004
> Net international migration, 2020 to 2022: +797
> Total population, 2022: 324,110

28. Alexandria, Louisiana
> Population change due to net migration, 2020 to 2022: -1.6% (-2,465)
> Net domestic migration, 2020 to 2022: -2,626
> Net international migration, 2020 to 2022: +161
> Total population, 2022: 149,189

27. Vineland, New Jersey
> Population change due to net migration, 2020 to 2022: -1.7% (-2,561)
> Net domestic migration, 2020 to 2022: -2,925
> Net international migration, 2020 to 2022: +364
> Total population, 2022: 151,356
[in-text-ad-2]

26. Laredo, Texas
> Population change due to net migration, 2020 to 2022: -1.7% (-4,478)
> Net domestic migration, 2020 to 2022: -5,784
> Net international migration, 2020 to 2022: +1,306
> Total population, 2022: 267,780

25. Watertown-Fort Drum, New York
> Population change due to net migration, 2020 to 2022: -1.7% (-2,034)
> Net domestic migration, 2020 to 2022: -2,248
> Net international migration, 2020 to 2022: +214
> Total population, 2022: 116,637
[in-text-ad]

24. Grand Forks, North Dakota-Minnesota
> Population change due to net migration, 2020 to 2022: -1.7% (-1,824)
> Net domestic migration, 2020 to 2022: -2,103
> Net international migration, 2020 to 2022: +279
> Total population, 2022: 103,144
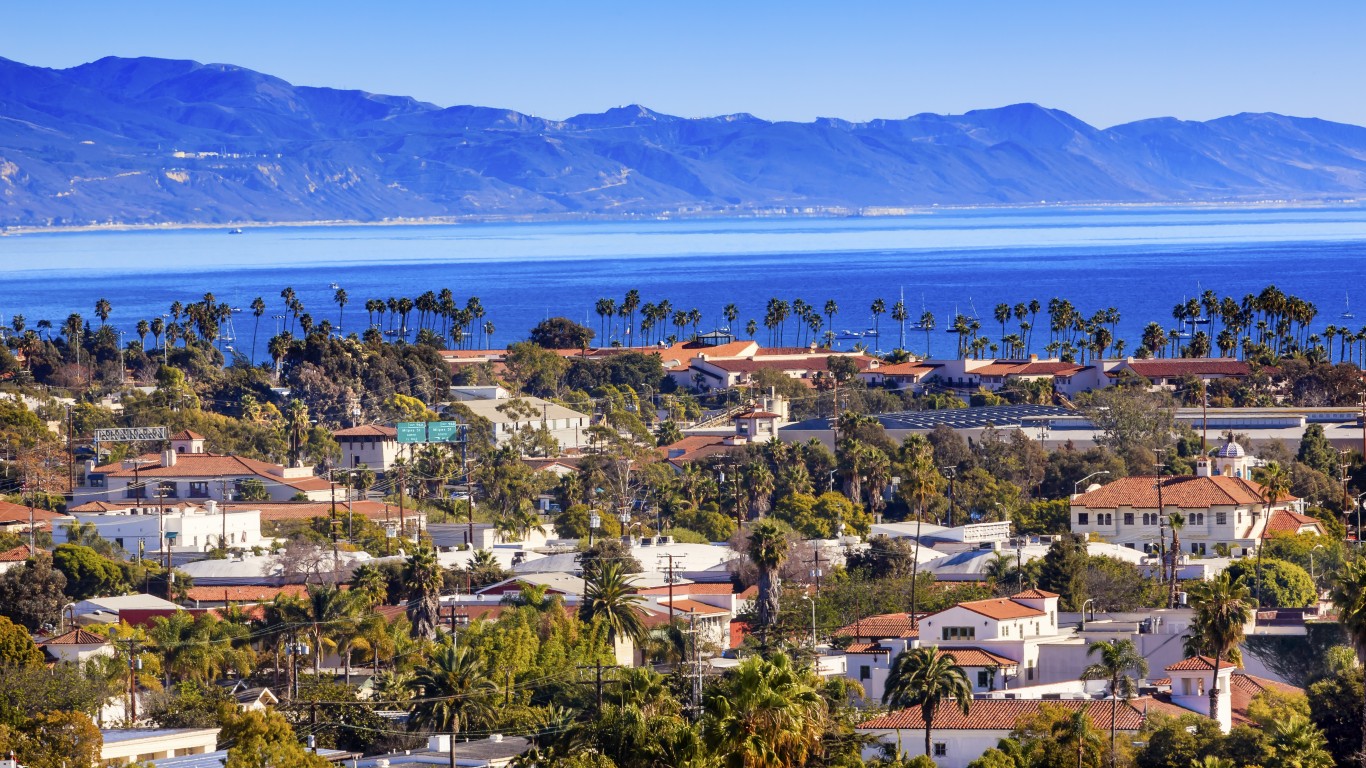
23. Santa Maria-Santa Barbara, California
> Population change due to net migration, 2020 to 2022: -1.8% (-7,862)
> Net domestic migration, 2020 to 2022: -9,515
> Net international migration, 2020 to 2022: +1,653
> Total population, 2022: 443,837
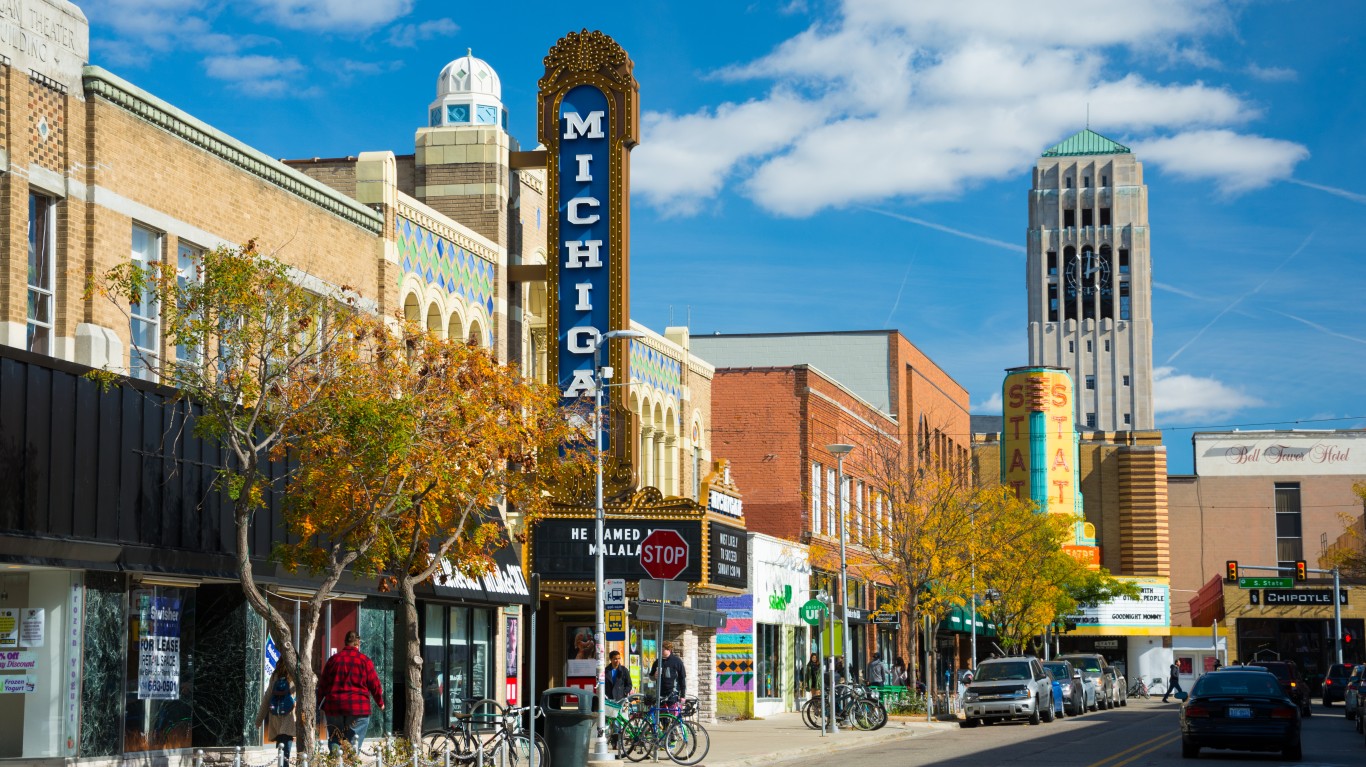
22. Ann Arbor, Michigan
> Population change due to net migration, 2020 to 2022: -1.8% (-6,540)
> Net domestic migration, 2020 to 2022: -8,810
> Net international migration, 2020 to 2022: +2,270
> Total population, 2022: 366,376
[in-text-ad-2]
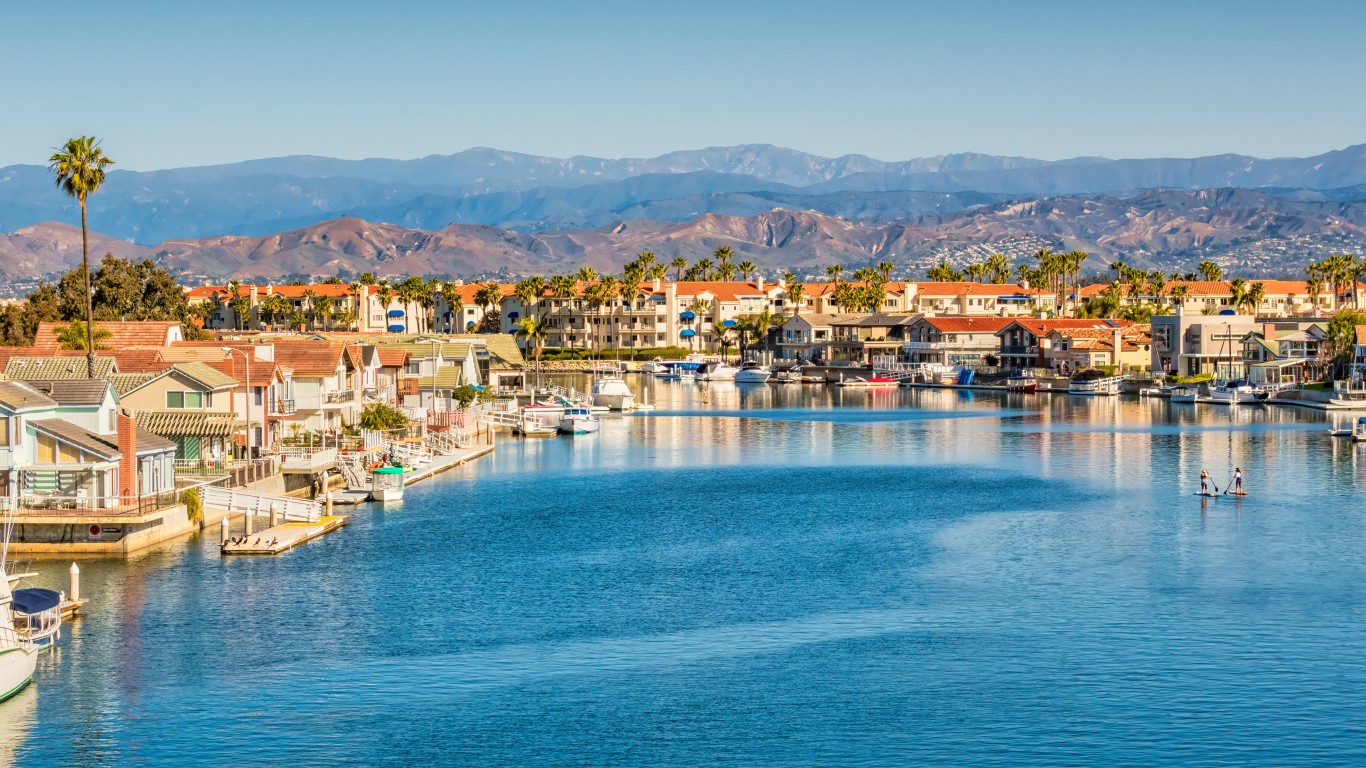
21. Oxnard-Thousand Oaks-Ventura, California
> Population change due to net migration, 2020 to 2022: -1.8% (-14,952)
> Net domestic migration, 2020 to 2022: -15,991
> Net international migration, 2020 to 2022: +1,039
> Total population, 2022: 832,605

20. Shreveport-Bossier City, Louisiana
> Population change due to net migration, 2020 to 2022: -1.9% (-7,380)
> Net domestic migration, 2020 to 2022: -7,831
> Net international migration, 2020 to 2022: +451
> Total population, 2022: 385,154
[in-text-ad]

19. Trenton-Princeton, New Jersey
> Population change due to net migration, 2020 to 2022: -2.0% (-7,588)
> Net domestic migration, 2020 to 2022: -10,526
> Net international migration, 2020 to 2022: +2,938
> Total population, 2022: 380,688

18. Decatur, Illinois
> Population change due to net migration, 2020 to 2022: -2.0% (-2,122)
> Net domestic migration, 2020 to 2022: -2,305
> Net international migration, 2020 to 2022: +183
> Total population, 2022: 101,483

17. Fairbanks-College, Alaska
> Population change due to net migration, 2020 to 2022: -2.0% (-1,956)
> Net domestic migration, 2020 to 2022: -2,108
> Net international migration, 2020 to 2022: +152
> Total population, 2022: 95,356
[in-text-ad-2]

16. Chicago-Naperville-Elgin, Illinois-Indiana
> Population change due to net migration, 2020 to 2022: -2.1% (-198,891)
> Net domestic migration, 2020 to 2022: -235,374
> Net international migration, 2020 to 2022: +36,483
> Total population, 2022: 9,274,140

15. Santa Cruz-Watsonville, California
> Population change due to net migration, 2020 to 2022: -2.5% (-6,717)
> Net domestic migration, 2020 to 2022: -7,152
> Net international migration, 2020 to 2022: +435
> Total population, 2022: 264,370
[in-text-ad]

14. Napa, California
> Population change due to net migration, 2020 to 2022: -2.5% (-3,466)
> Net domestic migration, 2020 to 2022: -3,653
> Net international migration, 2020 to 2022: +187
> Total population, 2022: 134,300

13. Elmira, New York
> Population change due to net migration, 2020 to 2022: -2.6% (-2,151)
> Net domestic migration, 2020 to 2022: -2,218
> Net international migration, 2020 to 2022: +67
> Total population, 2022: 81,426

12. Urban Honolulu, Hawaii
> Population change due to net migration, 2020 to 2022: -2.6% (-26,065)
> Net domestic migration, 2020 to 2022: -31,682
> Net international migration, 2020 to 2022: +5,617
> Total population, 2022: 995,638
[in-text-ad-2]
11. Salinas, California
> Population change due to net migration, 2020 to 2022: -2.7% (-11,900)
> Net domestic migration, 2020 to 2022: -12,905
> Net international migration, 2020 to 2022: +1,005
> Total population, 2022: 432,858

10. Los Angeles-Long Beach-Anaheim, California
> Population change due to net migration, 2020 to 2022: -2.8% (-367,333)
> Net domestic migration, 2020 to 2022: -428,371
> Net international migration, 2020 to 2022: +61,038
> Total population, 2022: 12,872,322
[in-text-ad]

9. Manhattan, Kansas
> Population change due to net migration, 2020 to 2022: -2.8% (-3,751)
> Net domestic migration, 2020 to 2022: -4,311
> Net international migration, 2020 to 2022: +560
> Total population, 2022: 133,072
8. Minot, North Dakota
> Population change due to net migration, 2020 to 2022: -2.8% (-2,179)
> Net domestic migration, 2020 to 2022: -2,284
> Net international migration, 2020 to 2022: +105
> Total population, 2022: 76,279

7. New York-Newark-Jersey City, New York-New Jersey
> Population change due to net migration, 2020 to 2022: -3.0% (-597,802)
> Net domestic migration, 2020 to 2022: -736,277
> Net international migration, 2020 to 2022: +138,475
> Total population, 2022: 19,557,311
[in-text-ad-2]
6. Houma-Bayou Cane-Thibodaux, Louisiana
> Population change due to net migration, 2020 to 2022: -3.4% (-7,137)
> Net domestic migration, 2020 to 2022: -7,338
> Net international migration, 2020 to 2022: +201
> Total population, 2022: 200,656

5. New Orleans-Metairie, Louisiana
> Population change due to net migration, 2020 to 2022: -3.5% (-35,348)
> Net domestic migration, 2020 to 2022: -39,853
> Net international migration, 2020 to 2022: +4,505
> Total population, 2022: 972,913
[in-text-ad]

4. San Jose-Sunnyvale-Santa Clara, California
> Population change due to net migration, 2020 to 2022: -3.9% (-77,891)
> Net domestic migration, 2020 to 2022: -103,156
> Net international migration, 2020 to 2022: +25,265
> Total population, 2022: 1,938,524
3. San Francisco-Oakland-Fremont, California
> Population change due to net migration, 2020 to 2022: -4.0% (-189,585)
> Net domestic migration, 2020 to 2022: -227,642
> Net international migration, 2020 to 2022: +38,057
> Total population, 2022: 4,579,599

2. Odessa, Texas
> Population change due to net migration, 2020 to 2022: -4.0% (-6,661)
> Net domestic migration, 2020 to 2022: -7,904
> Net international migration, 2020 to 2022: +1,243
> Total population, 2022: 160,869
[in-text-ad-2]

1. Lake Charles, Louisiana
> Population change due to net migration, 2020 to 2022: -5.8% (-14,804)
> Net domestic migration, 2020 to 2022: -15,323
> Net international migration, 2020 to 2022: +519
> Total population, 2022: 239,346
Travel Cards Are Getting Too Good To Ignore (sponsored)
Credit card companies are pulling out all the stops, with the issuers are offering insane travel rewards and perks.
We’re talking huge sign-up bonuses, points on every purchase, and benefits like lounge access, travel credits, and free hotel nights. For travelers, these rewards can add up to thousands of dollars in flights, upgrades, and luxury experiences every year.
It’s like getting paid to travel — and it’s available to qualified borrowers who know where to look.
We’ve rounded up some of the best travel credit cards on the market. Click here to see the list. Don’t miss these offers — they won’t be this good forever.
Thank you for reading! Have some feedback for us?
Contact the 24/7 Wall St. editorial team.

 24/7 Wall St.


