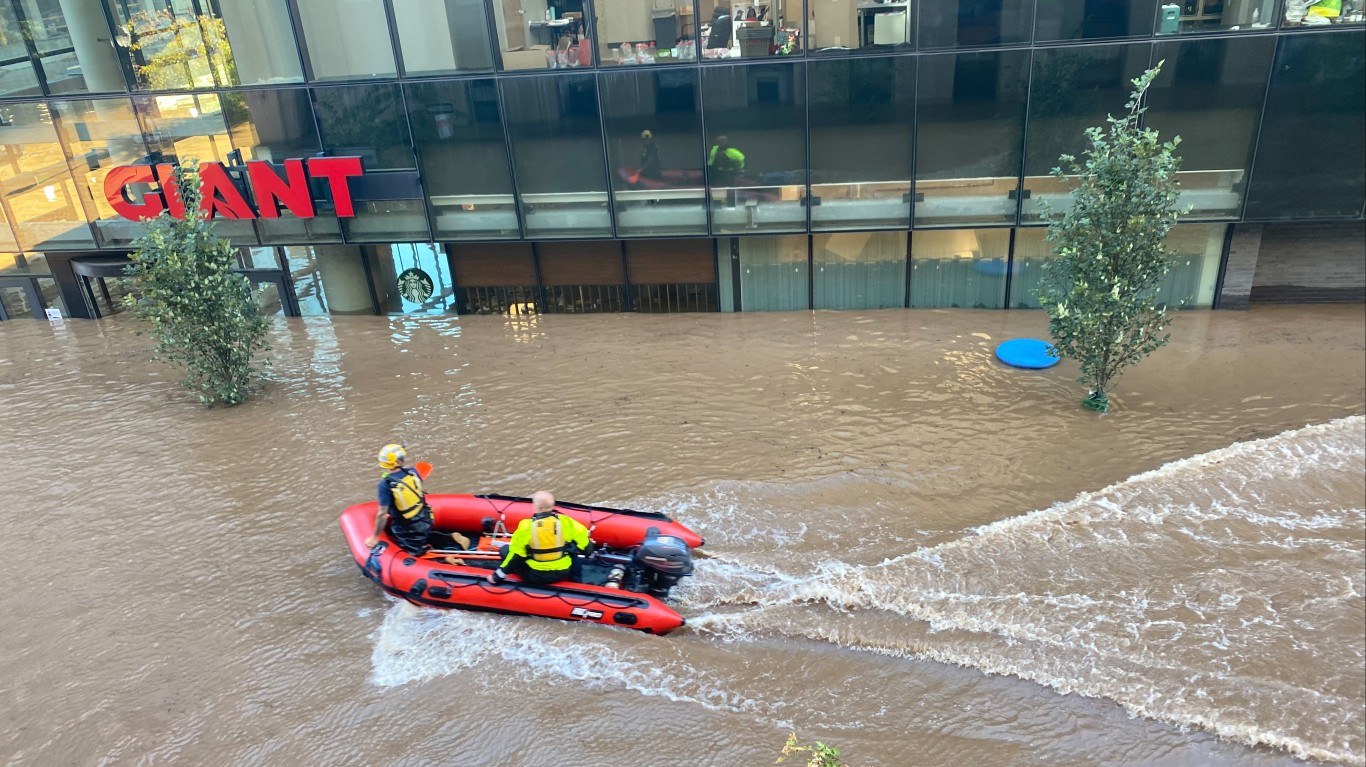
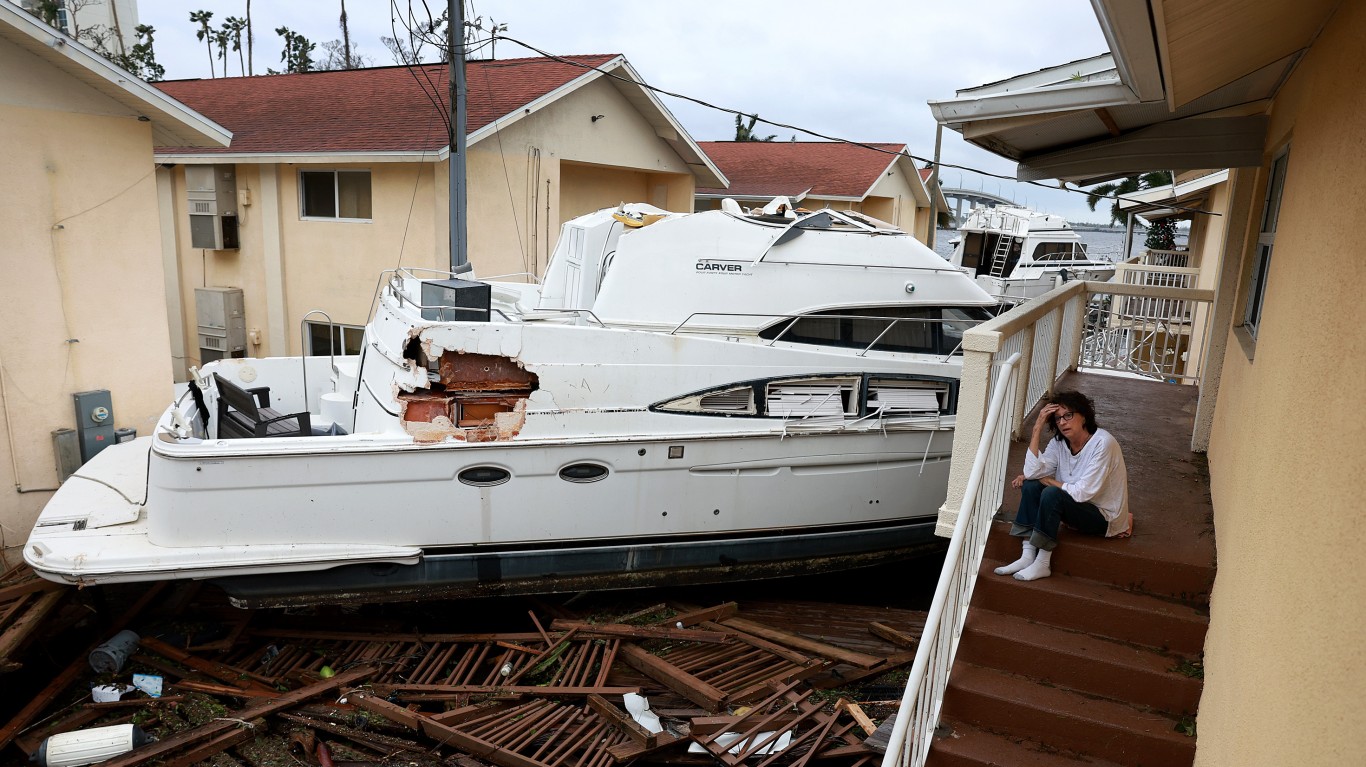
According to the National Oceanic and Atmospheric Association, the nation suffered 23 separate weather- or climate-based natural disasters in the first eight months of 2023. The number of weather disasters exceeds that of any other similar period on record. And with another two months to the hurricane season, the tally could easily worsen by the end of the year.
The disasters tracked by NOAA so far this year include 19 hailstorms, violent thunderstorms, and other severe weather events; two examples of catastrophic flooding; one Category 3 hurricane (Idalia) making landfall in Florida; and the tragic firestorms, exacerbated by winds from Hurricane Dora, that devastated Lahaina, on the Hawaiian island of Maui.
In all, says the agency, these events were responsible, directly or indirectly, for 253 fatalities and more than $57.6 billion in damages. (Here’s a sobering list of the worst natural disaster in every state.)
In addition, the U.S. Geological Survey has recorded 22 “significant” earthquakes around America so far this year, based on a combination of magnitude, number of “Did You Feel It” responses, and PAGER alert level (which provides fatality and economic loss impact estimates following quakes). The most powerful of these, south of Sand Point, Alaska, measured 7.2 on the moment scale. And it’s not just the particularly tremor-prone states of Alaska and California that feel the earth shake. New York, Arizona, and Washington all had quakes with a 3.8 magnitude, and Ohio logged one at 3.6. (These are the most earthquake-prone states in America.)
While earthquakes are more difficult to predict than most severe weather events, they can strike any state (North Dakota and Florida have the fewest). When it comes to massive storms and their destructive results, though, some corners of the country – so-called “climate havens” – are safer than others.
To compile a list of the 25 U.S. cities safest from natural disasters, 24/7 Tempo reviewed a study conducted by the gutter services company Gutter Gnome. Drawing on data from some 15 sources, including the American Red Cross, the Federal Emergency Management Agency, the Health Resources & Services Administration, the World Port Source, and the Yale Program on Climate Change Communication, the site developed an index scoring the 500 largest cities in the country according to metrics in five key categories: hazards risk, vulnerable population (including the number of those over 65 living alone), vulnerable infrastructure, response and recovery (including the number of hospitals per square mile and the population of EMT responders per 100,000 residents), and mobility (considering evacuation management, among other factors).
Click here for a list of the 25 U.S. cities best prepared to handle a natural disaster.
Based on the index, cities were given scores out of a possible 100 points, with Richmond, Virginia, leading the group as the safest place with a score of 53.81, and two other Virginia cities came in second and third. Population figures are U.S. Census Bureau estimates for 2022.
25. San Antonio, Texas
> Hazards risk rank: 89/500
> Vulnerable infrastructure rank: 320/500
> Response and recovery rank: 23/500
> Overall score: 47.82
> Population: 1,472,909
[in-text-ad]
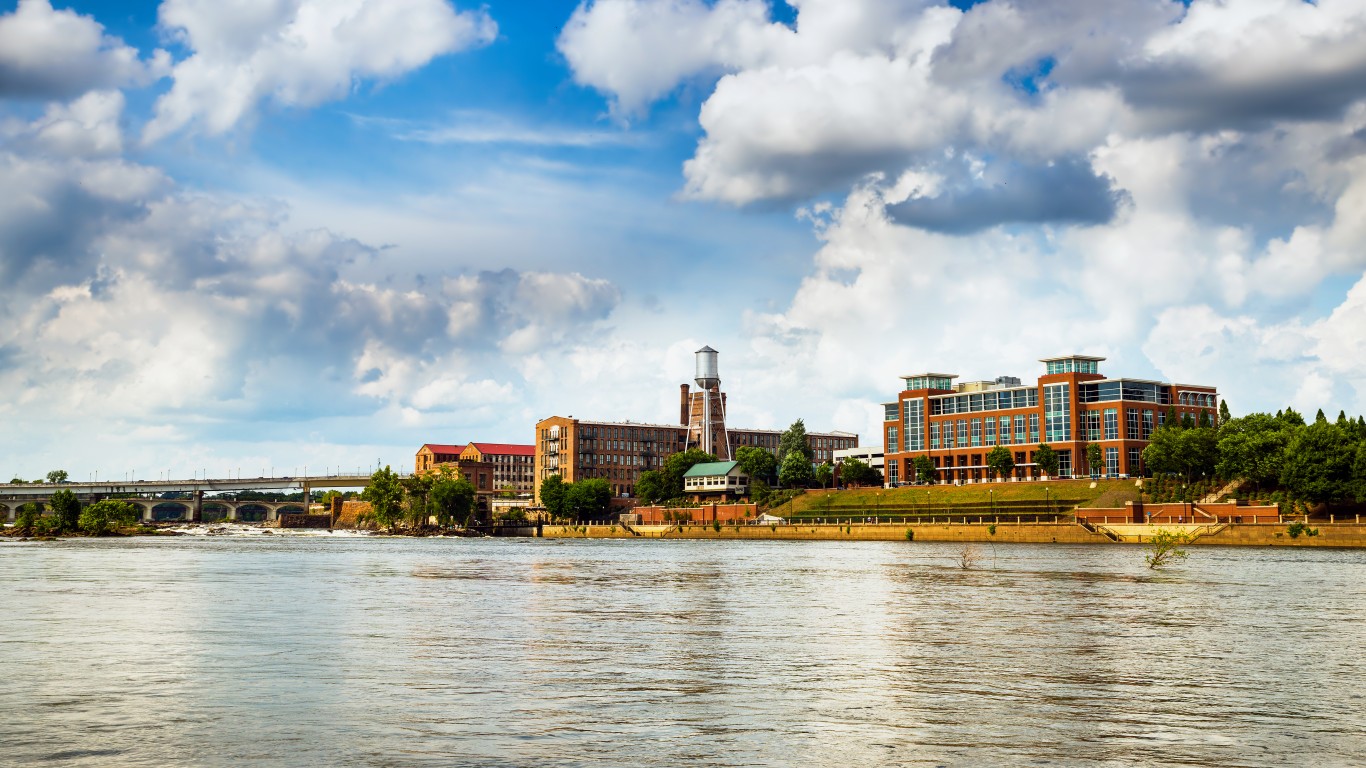
24. Columbus, Georgia
> Hazards risk rank: 12/500
> Vulnerable infrastructure rank: 114/500
> Response and recovery rank: 168/500
> Overall score: 47.86
> Population: 202,616
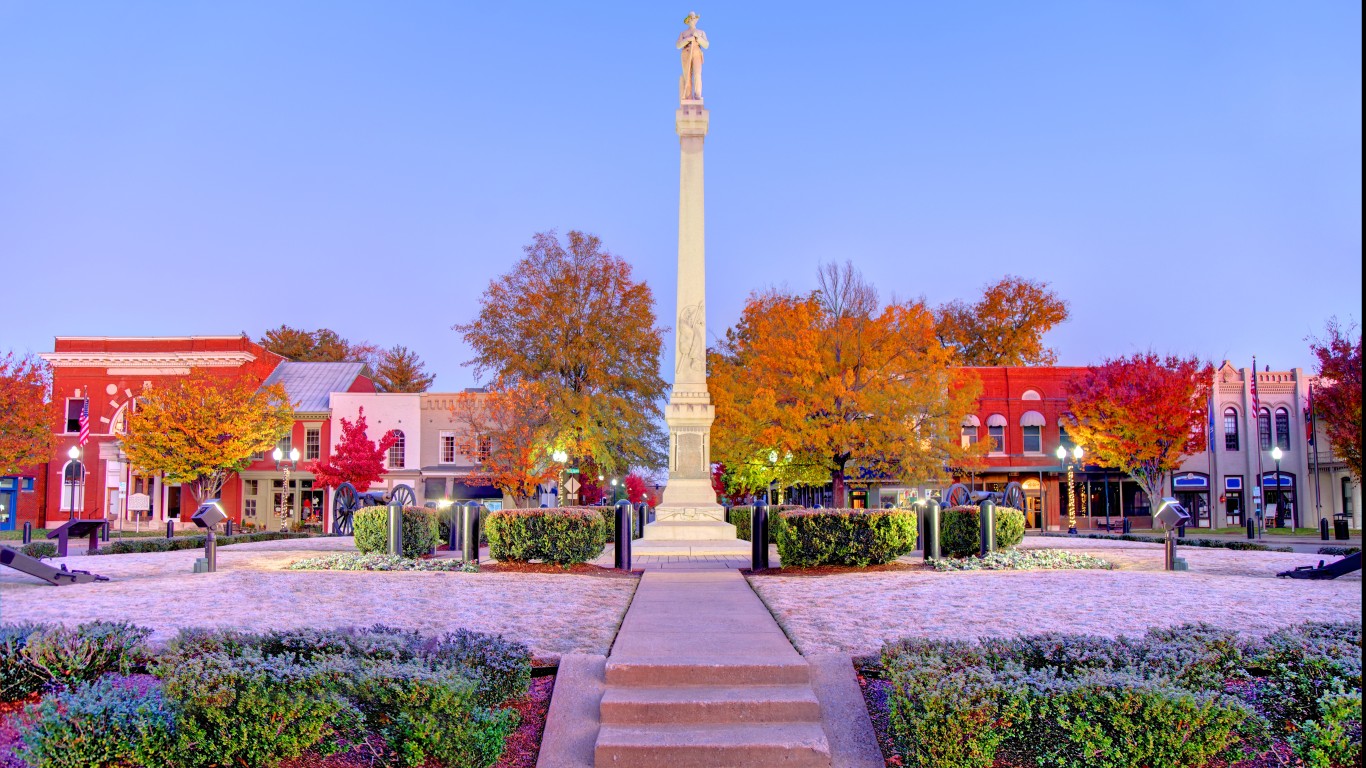
23. Franklin, Tennessee
> Hazards risk rank: 28/500
> Vulnerable infrastructure rank: 5/500
> Response and recovery rank: 375/500
> Overall score: 47.95
> Population: 86,895
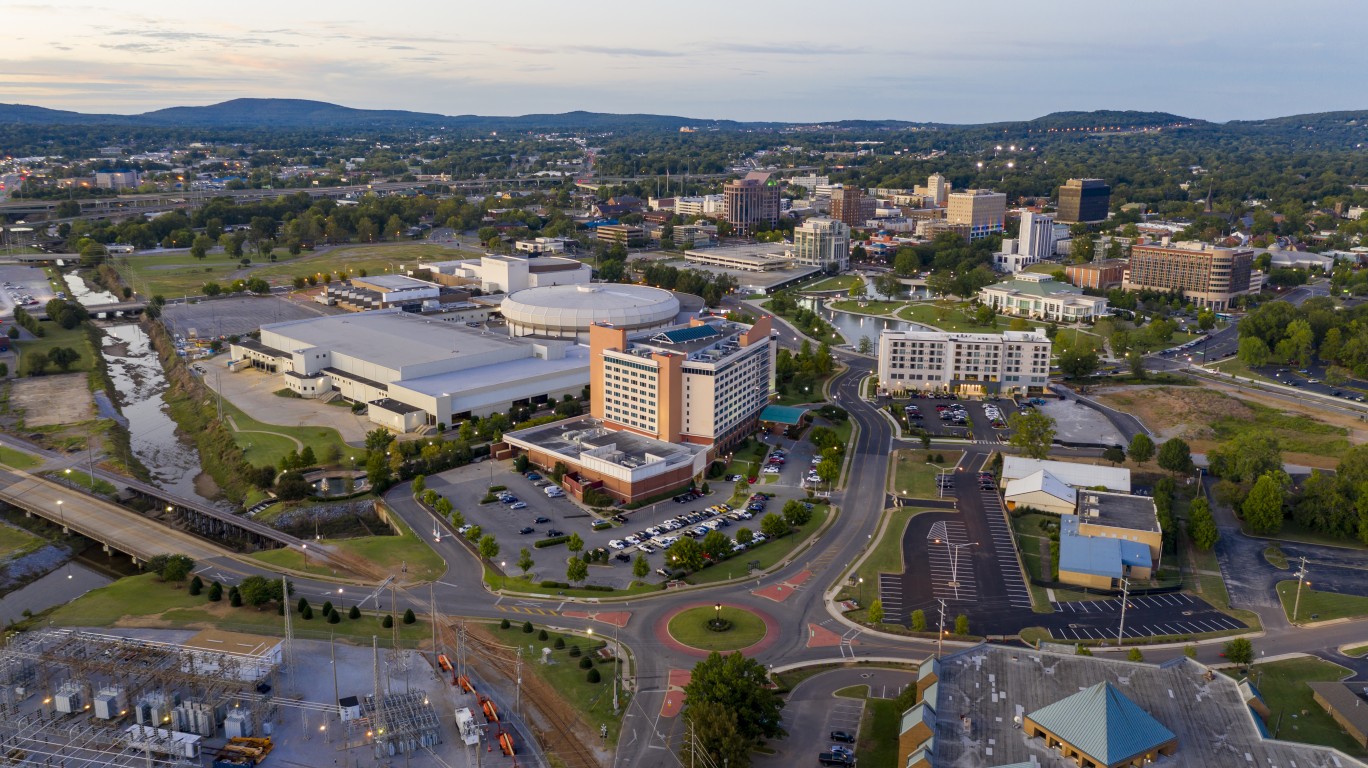
22. Huntsville, Alabama
> Hazards risk rank: 49/500
> Vulnerable infrastructure rank: 82/500
> Response and recovery rank: 139/500
> Overall score: 48.03
> Population: 221,933
[in-text-ad-2]
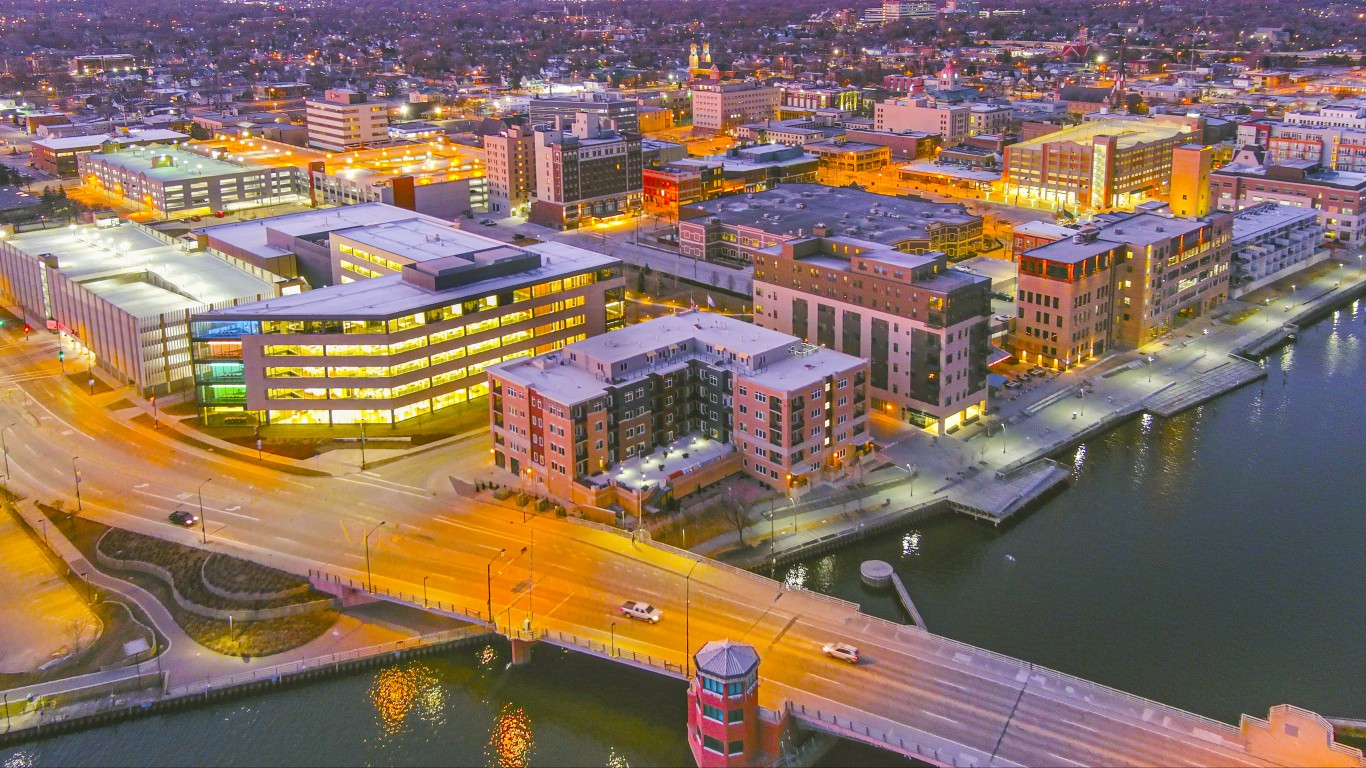
21. Green Bay, Wisconsin
> Hazards risk rank: 34/500
> Vulnerable infrastructure rank: 174/500
> Response and recovery rank: 51/500
> Overall score: 48.15
> Population: 106,095
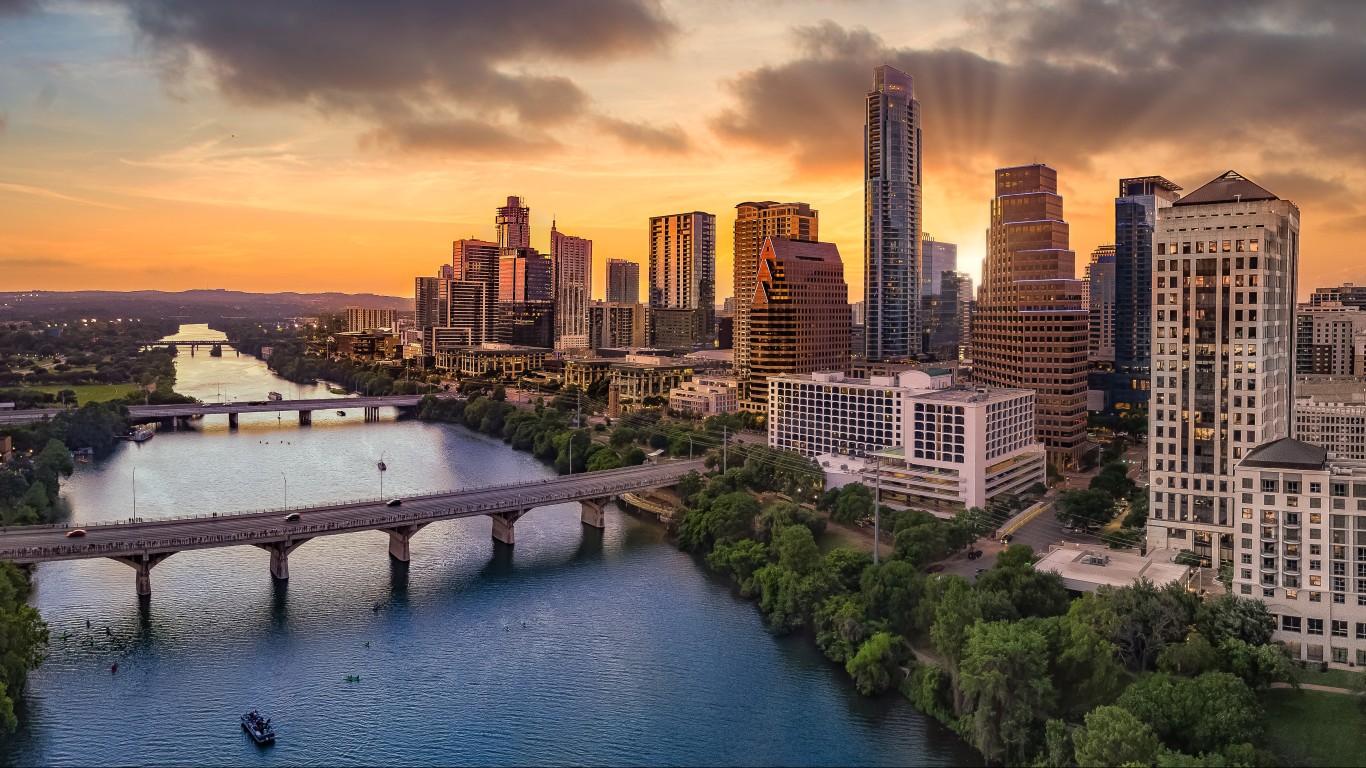
20. Austin, Texas
> Hazards risk rank: 163/500
> Vulnerable infrastructure rank: 162/500
> Response and recovery rank: 50/500
> Overall score: 48.2
> Population: 974,447
[in-text-ad]

19. Bend, Oregon
> Hazards risk rank: 38/500
> Vulnerable infrastructure rank: 149/500
> Response and recovery rank: 147/500
> Overall score: 48.42
> Population: 103,254
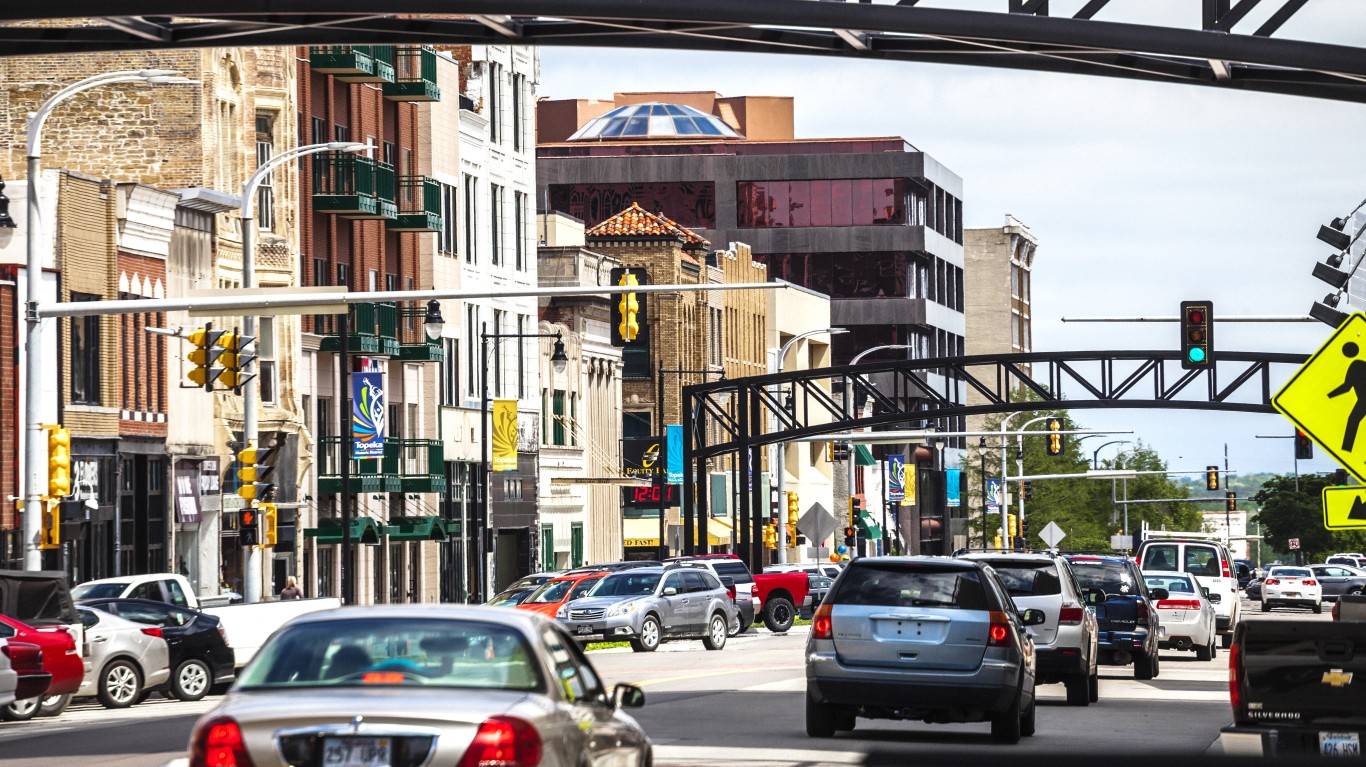
18. Topeka, Kansas
> Hazards risk rank: 45/500
> Vulnerable infrastructure rank: 233/500
> Response and recovery rank: 17/500
> Overall score: 48.54
> Population: 125,449
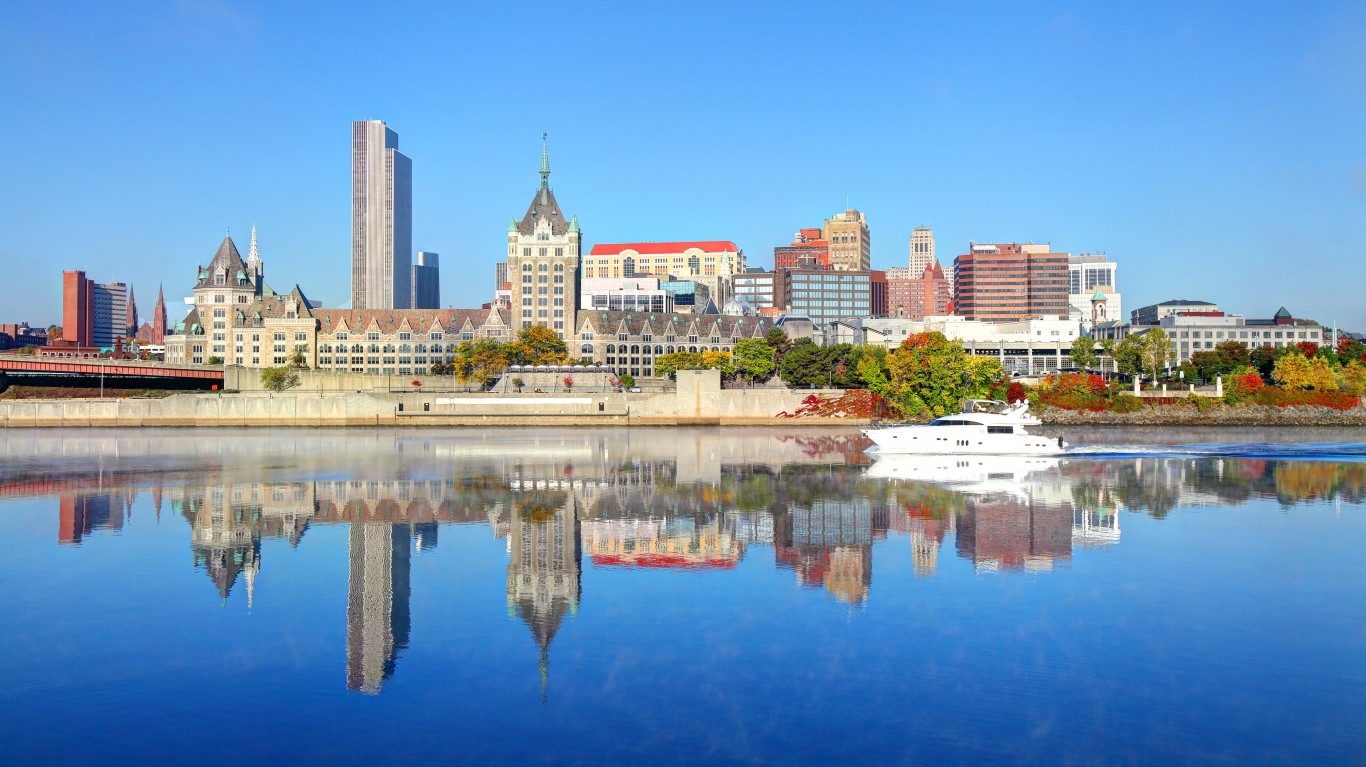
17. Albany, New York
> Hazards risk rank: 33/500
> Vulnerable infrastructure rank: 447/500
> Response and recovery rank: 6/500
> Overall score: 48.59
> Population: 100,826
[in-text-ad-2]
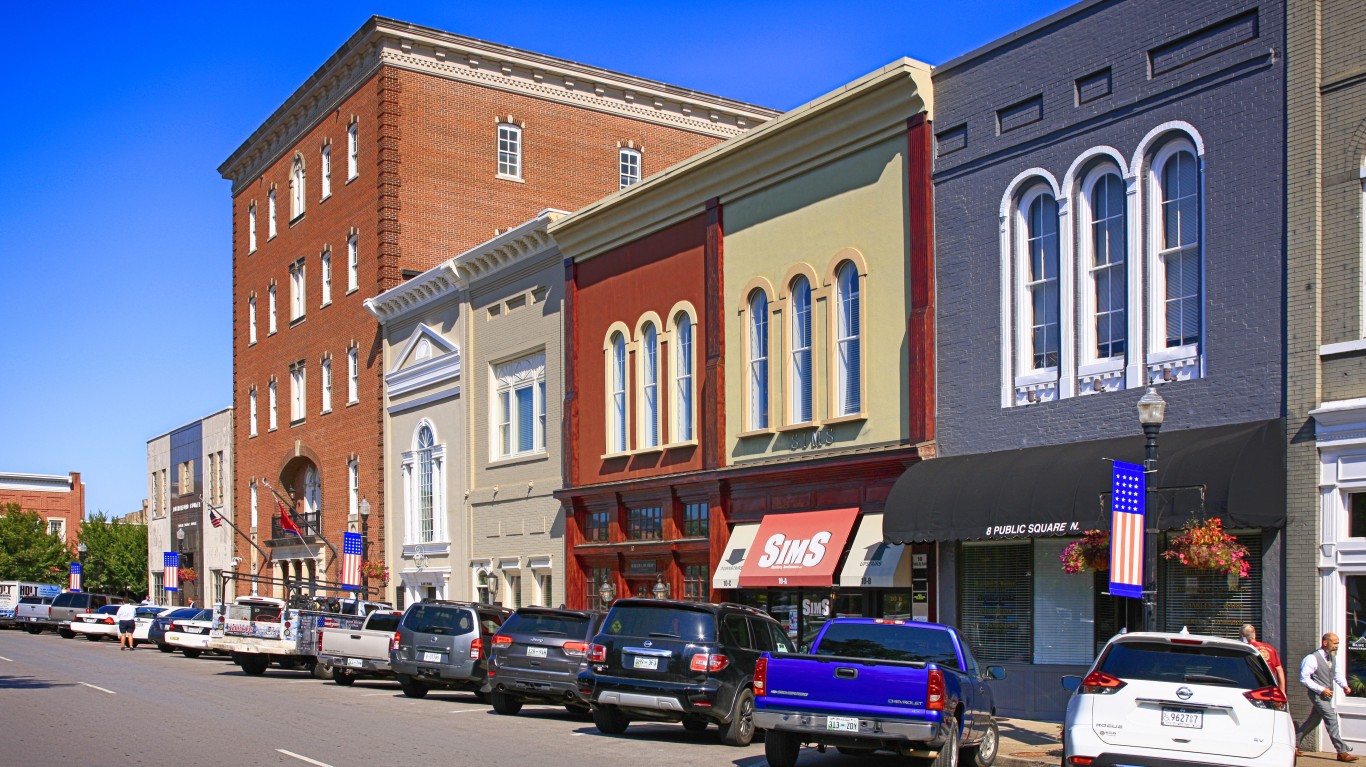
16. Murfreesboro, Tennessee
> Hazards risk rank: 124/500
> Vulnerable infrastructure rank: 13/500
> Response and recovery rank: 164/500
> Overall score: 48.62
> Population: 162,398
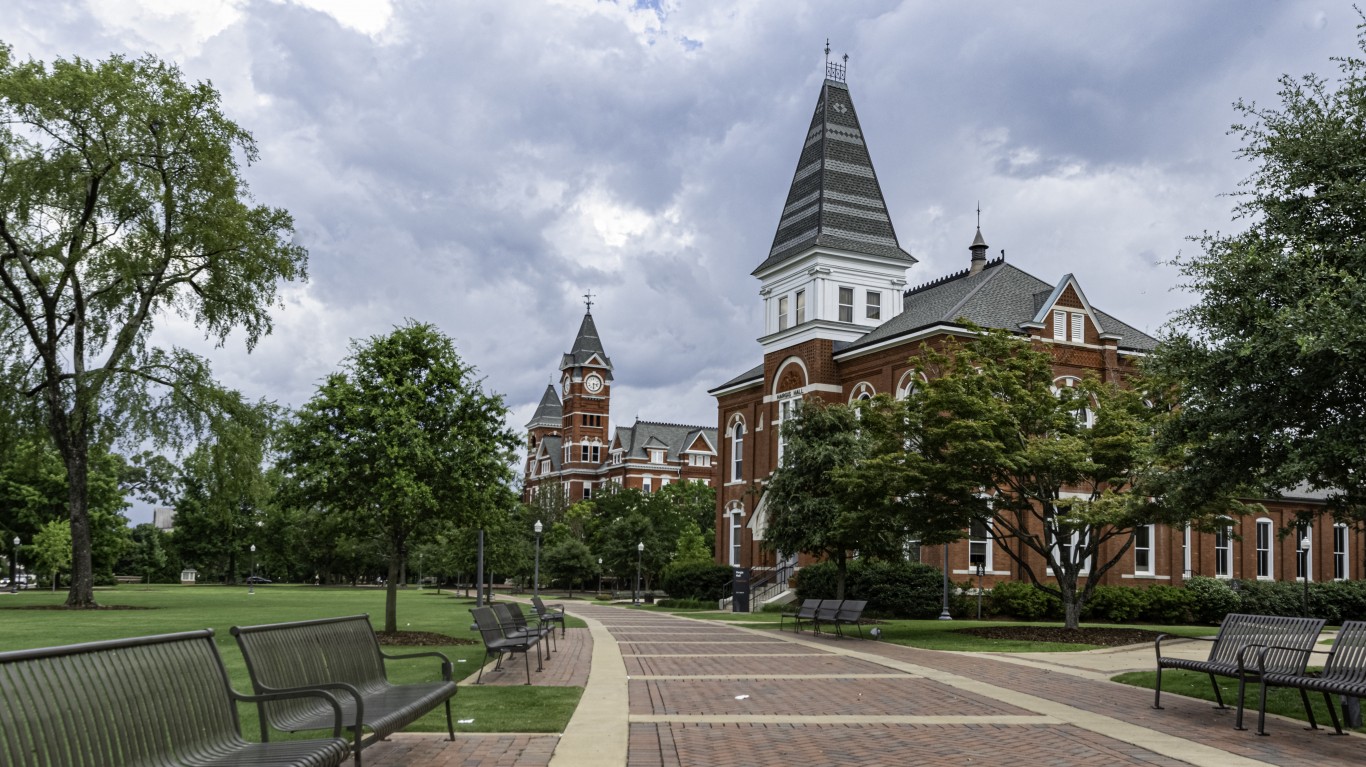
15. Auburn, Alabama
> Hazards risk rank: 15/500
> Vulnerable infrastructure rank: 19/500
> Response and recovery rank: 490/500
> Overall score: 48.73
> Population: 80,006
[in-text-ad]
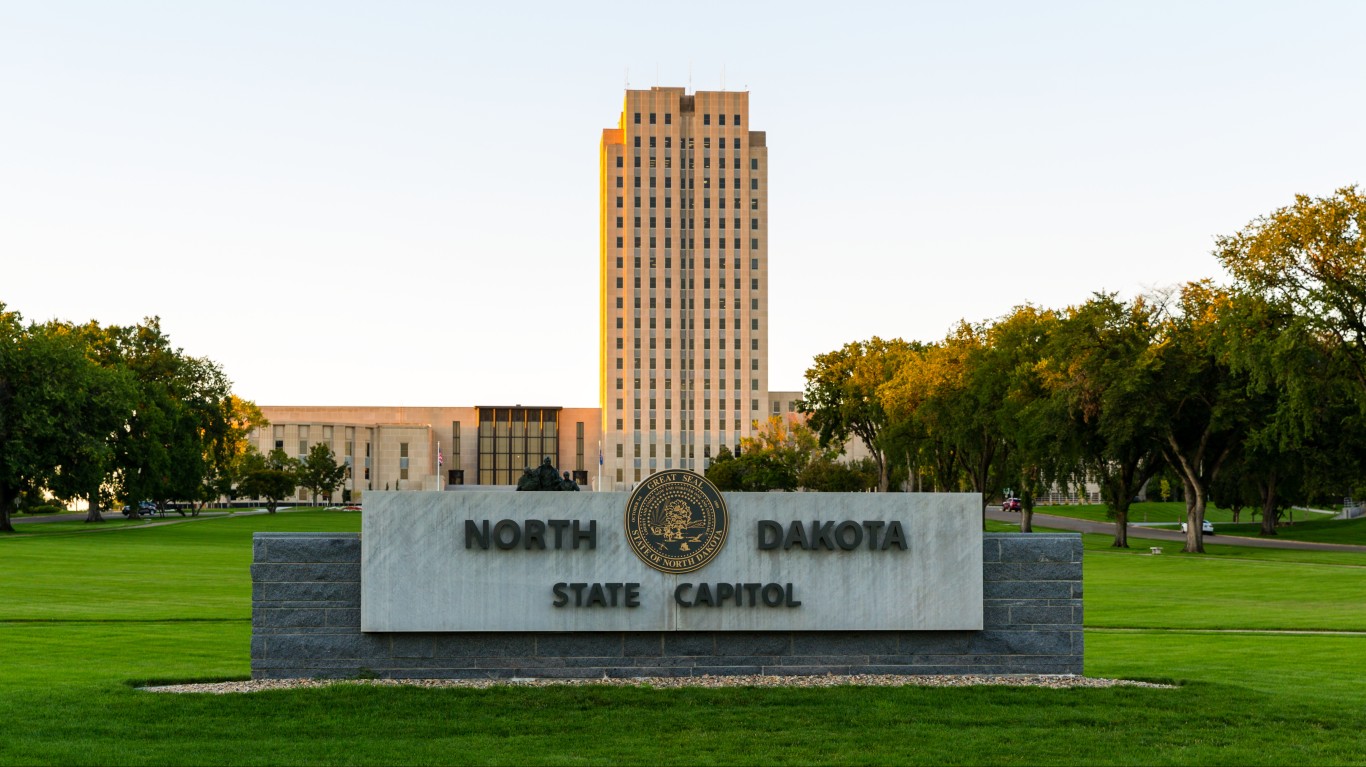
14. Bismarck, North Dakota
> Hazards risk rank: 32/500
> Vulnerable infrastructure rank: 158/500
> Response and recovery rank: 59/500
> Overall score: 49
> Population: 74,445
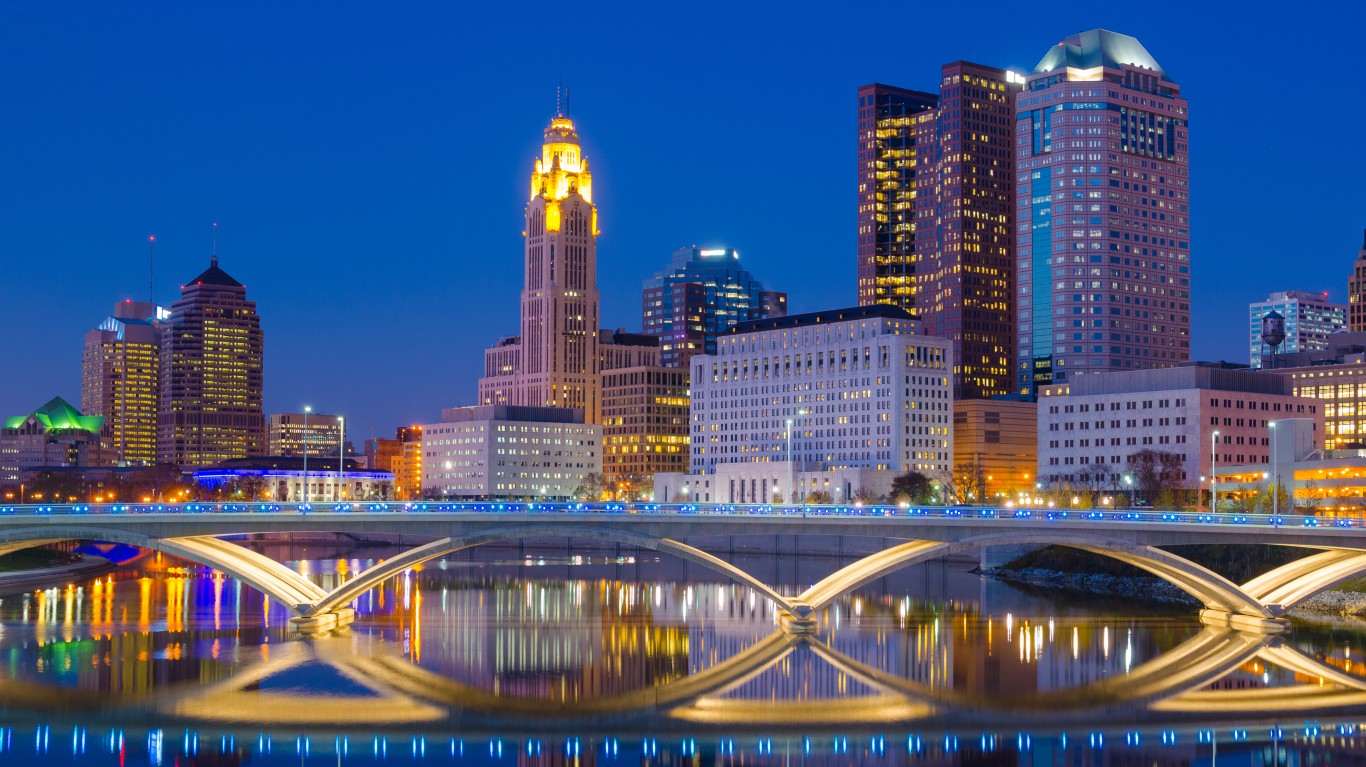
13. Columbus, Ohio
> Hazards risk rank: 24/500
> Vulnerable infrastructure rank: 346/500
> Response and recovery rank: 35/500
> Overall score: 49.25
> Population: 907,971
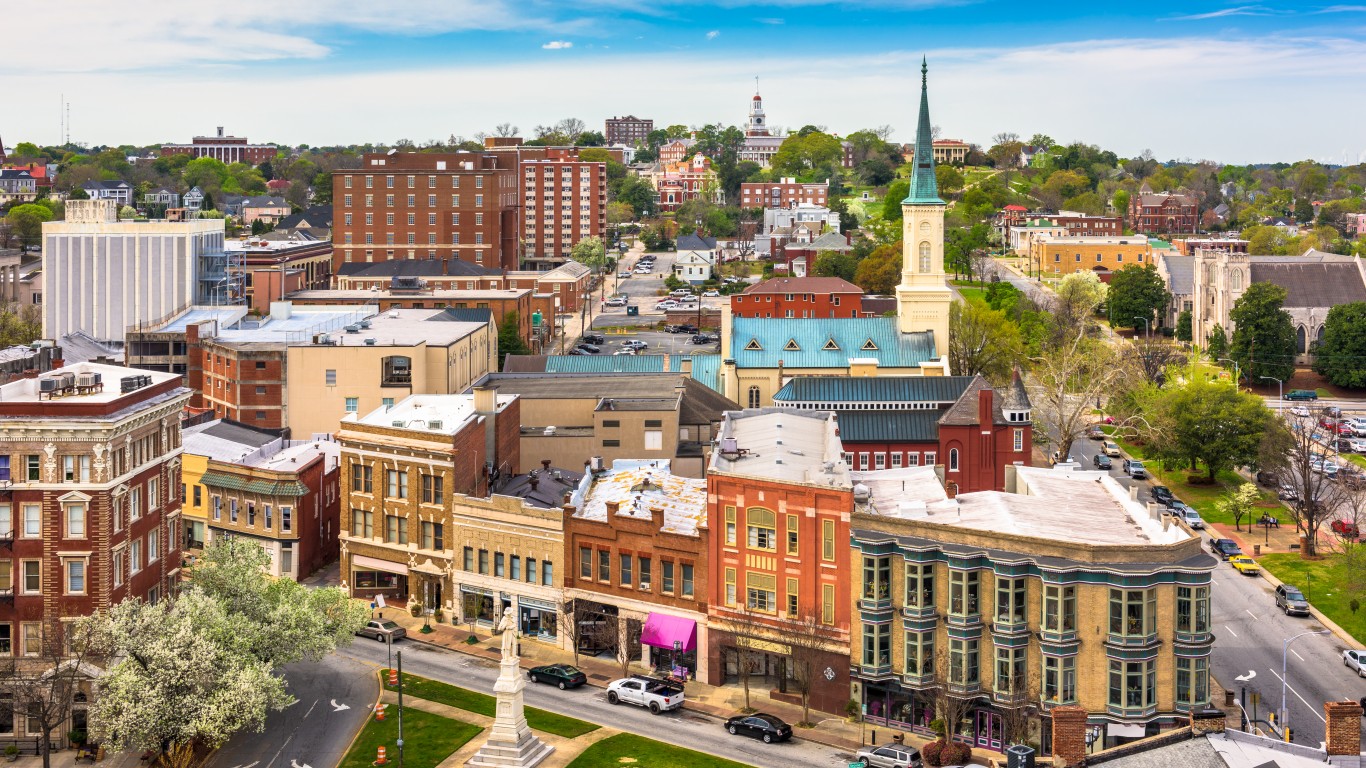
12. Macon, Georgia
> Hazards risk rank: 2/500
> Vulnerable infrastructure rank: 136/500
> Response and recovery rank: 334/500
> Overall score: 49.28
> Population: 156,197
[in-text-ad-2]
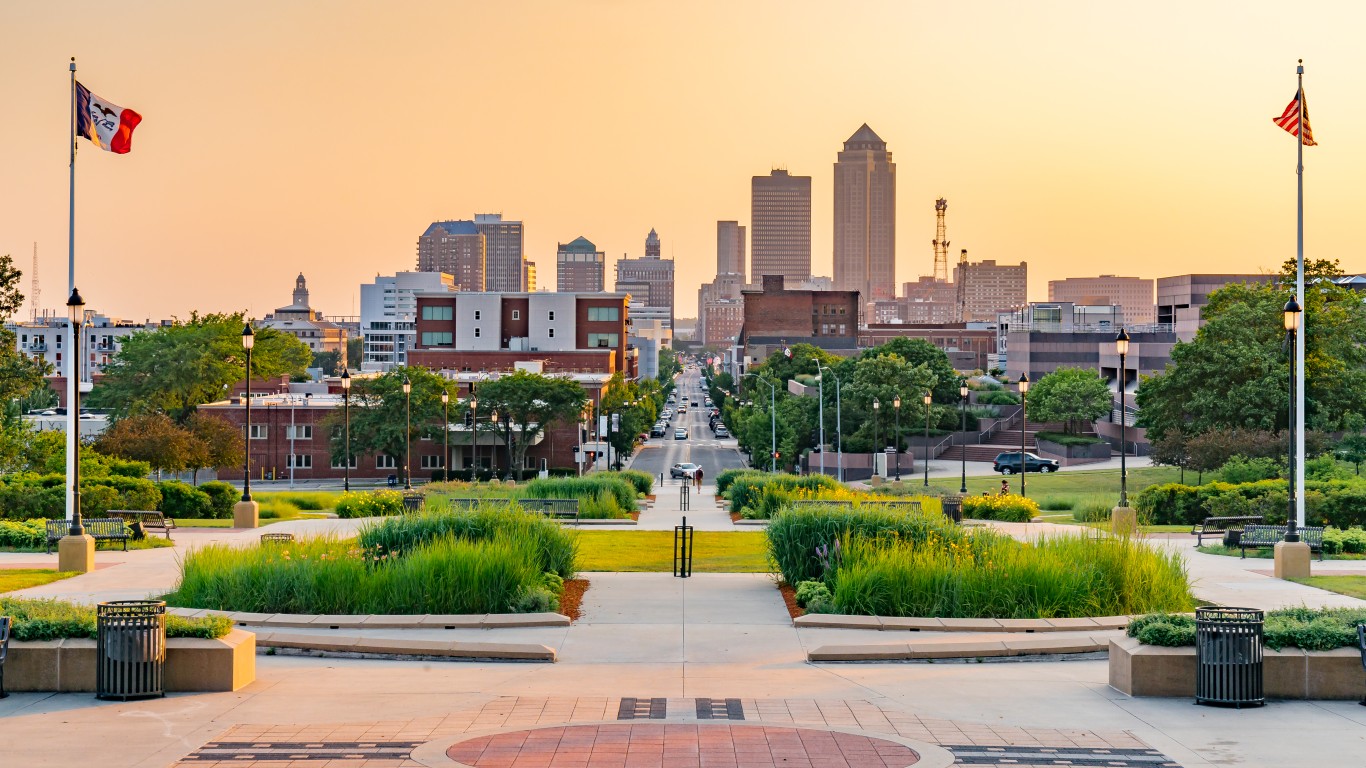
11. Des Moines, Iowa
> Hazards risk rank: 16/500
> Vulnerable infrastructure rank: 253/500
> Response and recovery rank: 48/500
> Overall score: 49.4
> Population: 211,034
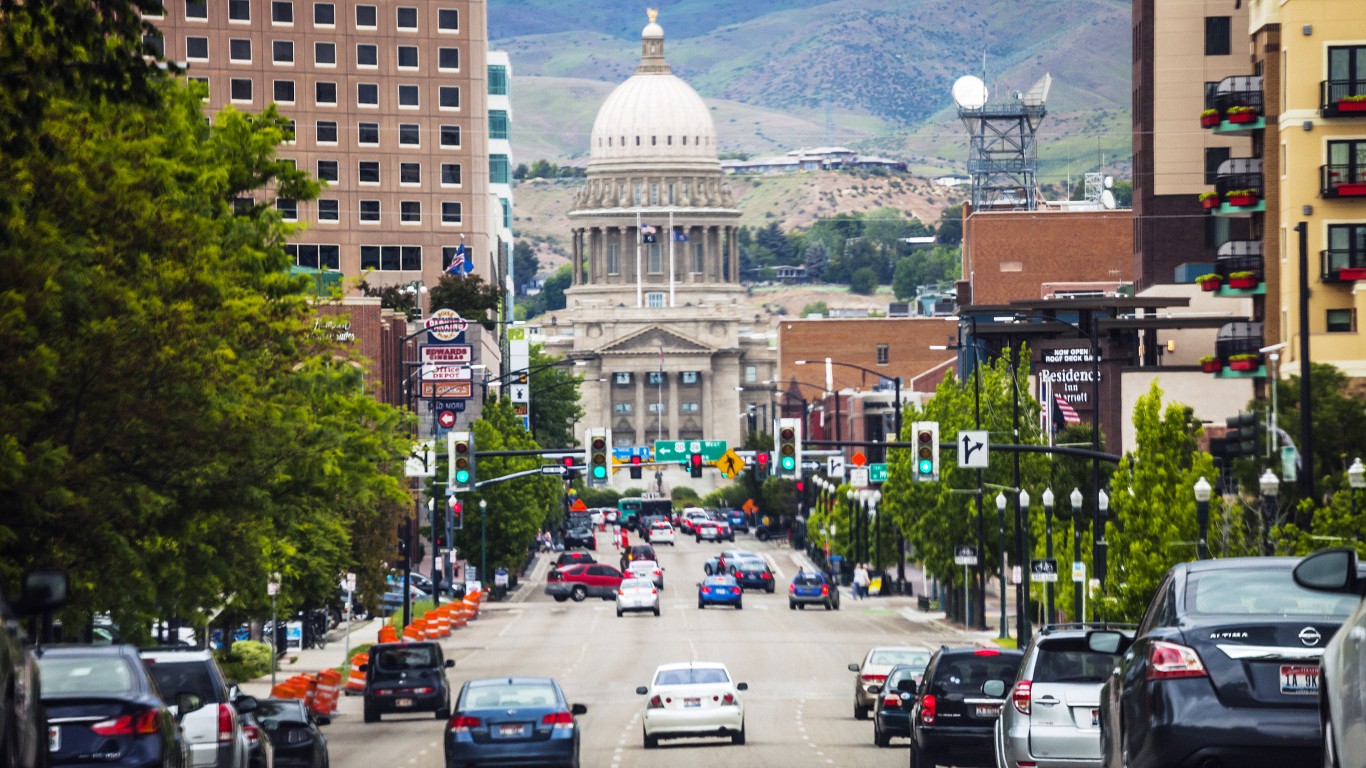
10. Boise City, Idaho
> Hazards risk rank: 121/500
> Vulnerable infrastructure rank: 90/500
> Response and recovery rank: 24/500
> Overall score: 49.7
> Population: 236,634
[in-text-ad]
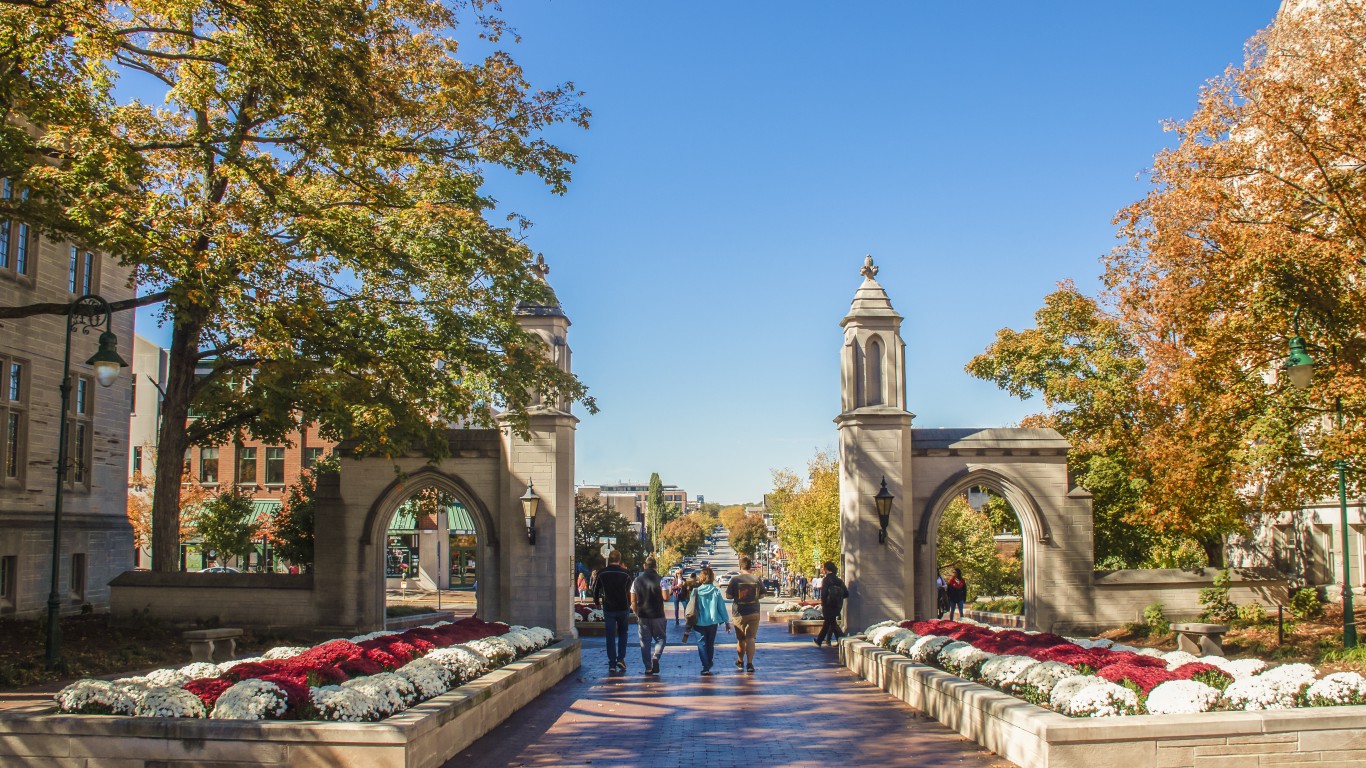
9. Bloomington, Indiana
> Hazards risk rank: 14/500
> Vulnerable infrastructure rank: 343/500
> Response and recovery rank: 82/500
> Overall score: 49.85
> Population: 79,107

8. Tyler, Texas
> Hazards risk rank: 7/500
> Vulnerable infrastructure rank: 366/500
> Response and recovery rank: 56/500
> Overall score: 50.06
> Population: 109,286
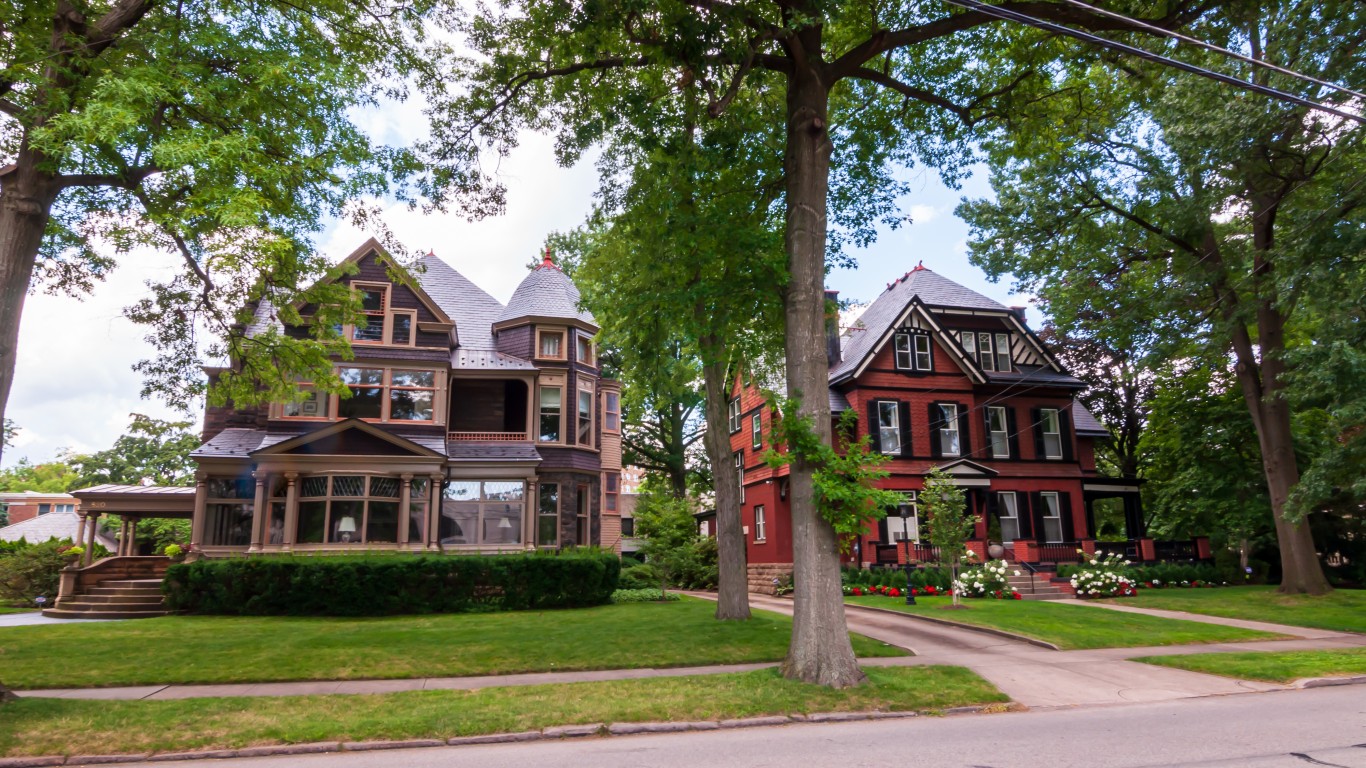
7. Pittsburgh, Pennsylvania
> Hazards risk rank: 70/500
> Vulnerable infrastructure rank: 462/500
> Response and recovery rank: 2/500
> Overall score: 50.47
> Population: 302,898
[in-text-ad-2]
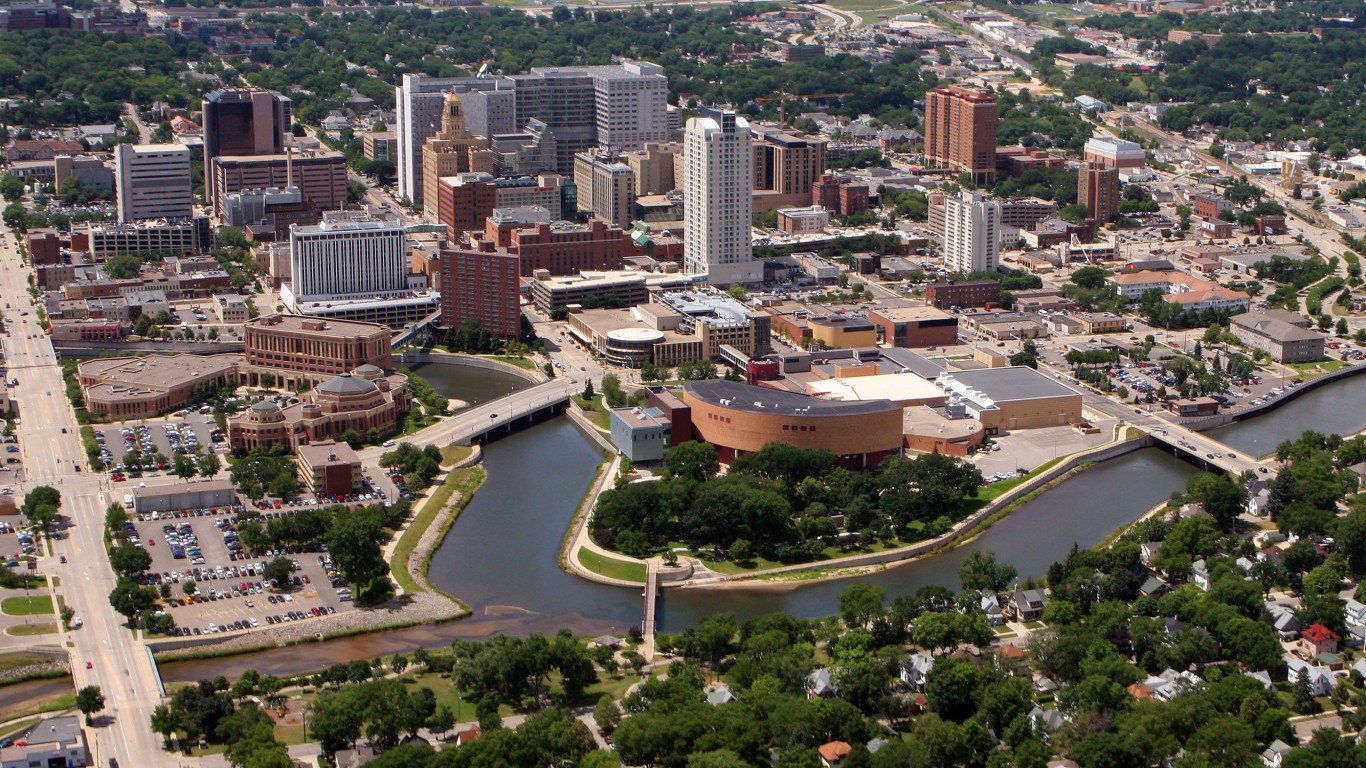
6. Rochester, Minnesota
> Hazards risk rank: 41/500
> Vulnerable infrastructure rank: 53/500
> Response and recovery rank: 58/500
> Overall score: 50.54
> Population: 121,878
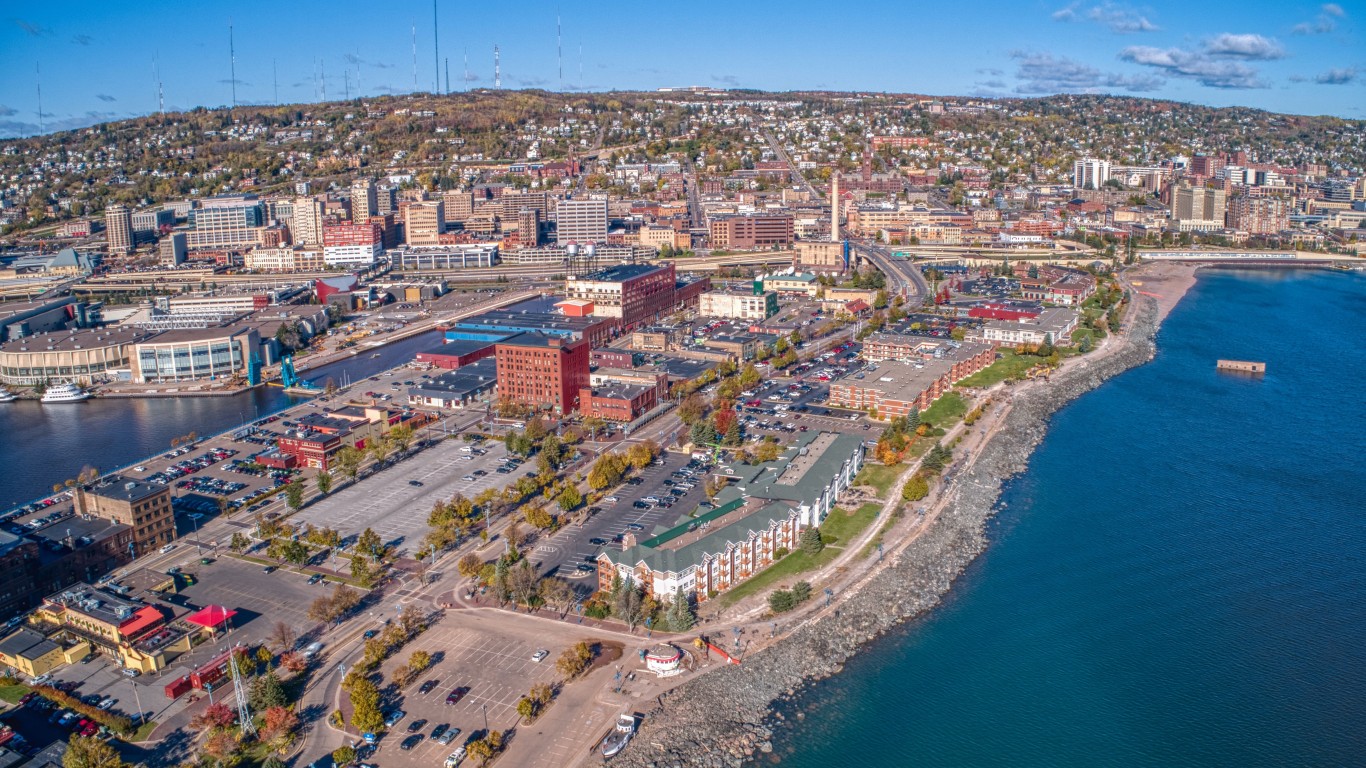
5. Duluth, Minnesota
> Hazards risk rank: 9/500
> Vulnerable infrastructure rank: 319/500
> Response and recovery rank: 72/500
> Overall score: 50.93
> Population: 86,619
[in-text-ad]
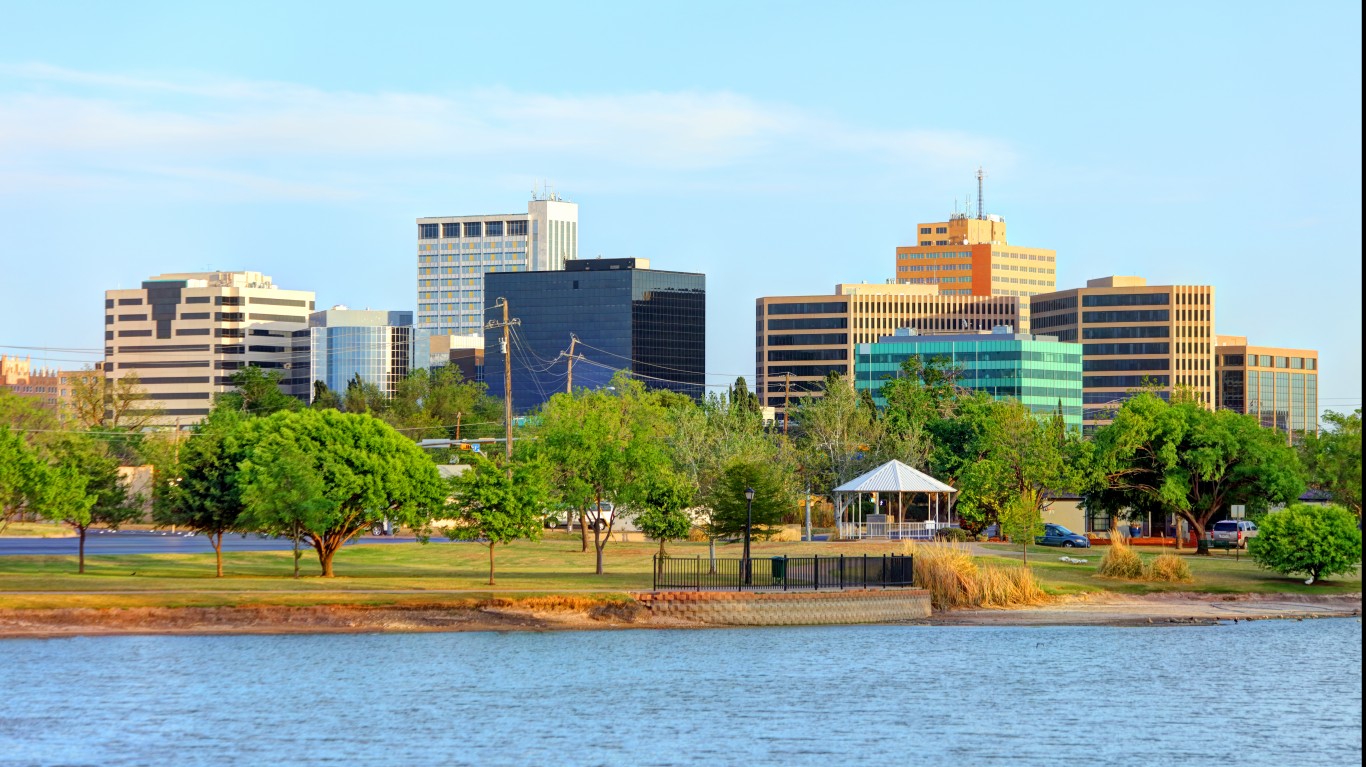
4. Midland, Texas
> Hazards risk rank: 5/500
> Vulnerable infrastructure rank: 300/500
> Response and recovery rank: 160/500
> Overall score: 51.4
> Population: 134,444
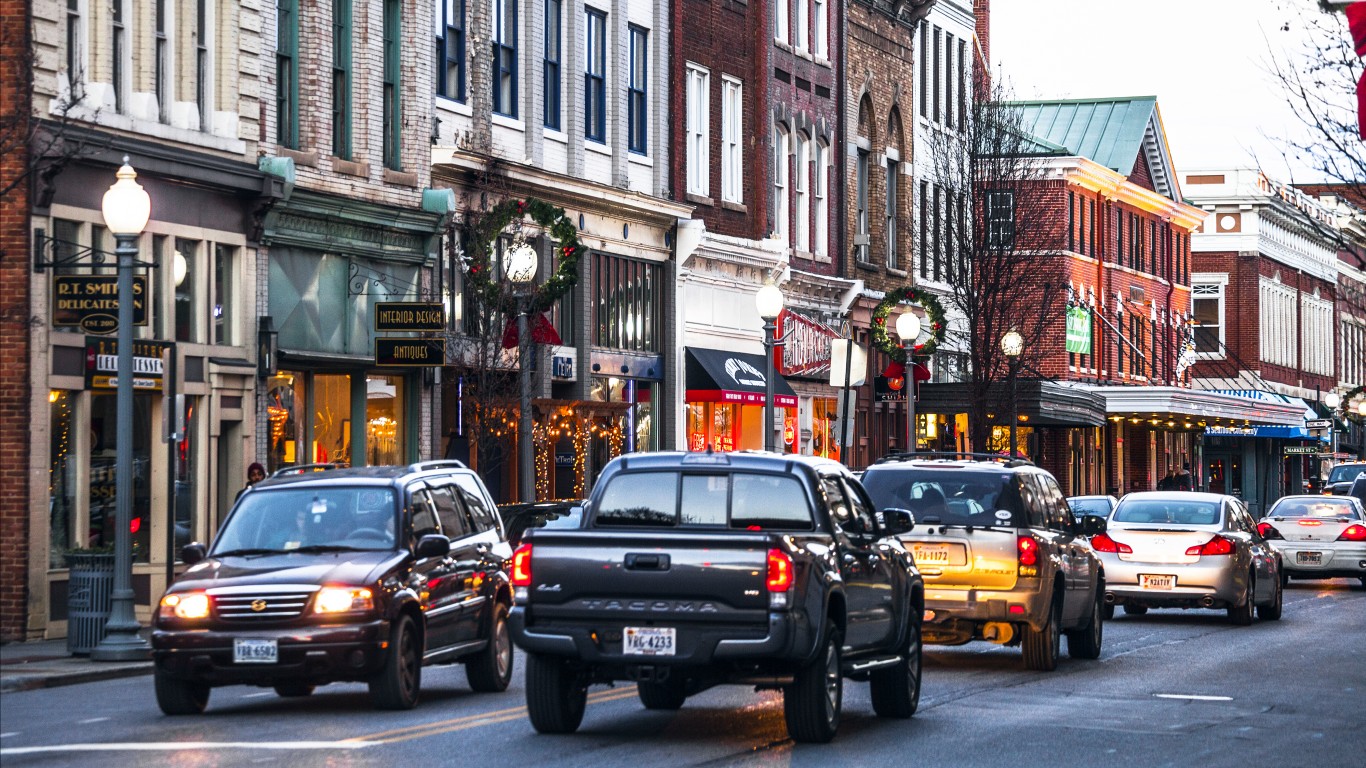
3. Roanoke, Virginia
> Hazards risk rank: 3/500
> Vulnerable infrastructure rank: 265/500
> Response and recovery rank: 92/500
> Overall score: 52.74
> Population: 97,847
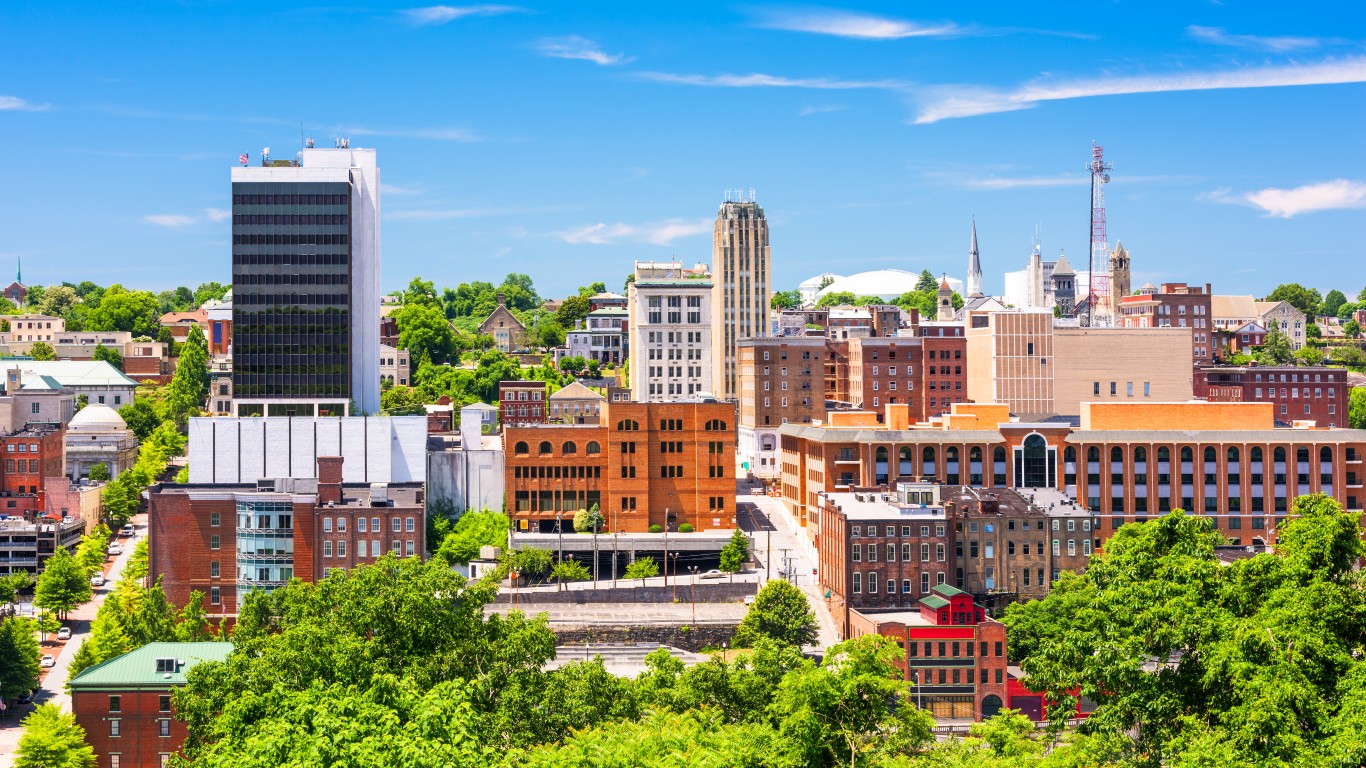
2. Lynchburg, Virginia
> Hazards risk rank: 1/500
> Vulnerable infrastructure rank: 424/500
> Response and recovery rank: 131/500
> Overall score: 53.64
> Population: 79,287
[in-text-ad-2]
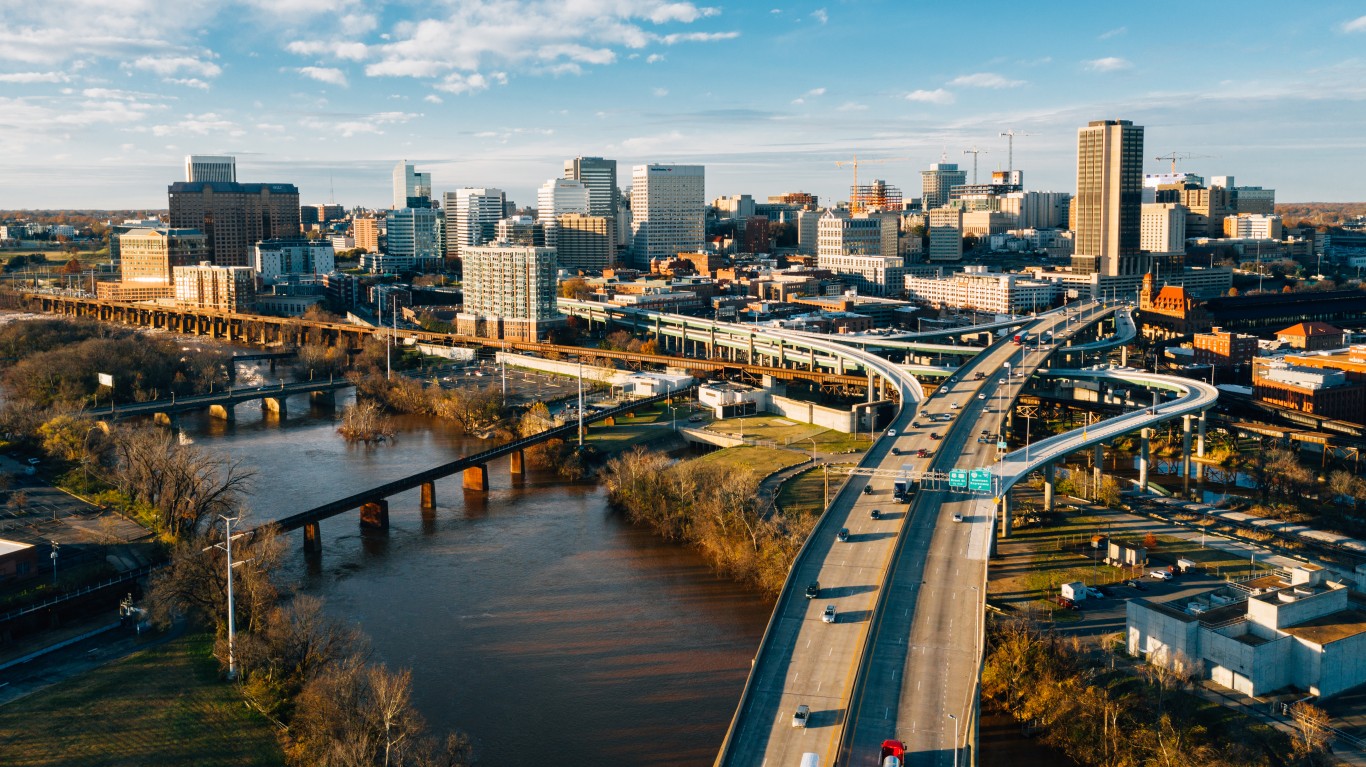
1. Richmond, Virginia
> Hazards risk rank: 23/500
> Vulnerable infrastructure rank: 206/500
> Response and recovery rank: 8/500
> Overall score: 53.81
> Population: 229,395
It’s Your Money, Your Future—Own It (sponsor)
Retirement can be daunting, but it doesn’t need to be.
Imagine having an expert in your corner to help you with your financial goals. Someone to help you determine if you’re ahead, behind, or right on track. With SmartAsset, that’s not just a dream—it’s reality. This free tool connects you with pre-screened financial advisors who work in your best interests. It’s quick, it’s easy, so take the leap today and start planning smarter!
Don’t waste another minute; get started right here and help your retirement dreams become a retirement reality.
Thank you for reading! Have some feedback for us?
Contact the 24/7 Wall St. editorial team.
 24/7 Wall St.
 24/7 Wall St.
