Special Report
States Where the COVID-19 Surge Is the Worst Right Now

Published:
Last Updated:

Data gathered by the Centers for Disease Control and Prevention show that indicators of COVID-19 for the week ending Sept. 30 are trending lower nationally. Still, the pandemic is maintaining its grip more tightly on some states than others. (These are the states with the most health-conscious residents.)
To determine the states where the COVID-19 surge Is the worst right now, 24/7 Tempo reviewed data on recent COVID-19 hospital admissions from the CDC. States were ranked based on the number of new hospital admissions due to COVID-19 per 100,000 state residents for the week of Sept. 24-30, 2023.
Five of the 10 states with the most COVID-19 hospital admissions per capita for the week of Sept. 24-30 are in the Northeast – New York, Massachusetts, Connecticut, Vermont, and New Jersey. New York, Massachusetts, and Connecticut, along with Montana and West Virginia, were also among the 10 states with the highest rate of COVID-19-related hospital admissions the previous week. The latter two states had the biggest increases: Montana’s rate rose to 10.9 from 10.2 per 100,000 residents, while West Virginia edged up to 9.7 from 9.6. (Hospitalization rates vary within each state, too, of course. Here’s a rundown of the counties where the COVID-19 increase is the worst in every state.)
California, New York, Texas, and Florida had the most total (not per capita) hospital admissions for the week, all above 1,200.
The seven-day moving average of hospital admissions was just over 18,000 for the week ending Sept. 30, a drop of 6% from the prior weekly period, according to CDC data. Test positivity was 10.9% for the week ending Sept. 30, down from 12.4% in the past two weeks. Thirty states have a positivity rate below the national average.
Methodology:
To determine the states where the COVID-19 surge is the worst right now, 24/7 Tempo reviewed data on recent COVID-19 hospital admissions from the Centers for Disease Control and Prevention. States were ranked based on the number of new hospital admissions due to COVID-19 per 100,000 state residents for the week of Sept. 24-30, 2023. Supplemental data on the total number of recorded COVID-19 hospital admissions since Aug. 1, 2020; the total number of deaths due to COVID-19 since January 2020; and the COVID-19 test positivity rate for the week of Sept. 24-30, 2023 also came from the CDC. Population data used to adjust hospital admission and death counts per capita came from the U.S. Census Bureau’s Population and Housing Unit Estimates program and is for July 1, 2022.

50. Alaska
> New weekly COVID-19 hospital admissions, Sept. 24-30, 2023: 2.9 per 100,000 (21 total)
> COVID-19 hospital admissions since Aug. 1, 2020: 1,339.0 per 100,000 (7th lowest)
> COVID-19 deaths since January 2020: 207.7 per 100,000 (5th lowest)
> Current COVID-19 test positivity rate: 13.0% (3rd highest)

49. Mississippi
> New weekly COVID-19 hospital admissions, Sept. 24-30, 2023: 3.1 per 100,000 (90 total)
> COVID-19 hospital admissions since Aug. 1, 2020: 1,911.1 per 100,000 (24th highest)
> COVID-19 deaths since January 2020: 506.8 per 100,000 (the highest)
> Current COVID-19 test positivity rate: 8.9% (13th lowest)
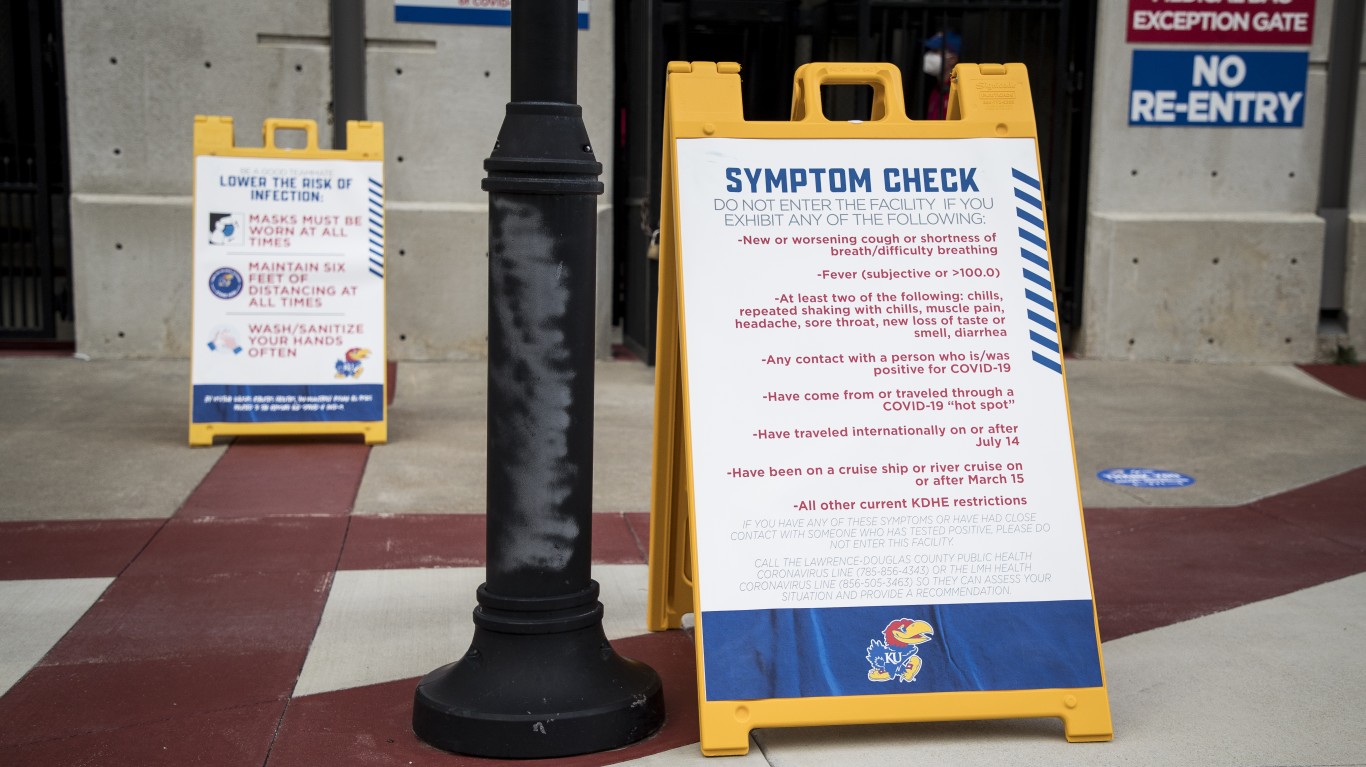
48. Kansas
> New weekly COVID-19 hospital admissions, Sept. 24-30, 2023: 3.3 per 100,000 (97 total)
> COVID-19 hospital admissions since Aug. 1, 2020: 1,953.7 per 100,000 (20th highest)
> COVID-19 deaths since January 2020: 361.5 per 100,000 (23rd highest)
> Current COVID-19 test positivity rate: 11.9% (7th highest)

47. Georgia
> New weekly COVID-19 hospital admissions, Sept. 24-30, 2023: 3.6 per 100,000 (391 total)
> COVID-19 hospital admissions since Aug. 1, 2020: 2,208.3 per 100,000 (9th highest)
> COVID-19 deaths since January 2020: 333.0 per 100,000 (20th lowest)
> Current COVID-19 test positivity rate: 8.9% (13th lowest)
[in-text-ad]

46. Maine
> New weekly COVID-19 hospital admissions, Sept. 24-30, 2023: 3.9 per 100,000 (54 total)
> COVID-19 hospital admissions since Aug. 1, 2020: 1,102.7 per 100,000 (3rd lowest)
> COVID-19 deaths since January 2020: 238.7 per 100,000 (8th lowest)
> Current COVID-19 test positivity rate: 10.0% (24th lowest)

45. Louisiana
> New weekly COVID-19 hospital admissions, Sept. 24-30, 2023: 4.0 per 100,000 (182 total)
> COVID-19 hospital admissions since Aug. 1, 2020: 2,105.7 per 100,000 (13th highest)
> COVID-19 deaths since January 2020: 386.4 per 100,000 (14th highest)
> Current COVID-19 test positivity rate: 9.4% (18th lowest)
[in-text-ad]
44. Oklahoma
> New weekly COVID-19 hospital admissions, Sept. 24-30, 2023: 4.0 per 100,000 (161 total)
> COVID-19 hospital admissions since Aug. 1, 2020: 2,749.8 per 100,000 (2nd highest)
> COVID-19 deaths since January 2020: 487.7 per 100,000 (3rd highest)
> Current COVID-19 test positivity rate: 9.4% (18th lowest)

43. Washington
> New weekly COVID-19 hospital admissions, Sept. 24-30, 2023: 4.1 per 100,000 (316 total)
> COVID-19 hospital admissions since Aug. 1, 2020: 999.0 per 100,000 (2nd lowest)
> COVID-19 deaths since January 2020: 194.8 per 100,000 (4th lowest)
> Current COVID-19 test positivity rate: 13.0% (3rd highest)

42. Tennessee
> New weekly COVID-19 hospital admissions, Sept. 24-30, 2023: 4.1 per 100,000 (288 total)
> COVID-19 hospital admissions since Aug. 1, 2020: 1,867.5 per 100,000 (24th lowest)
> COVID-19 deaths since January 2020: 409.2 per 100,000 (10th highest)
> Current COVID-19 test positivity rate: 8.9% (13th lowest)
[in-text-ad]

41. New Mexico
> New weekly COVID-19 hospital admissions, Sept. 24-30, 2023: 4.1 per 100,000 (87 total)
> COVID-19 hospital admissions since Aug. 1, 2020: 1,819.4 per 100,000 (22nd lowest)
> COVID-19 deaths since January 2020: 443.4 per 100,000 (5th highest)
> Current COVID-19 test positivity rate: 9.4% (18th lowest)

40. Arizona
> New weekly COVID-19 hospital admissions, Sept. 24-30, 2023: 4.3 per 100,000 (316 total)
> COVID-19 hospital admissions since Aug. 1, 2020: 2,098.3 per 100,000 (14th highest)
> COVID-19 deaths since January 2020: 404.5 per 100,000 (13th highest)
> Current COVID-19 test positivity rate: 11.1% (17th highest)
[in-text-ad]
39. Nebraska
> New weekly COVID-19 hospital admissions, Sept. 24-30, 2023: 4.4 per 100,000 (86 total)
> COVID-19 hospital admissions since Aug. 1, 2020: 1,614.8 per 100,000 (17th lowest)
> COVID-19 deaths since January 2020: 293.9 per 100,000 (15th lowest)
> Current COVID-19 test positivity rate: 11.9% (7th highest)

38. Iowa
> New weekly COVID-19 hospital admissions, Sept. 24-30, 2023: 4.5 per 100,000 (143 total)
> COVID-19 hospital admissions since Aug. 1, 2020: 1,711.2 per 100,000 (19th lowest)
> COVID-19 deaths since January 2020: 348.7 per 100,000 (25th highest)
> Current COVID-19 test positivity rate: 11.9% (7th highest)

37. Illinois
> New weekly COVID-19 hospital admissions, Sept. 24-30, 2023: 4.5 per 100,000 (566 total)
> COVID-19 hospital admissions since Aug. 1, 2020: 1,837.5 per 100,000 (23rd lowest)
> COVID-19 deaths since January 2020: 321.8 per 100,000 (19th lowest)
> Current COVID-19 test positivity rate: 11.4% (11th highest)
[in-text-ad]

36. Minnesota
> New weekly COVID-19 hospital admissions, Sept. 24-30, 2023: 4.5 per 100,000 (260 total)
> COVID-19 hospital admissions since Aug. 1, 2020: 1,391.4 per 100,000 (9th lowest)
> COVID-19 deaths since January 2020: 272.9 per 100,000 (10th lowest)
> Current COVID-19 test positivity rate: 11.4% (11th highest)

35. Utah
> New weekly COVID-19 hospital admissions, Sept. 24-30, 2023: 4.6 per 100,000 (155 total)
> COVID-19 hospital admissions since Aug. 1, 2020: 1,400.9 per 100,000 (10th lowest)
> COVID-19 deaths since January 2020: 163.9 per 100,000 (3rd lowest)
> Current COVID-19 test positivity rate: 10.4% (21st highest)
[in-text-ad]
34. North Dakota
> New weekly COVID-19 hospital admissions, Sept. 24-30, 2023: 4.6 per 100,000 (36 total)
> COVID-19 hospital admissions since Aug. 1, 2020: 1,943.4 per 100,000 (21st highest)
> COVID-19 deaths since January 2020: 339.4 per 100,000 (21st lowest)
> Current COVID-19 test positivity rate: 10.4% (21st highest)

33. Indiana
> New weekly COVID-19 hospital admissions, Sept. 24-30, 2023: 4.6 per 100,000 (316 total)
> COVID-19 hospital admissions since Aug. 1, 2020: 2,052.8 per 100,000 (15th highest)
> COVID-19 deaths since January 2020: 381.2 per 100,000 (16th highest)
> Current COVID-19 test positivity rate: 11.4% (11th highest)

32. Texas
> New weekly COVID-19 hospital admissions, Sept. 24-30, 2023: 4.7 per 100,000 (1404 total)
> COVID-19 hospital admissions since Aug. 1, 2020: 2,044.8 per 100,000 (17th highest)
> COVID-19 deaths since January 2020: 341.8 per 100,000 (24th lowest)
> Current COVID-19 test positivity rate: 9.4% (18th lowest)
[in-text-ad]

31. Pennsylvania
> New weekly COVID-19 hospital admissions, Sept. 24-30, 2023: 4.8 per 100,000 (627 total)
> COVID-19 hospital admissions since Aug. 1, 2020: 1,905.4 per 100,000 (25th highest)
> COVID-19 deaths since January 2020: 407.9 per 100,000 (11th highest)
> Current COVID-19 test positivity rate: 6.9% (5th lowest)

30. Ohio
> New weekly COVID-19 hospital admissions, Sept. 24-30, 2023: 5.1 per 100,000 (597 total)
> COVID-19 hospital admissions since Aug. 1, 2020: 2,233.4 per 100,000 (8th highest)
> COVID-19 deaths since January 2020: 424.5 per 100,000 (7th highest)
> Current COVID-19 test positivity rate: 11.4% (11th highest)
[in-text-ad]

29. Virginia
> New weekly COVID-19 hospital admissions, Sept. 24-30, 2023: 5.1 per 100,000 (443 total)
> COVID-19 hospital admissions since Aug. 1, 2020: 1,414.0 per 100,000 (11th lowest)
> COVID-19 deaths since January 2020: 273.2 per 100,000 (11th lowest)
> Current COVID-19 test positivity rate: 6.9% (5th lowest)

28. Maryland
> New weekly COVID-19 hospital admissions, Sept. 24-30, 2023: 5.1 per 100,000 (315 total)
> COVID-19 hospital admissions since Aug. 1, 2020: 1,571.1 per 100,000 (14th lowest)
> COVID-19 deaths since January 2020: 295.4 per 100,000 (16th lowest)
> Current COVID-19 test positivity rate: 6.9% (5th lowest)

27. South Carolina
> New weekly COVID-19 hospital admissions, Sept. 24-30, 2023: 5.1 per 100,000 (270 total)
> COVID-19 hospital admissions since Aug. 1, 2020: 1,815.7 per 100,000 (21st lowest)
> COVID-19 deaths since January 2020: 404.9 per 100,000 (12th highest)
> Current COVID-19 test positivity rate: 8.9% (13th lowest)
[in-text-ad]

26. North Carolina
> New weekly COVID-19 hospital admissions, Sept. 24-30, 2023: 5.2 per 100,000 (558 total)
> COVID-19 hospital admissions since Aug. 1, 2020: 1,588.8 per 100,000 (16th lowest)
> COVID-19 deaths since January 2020: 318.6 per 100,000 (18th lowest)
> Current COVID-19 test positivity rate: 8.9% (13th lowest)

25. Wyoming
> New weekly COVID-19 hospital admissions, Sept. 24-30, 2023: 5.3 per 100,000 (31 total)
> COVID-19 hospital admissions since Aug. 1, 2020: 1,974.6 per 100,000 (19th highest)
> COVID-19 deaths since January 2020: 370.0 per 100,000 (19th highest)
> Current COVID-19 test positivity rate: 10.4% (21st highest)
[in-text-ad]

24. Wisconsin
> New weekly COVID-19 hospital admissions, Sept. 24-30, 2023: 5.3 per 100,000 (315 total)
> COVID-19 hospital admissions since Aug. 1, 2020: 2,160.4 per 100,000 (10th highest)
> COVID-19 deaths since January 2020: 292.0 per 100,000 (14th lowest)
> Current COVID-19 test positivity rate: 11.4% (11th highest)
23. Alabama
> New weekly COVID-19 hospital admissions, Sept. 24-30, 2023: 5.4 per 100,000 (276 total)
> COVID-19 hospital admissions since Aug. 1, 2020: 2,366.2 per 100,000 (6th highest)
> COVID-19 deaths since January 2020: 442.7 per 100,000 (6th highest)
> Current COVID-19 test positivity rate: 8.9% (13th lowest)

22. New Hampshire
> New weekly COVID-19 hospital admissions, Sept. 24-30, 2023: 5.4 per 100,000 (76 total)
> COVID-19 hospital admissions since Aug. 1, 2020: 1,319.1 per 100,000 (6th lowest)
> COVID-19 deaths since January 2020: 237.4 per 100,000 (7th lowest)
> Current COVID-19 test positivity rate: 10.0% (24th lowest)
[in-text-ad]

21. California
> New weekly COVID-19 hospital admissions, Sept. 24-30, 2023: 5.5 per 100,000 (2138 total)
> COVID-19 hospital admissions since Aug. 1, 2020: 1,580.1 per 100,000 (15th lowest)
> COVID-19 deaths since January 2020: 280.3 per 100,000 (12th lowest)
> Current COVID-19 test positivity rate: 11.1% (17th highest)

20. Nevada
> New weekly COVID-19 hospital admissions, Sept. 24-30, 2023: 5.5 per 100,000 (175 total)
> COVID-19 hospital admissions since Aug. 1, 2020: 2,045.0 per 100,000 (16th highest)
> COVID-19 deaths since January 2020: 376.0 per 100,000 (18th highest)
> Current COVID-19 test positivity rate: 11.1% (17th highest)
[in-text-ad]

19. Colorado
> New weekly COVID-19 hospital admissions, Sept. 24-30, 2023: 5.5 per 100,000 (322 total)
> COVID-19 hospital admissions since Aug. 1, 2020: 1,673.7 per 100,000 (18th lowest)
> COVID-19 deaths since January 2020: 257.2 per 100,000 (9th lowest)
> Current COVID-19 test positivity rate: 10.4% (21st highest)

18. Michigan
> New weekly COVID-19 hospital admissions, Sept. 24-30, 2023: 5.5 per 100,000 (555 total)
> COVID-19 hospital admissions since Aug. 1, 2020: 1,934.5 per 100,000 (23rd highest)
> COVID-19 deaths since January 2020: 377.4 per 100,000 (17th highest)
> Current COVID-19 test positivity rate: 11.4% (11th highest)

17. Florida
> New weekly COVID-19 hospital admissions, Sept. 24-30, 2023: 5.8 per 100,000 (1294 total)
> COVID-19 hospital admissions since Aug. 1, 2020: 2,587.7 per 100,000 (4th highest)
> COVID-19 deaths since January 2020: 362.1 per 100,000 (22nd highest)
> Current COVID-19 test positivity rate: 8.9% (13th lowest)
[in-text-ad]

16. Arkansas
> New weekly COVID-19 hospital admissions, Sept. 24-30, 2023: 6.0 per 100,000 (182 total)
> COVID-19 hospital admissions since Aug. 1, 2020: 2,234.5 per 100,000 (7th highest)
> COVID-19 deaths since January 2020: 413.8 per 100,000 (9th highest)
> Current COVID-19 test positivity rate: 9.4% (18th lowest)

15. Hawaii
> New weekly COVID-19 hospital admissions, Sept. 24-30, 2023: 6.0 per 100,000 (87 total)
> COVID-19 hospital admissions since Aug. 1, 2020: 1,377.8 per 100,000 (8th lowest)
> COVID-19 deaths since January 2020: 137.7 per 100,000 (the lowest)
> Current COVID-19 test positivity rate: 11.1% (17th highest)
[in-text-ad]

14. Kentucky
> New weekly COVID-19 hospital admissions, Sept. 24-30, 2023: 6.1 per 100,000 (276 total)
> COVID-19 hospital admissions since Aug. 1, 2020: 3,471.3 per 100,000 (the highest)
> COVID-19 deaths since January 2020: 445.1 per 100,000 (4th highest)
> Current COVID-19 test positivity rate: 8.9% (13th lowest)

13. Idaho
> New weekly COVID-19 hospital admissions, Sept. 24-30, 2023: 6.4 per 100,000 (125 total)
> COVID-19 hospital admissions since Aug. 1, 2020: 1,442.2 per 100,000 (12th lowest)
> COVID-19 deaths since January 2020: 285.2 per 100,000 (13th lowest)
> Current COVID-19 test positivity rate: 13.0% (3rd highest)

12. Rhode Island
> New weekly COVID-19 hospital admissions, Sept. 24-30, 2023: 6.5 per 100,000 (71 total)
> COVID-19 hospital admissions since Aug. 1, 2020: 1,216.6 per 100,000 (5th lowest)
> COVID-19 deaths since January 2020: 365.5 per 100,000 (20th highest)
> Current COVID-19 test positivity rate: 10.0% (24th lowest)
[in-text-ad]

11. Missouri
> New weekly COVID-19 hospital admissions, Sept. 24-30, 2023: 6.7 per 100,000 (412 total)
> COVID-19 hospital admissions since Aug. 1, 2020: 2,133.4 per 100,000 (11th highest)
> COVID-19 deaths since January 2020: 365.3 per 100,000 (21st highest)
> Current COVID-19 test positivity rate: 11.9% (7th highest)

10. New Jersey
> New weekly COVID-19 hospital admissions, Sept. 24-30, 2023: 6.7 per 100,000 (618 total)
> COVID-19 hospital admissions since Aug. 1, 2020: 1,879.8 per 100,000 (25th lowest)
> COVID-19 deaths since January 2020: 382.8 per 100,000 (15th highest)
> Current COVID-19 test positivity rate: 13.9% (the highest)
[in-text-ad]

9. Oregon
> New weekly COVID-19 hospital admissions, Sept. 24-30, 2023: 6.7 per 100,000 (285 total)
> COVID-19 hospital admissions since Aug. 1, 2020: 1,110.4 per 100,000 (4th lowest)
> COVID-19 deaths since January 2020: 220.4 per 100,000 (6th lowest)
> Current COVID-19 test positivity rate: 13.0% (3rd highest)

8. Delaware
> New weekly COVID-19 hospital admissions, Sept. 24-30, 2023: 6.9 per 100,000 (70 total)
> COVID-19 hospital admissions since Aug. 1, 2020: 1,992.1 per 100,000 (18th highest)
> COVID-19 deaths since January 2020: 341.1 per 100,000 (23rd lowest)
> Current COVID-19 test positivity rate: 6.9% (5th lowest)

7. Vermont
> New weekly COVID-19 hospital admissions, Sept. 24-30, 2023: 7.0 per 100,000 (45 total)
> COVID-19 hospital admissions since Aug. 1, 2020: 989.9 per 100,000 (the lowest)
> COVID-19 deaths since January 2020: 160.1 per 100,000 (2nd lowest)
> Current COVID-19 test positivity rate: 10.0% (24th lowest)
[in-text-ad]

6. Connecticut
> New weekly COVID-19 hospital admissions, Sept. 24-30, 2023: 7.2 per 100,000 (261 total)
> COVID-19 hospital admissions since Aug. 1, 2020: 1,805.7 per 100,000 (20th lowest)
> COVID-19 deaths since January 2020: 340.7 per 100,000 (22nd lowest)
> Current COVID-19 test positivity rate: 10.0% (24th lowest)

5. Massachusetts
> New weekly COVID-19 hospital admissions, Sept. 24-30, 2023: 7.2 per 100,000 (505 total)
> COVID-19 hospital admissions since Aug. 1, 2020: 1,510.5 per 100,000 (13th lowest)
> COVID-19 deaths since January 2020: 301.7 per 100,000 (17th lowest)
> Current COVID-19 test positivity rate: 10.0% (24th lowest)
[in-text-ad]

4. South Dakota
> New weekly COVID-19 hospital admissions, Sept. 24-30, 2023: 7.6 per 100,000 (69 total)
> COVID-19 hospital admissions since Aug. 1, 2020: 2,131.5 per 100,000 (12th highest)
> COVID-19 deaths since January 2020: 361.4 per 100,000 (24th highest)
> Current COVID-19 test positivity rate: 10.4% (21st highest)

3. New York
> New weekly COVID-19 hospital admissions, Sept. 24-30, 2023: 8.8 per 100,000 (1736 total)
> COVID-19 hospital admissions since Aug. 1, 2020: 1,936.1 per 100,000 (22nd highest)
> COVID-19 deaths since January 2020: 414.1 per 100,000 (8th highest)
> Current COVID-19 test positivity rate: 13.9% (the highest)

2. West Virginia
> New weekly COVID-19 hospital admissions, Sept. 24-30, 2023: 9.7 per 100,000 (172 total)
> COVID-19 hospital admissions since Aug. 1, 2020: 2,415.1 per 100,000 (5th highest)
> COVID-19 deaths since January 2020: 490.1 per 100,000 (2nd highest)
> Current COVID-19 test positivity rate: 6.9% (5th lowest)
[in-text-ad]

1. Montana
> New weekly COVID-19 hospital admissions, Sept. 24-30, 2023: 10.9 per 100,000 (122 total)
> COVID-19 hospital admissions since Aug. 1, 2020: 2,707.1 per 100,000 (3rd highest)
> COVID-19 deaths since January 2020: 345.5 per 100,000 (25th lowest)
> Current COVID-19 test positivity rate: 10.4% (21st highest)
After two decades of reviewing financial products I haven’t seen anything like this. Credit card companies are at war, handing out free rewards and benefits to win the best customers.
A good cash back card can be worth thousands of dollars a year in free money, not to mention other perks like travel, insurance, and access to fancy lounges.
Our top pick today pays up to 5% cash back, a $200 bonus on top, and $0 annual fee. Click here to apply before they stop offering rewards this generous.
Flywheel Publishing has partnered with CardRatings for our coverage of credit card products. Flywheel Publishing and CardRatings may receive a commission from card issuers.
Thank you for reading! Have some feedback for us?
Contact the 24/7 Wall St. editorial team.