Special Report
Weekly Update: Here's How Bad COVID Is Right Now in Every State

Published:

As we get deeper into the autumn season, people are spending more time inside and getting ready for Halloween as well as for family gatherings for the holidays. The potential is there for occasions where COVID-19 can be spread more rapidly. However, data from the Centers for Disease Control and Prevention are reassuring, indicating hospital admissions and test-positivity rates from COVID-19 for the week ending Oct. 14 are trending lower.
The seven-day moving average of hospital admissions across the country continued moving downward. There were 16,158 admissions for the week ending Oct. 14, down from the previous period when nearly 17,000 admissions were recorded. Test positivity was 9.5% for the week ending Oct. 14, down 0.7 percentage points. Even as the national trend for hospitalizations and test positivity is encouraging, cases are still rising in some places. (These are states where the most people are living with long COVID.)
To determine the states where the COVID-19 surge is the worst right now, 24/7 Tempo reviewed data on recent COVID-19 hospital admissions from the Centers for Disease Control and Prevention. States were ranked based on the number of new hospital admissions due to COVID-19 per 100,000 state residents for the week of Oct. 8-14, 2023. Supplemental data on the total number of recorded COVID-19 hospital admissions since Aug. 1, 2020; the total number of deaths due to COVID-19 since January 2020; and the COVID-19 test positivity rate for the week of Oct. 8-14, 2023 also came from the CDC.
Four of the five states with the highest weekly COVID-19 hospital admissions per 100,000 people this week — Massachusetts, New York, Hawaii, and West Virginia — had lower rates than the corresponding four of five highest states from the prior week. Montana, which had the highest weekly COVID-19 hospital admissions early in October, returned to the top spot for the period ended Oct. 14 with a rate of 9.2.
Four of the five states with the lowest weekly COVID-19 hospital admissions were from the South — Mississippi, Georgia, Tennessee, and Arkansas. Nebraska was the fifth.
As was the case the previous reporting period, the Far West states of Montana, Colorado, North and South Dakota, Utah, and Wyoming reported the highest test-positivity rates in the nation, all at 14.4. The Mid-Atlantic states of Maryland, Virginia, Delaware, Pennsylvania, and West Virginia recorded the lowest rates, all at 4.8.

50. Mississippi
> New weekly COVID-19 hospital admissions, Oct. 8-14, 2023: 1.8 per 100,000 (53 total)
> COVID-19 hospital admissions since Aug. 1, 2020: 1,916.0 per 100,000 (24th highest)
> COVID-19 deaths since Jan. 2020: 508.5 per 100,000 (the highest)
> Current COVID-19 test positivity rate: 7.3% (13th lowest)

49. Georgia
> New weekly COVID-19 hospital admissions, Oct. 8-14, 2023: 2.7 per 100,000 (291 total)
> COVID-19 hospital admissions since Aug. 1, 2020: 2,214.8 per 100,000 (9th highest)
> COVID-19 deaths since Jan. 2020: 333.7 per 100,000 (20th lowest)
> Current COVID-19 test positivity rate: 7.3% (13th lowest)

48. Tennessee
> New weekly COVID-19 hospital admissions, Oct. 8-14, 2023: 3.4 per 100,000 (241 total)
> COVID-19 hospital admissions since Aug. 1, 2020: 1,874.5 per 100,000 (24th lowest)
> COVID-19 deaths since Jan. 2020: 410.0 per 100,000 (10th highest)
> Current COVID-19 test positivity rate: 7.3% (13th lowest)
47. Nebraska
> New weekly COVID-19 hospital admissions, Oct. 8-14, 2023: 3.5 per 100,000 (68 total)
> COVID-19 hospital admissions since Aug. 1, 2020: 1,621.9 per 100,000 (17th lowest)
> COVID-19 deaths since Jan. 2020: 294.1 per 100,000 (15th lowest)
> Current COVID-19 test positivity rate: 9.2% (22nd highest)
46. Arkansas
> New weekly COVID-19 hospital admissions, Oct. 8-14, 2023: 3.7 per 100,000 (114 total)
> COVID-19 hospital admissions since Aug. 1, 2020: 2,243.5 per 100,000 (7th highest)
> COVID-19 deaths since Jan. 2020: 415.0 per 100,000 (9th highest)
> Current COVID-19 test positivity rate: 10.5% (11th highest)

45. Ohio
> New weekly COVID-19 hospital admissions, Oct. 8-14, 2023: 3.9 per 100,000 (455 total)
> COVID-19 hospital admissions since Aug. 1, 2020: 2,242.2 per 100,000 (8th highest)
> COVID-19 deaths since Jan. 2020: 425.5 per 100,000 (7th highest)
> Current COVID-19 test positivity rate: 8.8% (19th lowest)

44. Louisiana
> New weekly COVID-19 hospital admissions, Oct. 8-14, 2023: 3.9 per 100,000 (180 total)
> COVID-19 hospital admissions since Aug. 1, 2020: 2,113.0 per 100,000 (13th highest)
> COVID-19 deaths since Jan. 2020: 387.1 per 100,000 (14th highest)
> Current COVID-19 test positivity rate: 10.5% (11th highest)

43. Iowa
> New weekly COVID-19 hospital admissions, Oct. 8-14, 2023: 4.0 per 100,000 (127 total)
> COVID-19 hospital admissions since Aug. 1, 2020: 1,718.9 per 100,000 (19th lowest)
> COVID-19 deaths since Jan. 2020: 349.3 per 100,000 (25th highest)
> Current COVID-19 test positivity rate: 9.2% (22nd highest)

42. Illinois
> New weekly COVID-19 hospital admissions, Oct. 8-14, 2023: 4.0 per 100,000 (503 total)
> COVID-19 hospital admissions since Aug. 1, 2020: 1,846.1 per 100,000 (23rd lowest)
> COVID-19 deaths since Jan. 2020: 322.3 per 100,000 (19th lowest)
> Current COVID-19 test positivity rate: 8.8% (19th lowest)

41. Texas
> New weekly COVID-19 hospital admissions, Oct. 8-14, 2023: 4.0 per 100,000 (1,209 total)
> COVID-19 hospital admissions since Aug. 1, 2020: 2,052.9 per 100,000 (17th highest)
> COVID-19 deaths since Jan. 2020: 342.4 per 100,000 (24th lowest)
> Current COVID-19 test positivity rate: 10.5% (11th highest)

40. Indiana
> New weekly COVID-19 hospital admissions, Oct. 8-14, 2023: 4.0 per 100,000 (276 total)
> COVID-19 hospital admissions since Aug. 1, 2020: 2,060.1 per 100,000 (15th highest)
> COVID-19 deaths since Jan. 2020: 382.1 per 100,000 (16th highest)
> Current COVID-19 test positivity rate: 8.8% (19th lowest)
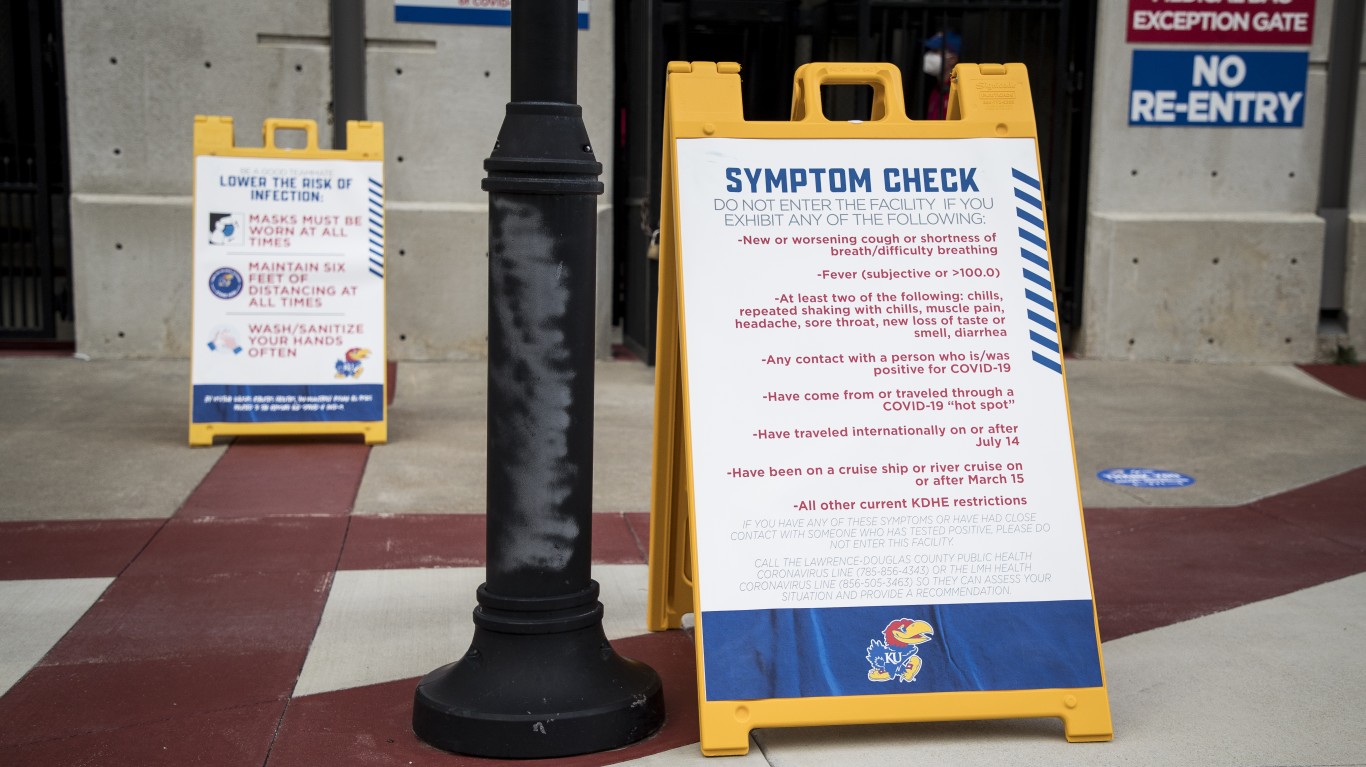
39. Kansas
> New weekly COVID-19 hospital admissions, Oct. 8-14, 2023: 4.1 per 100,000 (120 total)
> COVID-19 hospital admissions since Aug. 1, 2020: 1,962.9 per 100,000 (20th highest)
> COVID-19 deaths since Jan. 2020: 362.3 per 100,000 (23rd highest)
> Current COVID-19 test positivity rate: 9.2% (22nd highest)
38. Alaska
> New weekly COVID-19 hospital admissions, Oct. 8-14, 2023: 4.1 per 100,000 (30 total)
> COVID-19 hospital admissions since Aug. 1, 2020: 1,346.8 per 100,000 (7th lowest)
> COVID-19 deaths since Jan. 2020: 208.3 per 100,000 (5th lowest)
> Current COVID-19 test positivity rate: 11.0% (7th highest)
37. Alabama
> New weekly COVID-19 hospital admissions, Oct. 8-14, 2023: 4.2 per 100,000 (213 total)
> COVID-19 hospital admissions since Aug. 1, 2020: 2,374.8 per 100,000 (6th highest)
> COVID-19 deaths since Jan. 2020: 443.7 per 100,000 (6th highest)
> Current COVID-19 test positivity rate: 7.3% (13th lowest)

36. Maryland
> New weekly COVID-19 hospital admissions, Oct. 8-14, 2023: 4.2 per 100,000 (260 total)
> COVID-19 hospital admissions since Aug. 1, 2020: 1,580.5 per 100,000 (14th lowest)
> COVID-19 deaths since Jan. 2020: 296.2 per 100,000 (16th lowest)
> Current COVID-19 test positivity rate: 4.8% (5th lowest)

35. Maine
> New weekly COVID-19 hospital admissions, Oct. 8-14, 2023: 4.3 per 100,000 (59 total)
> COVID-19 hospital admissions since Aug. 1, 2020: 1,111.2 per 100,000 (3rd lowest)
> COVID-19 deaths since Jan. 2020: 239.8 per 100,000 (8th lowest)
> Current COVID-19 test positivity rate: 8.9% (25th lowest)
34. North Carolina
> New weekly COVID-19 hospital admissions, Oct. 8-14, 2023: 4.3 per 100,000 (458 total)
> COVID-19 hospital admissions since Aug. 1, 2020: 1,598.4 per 100,000 (16th lowest)
> COVID-19 deaths since Jan. 2020: 319.0 per 100,000 (18th lowest)
> Current COVID-19 test positivity rate: 7.3% (13th lowest)
33. Oklahoma
> New weekly COVID-19 hospital admissions, Oct. 8-14, 2023: 4.3 per 100,000 (174 total)
> COVID-19 hospital admissions since Aug. 1, 2020: 2,757.9 per 100,000 (2nd highest)
> COVID-19 deaths since Jan. 2020: 488.8 per 100,000 (3rd highest)
> Current COVID-19 test positivity rate: 10.5% (11th highest)

32. Wyoming
> New weekly COVID-19 hospital admissions, Oct. 8-14, 2023: 4.5 per 100,000 (26 total)
> COVID-19 hospital admissions since Aug. 1, 2020: 1,985.8 per 100,000 (19th highest)
> COVID-19 deaths since Jan. 2020: 371.5 per 100,000 (19th highest)
> Current COVID-19 test positivity rate: 14.4% (the highest)

31. Florida
> New weekly COVID-19 hospital admissions, Oct. 8-14, 2023: 4.6 per 100,000 (1,015 total)
> COVID-19 hospital admissions since Aug. 1, 2020: 2,598.5 per 100,000 (4th highest)
> COVID-19 deaths since Jan. 2020: 363.1 per 100,000 (22nd highest)
> Current COVID-19 test positivity rate: 7.3% (13th lowest)

30. California
> New weekly COVID-19 hospital admissions, Oct. 8-14, 2023: 4.6 per 100,000 (1,785 total)
> COVID-19 hospital admissions since Aug. 1, 2020: 1,589.5 per 100,000 (15th lowest)
> COVID-19 deaths since Jan. 2020: 280.9 per 100,000 (12th lowest)
> Current COVID-19 test positivity rate: 10.5% (11th highest)

29. South Carolina
> New weekly COVID-19 hospital admissions, Oct. 8-14, 2023: 4.6 per 100,000 (242 total)
> COVID-19 hospital admissions since Aug. 1, 2020: 1,825.3 per 100,000 (21st lowest)
> COVID-19 deaths since Jan. 2020: 406.0 per 100,000 (12th highest)
> Current COVID-19 test positivity rate: 7.3% (13th lowest)

28. Utah
> New weekly COVID-19 hospital admissions, Oct. 8-14, 2023: 4.6 per 100,000 (156 total)
> COVID-19 hospital admissions since Aug. 1, 2020: 1,409.8 per 100,000 (10th lowest)
> COVID-19 deaths since Jan. 2020: 164.4 per 100,000 (3rd lowest)
> Current COVID-19 test positivity rate: 14.4% (the highest)

27. Michigan
> New weekly COVID-19 hospital admissions, Oct. 8-14, 2023: 4.6 per 100,000 (464 total)
> COVID-19 hospital admissions since Aug. 1, 2020: 1,944.3 per 100,000 (23rd highest)
> COVID-19 deaths since Jan. 2020: 378.2 per 100,000 (17th highest)
> Current COVID-19 test positivity rate: 8.8% (19th lowest)

26. Virginia
> New weekly COVID-19 hospital admissions, Oct. 8-14, 2023: 4.7 per 100,000 (410 total)
> COVID-19 hospital admissions since Aug. 1, 2020: 1,423.6 per 100,000 (11th lowest)
> COVID-19 deaths since Jan. 2020: 274.0 per 100,000 (11th lowest)
> Current COVID-19 test positivity rate: 4.8% (5th lowest)

25. Pennsylvania
> New weekly COVID-19 hospital admissions, Oct. 8-14, 2023: 4.8 per 100,000 (617 total)
> COVID-19 hospital admissions since Aug. 1, 2020: 1,915.4 per 100,000 (25th highest)
> COVID-19 deaths since Jan. 2020: 408.9 per 100,000 (11th highest)
> Current COVID-19 test positivity rate: 4.8% (5th lowest)

24. Washington
> New weekly COVID-19 hospital admissions, Oct. 8-14, 2023: 4.8 per 100,000 (373 total)
> COVID-19 hospital admissions since Aug. 1, 2020: 1,009.2 per 100,000 (2nd lowest)
> COVID-19 deaths since Jan. 2020: 195.5 per 100,000 (4th lowest)
> Current COVID-19 test positivity rate: 11.0% (7th highest)

23. Vermont
> New weekly COVID-19 hospital admissions, Oct. 8-14, 2023: 4.8 per 100,000 (31 total)
> COVID-19 hospital admissions since Aug. 1, 2020: 999.6 per 100,000 (the lowest)
> COVID-19 deaths since Jan. 2020: 162.1 per 100,000 (2nd lowest)
> Current COVID-19 test positivity rate: 8.9% (25th lowest)

22. Wisconsin
> New weekly COVID-19 hospital admissions, Oct. 8-14, 2023: 4.8 per 100,000 (284 total)
> COVID-19 hospital admissions since Aug. 1, 2020: 2,171.0 per 100,000 (10th highest)
> COVID-19 deaths since Jan. 2020: 292.7 per 100,000 (14th lowest)
> Current COVID-19 test positivity rate: 8.8% (19th lowest)

21. Minnesota
> New weekly COVID-19 hospital admissions, Oct. 8-14, 2023: 4.8 per 100,000 (276 total)
> COVID-19 hospital admissions since Aug. 1, 2020: 1,400.8 per 100,000 (9th lowest)
> COVID-19 deaths since Jan. 2020: 273.9 per 100,000 (10th lowest)
> Current COVID-19 test positivity rate: 8.8% (19th lowest)

20. New Mexico
> New weekly COVID-19 hospital admissions, Oct. 8-14, 2023: 5.0 per 100,000 (106 total)
> COVID-19 hospital admissions since Aug. 1, 2020: 1,832.6 per 100,000 (22nd lowest)
> COVID-19 deaths since Jan. 2020: 443.9 per 100,000 (5th highest)
> Current COVID-19 test positivity rate: 10.5% (11th highest)

19. Rhode Island
> New weekly COVID-19 hospital admissions, Oct. 8-14, 2023: 5.1 per 100,000 (56 total)
> COVID-19 hospital admissions since Aug. 1, 2020: 1,229.9 per 100,000 (5th lowest)
> COVID-19 deaths since Jan. 2020: 366.6 per 100,000 (20th highest)
> Current COVID-19 test positivity rate: 8.9% (25th lowest)

18. Arizona
> New weekly COVID-19 hospital admissions, Oct. 8-14, 2023: 5.2 per 100,000 (385 total)
> COVID-19 hospital admissions since Aug. 1, 2020: 2,108.4 per 100,000 (14th highest)
> COVID-19 deaths since Jan. 2020: 405.3 per 100,000 (13th highest)
> Current COVID-19 test positivity rate: 10.5% (11th highest)

17. Missouri
> New weekly COVID-19 hospital admissions, Oct. 8-14, 2023: 5.2 per 100,000 (324 total)
> COVID-19 hospital admissions since Aug. 1, 2020: 2,143.4 per 100,000 (12th highest)
> COVID-19 deaths since Jan. 2020: 366.2 per 100,000 (21st highest)
> Current COVID-19 test positivity rate: 9.2% (22nd highest)

16. Nevada
> New weekly COVID-19 hospital admissions, Oct. 8-14, 2023: 5.5 per 100,000 (175 total)
> COVID-19 hospital admissions since Aug. 1, 2020: 2,054.6 per 100,000 (16th highest)
> COVID-19 deaths since Jan. 2020: 376.0 per 100,000 (18th highest)
> Current COVID-19 test positivity rate: 10.5% (11th highest)

15. Kentucky
> New weekly COVID-19 hospital admissions, Oct. 8-14, 2023: 5.8 per 100,000 (261 total)
> COVID-19 hospital admissions since Aug. 1, 2020: 3,482.7 per 100,000 (the highest)
> COVID-19 deaths since Jan. 2020: 446.8 per 100,000 (4th highest)
> Current COVID-19 test positivity rate: 7.3% (13th lowest)

14. South Dakota
> New weekly COVID-19 hospital admissions, Oct. 8-14, 2023: 5.8 per 100,000 (53 total)
> COVID-19 hospital admissions since Aug. 1, 2020: 2,143.8 per 100,000 (11th highest)
> COVID-19 deaths since Jan. 2020: 361.8 per 100,000 (24th highest)
> Current COVID-19 test positivity rate: 14.4% (the highest)
13. Idaho
> New weekly COVID-19 hospital admissions, Oct. 8-14, 2023: 5.8 per 100,000 (113 total)
> COVID-19 hospital admissions since Aug. 1, 2020: 1,455.5 per 100,000 (12th lowest)
> COVID-19 deaths since Jan. 2020: 286.1 per 100,000 (13th lowest)
> Current COVID-19 test positivity rate: 11.0% (7th highest)

12. Oregon
> New weekly COVID-19 hospital admissions, Oct. 8-14, 2023: 6.0 per 100,000 (254 total)
> COVID-19 hospital admissions since Aug. 1, 2020: 1,123.5 per 100,000 (4th lowest)
> COVID-19 deaths since Jan. 2020: 221.5 per 100,000 (6th lowest)
> Current COVID-19 test positivity rate: 11.0% (7th highest)
11. New Hampshire
> New weekly COVID-19 hospital admissions, Oct. 8-14, 2023: 6.0 per 100,000 (84 total)
> COVID-19 hospital admissions since Aug. 1, 2020: 1,332.5 per 100,000 (6th lowest)
> COVID-19 deaths since Jan. 2020: 238.2 per 100,000 (7th lowest)
> Current COVID-19 test positivity rate: 8.9% (25th lowest)
10. Delaware
> New weekly COVID-19 hospital admissions, Oct. 8-14, 2023: 6.2 per 100,000 (63 total)
> COVID-19 hospital admissions since Aug. 1, 2020: 2,003.8 per 100,000 (18th highest)
> COVID-19 deaths since Jan. 2020: 341.7 per 100,000 (22nd lowest)
> Current COVID-19 test positivity rate: 4.8% (5th lowest)

9. New Jersey
> New weekly COVID-19 hospital admissions, Oct. 8-14, 2023: 6.3 per 100,000 (585 total)
> COVID-19 hospital admissions since Aug. 1, 2020: 1,893.6 per 100,000 (25th lowest)
> COVID-19 deaths since Jan. 2020: 383.6 per 100,000 (15th highest)
> Current COVID-19 test positivity rate: 10.1% (20th highest)
8. North Dakota
> New weekly COVID-19 hospital admissions, Oct. 8-14, 2023: 6.5 per 100,000 (51 total)
> COVID-19 hospital admissions since Aug. 1, 2020: 1,956.1 per 100,000 (21st highest)
> COVID-19 deaths since Jan. 2020: 339.9 per 100,000 (21st lowest)
> Current COVID-19 test positivity rate: 14.4% (the highest)
7. Connecticut
> New weekly COVID-19 hospital admissions, Oct. 8-14, 2023: 6.8 per 100,000 (245 total)
> COVID-19 hospital admissions since Aug. 1, 2020: 1,818.9 per 100,000 (20th lowest)
> COVID-19 deaths since Jan. 2020: 341.8 per 100,000 (23rd lowest)
> Current COVID-19 test positivity rate: 8.9% (25th lowest)
6. Colorado
> New weekly COVID-19 hospital admissions, Oct. 8-14, 2023: 7.0 per 100,000 (411 total)
> COVID-19 hospital admissions since Aug. 1, 2020: 1,686.3 per 100,000 (18th lowest)
> COVID-19 deaths since Jan. 2020: 257.9 per 100,000 (9th lowest)
> Current COVID-19 test positivity rate: 14.4% (the highest)
5. West Virginia
> New weekly COVID-19 hospital admissions, Oct. 8-14, 2023: 7.1 per 100,000 (126 total)
> COVID-19 hospital admissions since Aug. 1, 2020: 2,431.7 per 100,000 (5th highest)
> COVID-19 deaths since Jan. 2020: 491.2 per 100,000 (2nd highest)
> Current COVID-19 test positivity rate: 4.8% (5th lowest)

4. Hawaii
> New weekly COVID-19 hospital admissions, Oct. 8-14, 2023: 7.4 per 100,000 (106 total)
> COVID-19 hospital admissions since Aug. 1, 2020: 1,392.9 per 100,000 (8th lowest)
> COVID-19 deaths since Jan. 2020: 138.8 per 100,000 (the lowest)
> Current COVID-19 test positivity rate: 10.5% (11th highest)

3. New York
> New weekly COVID-19 hospital admissions, Oct. 8-14, 2023: 7.5 per 100,000 (1,467 total)
> COVID-19 hospital admissions since Aug. 1, 2020: 1,952.3 per 100,000 (22nd highest)
> COVID-19 deaths since Jan. 2020: 415.3 per 100,000 (8th highest)
> Current COVID-19 test positivity rate: 10.1% (20th highest)

2. Massachusetts
> New weekly COVID-19 hospital admissions, Oct. 8-14, 2023: 7.7 per 100,000 (537 total)
> COVID-19 hospital admissions since Aug. 1, 2020: 1,525.1 per 100,000 (13th lowest)
> COVID-19 deaths since Jan. 2020: 302.7 per 100,000 (17th lowest)
> Current COVID-19 test positivity rate: 8.9% (25th lowest)

1. Montana
> New weekly COVID-19 hospital admissions, Oct. 8-14, 2023: 9.2 per 100,000 (103 total)
> COVID-19 hospital admissions since Aug. 1, 2020: 2,723.5 per 100,000 (3rd highest)
> COVID-19 deaths since Jan. 2020: 346.3 per 100,000 (25th lowest)
> Current COVID-19 test positivity rate: 14.4% (the highest)
Are You Ahead, or Behind on Retirement? (sponsor)
If you’re one of the over 4 Million Americans set to retire this year, you may want to pay attention. Many people have worked their whole lives preparing to retire without ever knowing the answer to the most important question: are you ahead, or behind on your retirement goals?
Don’t make the same mistake. It’s an easy question to answer. A quick conversation with a financial advisor can help you unpack your savings, spending, and goals for your money. With SmartAsset’s free tool, you can connect with vetted financial advisors in minutes.
Why wait? Click here to get started today!
Thank you for reading! Have some feedback for us?
Contact the 24/7 Wall St. editorial team.