The holiday season is hurtling toward us, with Thanksgiving less than a month away, and the start of family gatherings. These get-togethers pose concerns as super-spreader events with the threat of COVID-19 still stalking society. Data from the Centers for Disease Control and Prevention, however, indicate the threat is diminishing in many parts of the country, but it is still cause for concern in certain areas.
The seven-day moving average of hospital admissions across the country continued moving downward. According to the CDC, there were 16,186 admissions for the week ending Oct. 21, down 0.2% from the previous period. Test positivity was 8.7% for the week ending Oct. 21, down 0.7%. (These are states where the most people are living with long COVID.)
To determine the states where the COVID-19 surge is the worst right now, 24/7 Tempo reviewed data on recent COVID-19 hospital admissions from the Centers for Disease Control and Prevention. States were ranked based on the number of new hospital admissions due to COVID-19 per 100,000 state residents for the week of Oct. 15-21, 2023. Supplemental data on the total number of recorded COVID-19 hospital admissions since Aug. 1, 2020; the total number of deaths due to COVID-19 since January 2020; and the COVID-19 test positivity rate for the week of Oct. 15-21, 2023, also came from the CDC.
Four of the five states with the highest weekly COVID-19 hospital admissions per 100,000 people this week — Montana, West Virginia, New York, and Massachusetts — were also among the top five the previous week. Rates in Montana and West Virginia increased significantly, while those in New York and Massachusetts declined from the previous week.
Four of the five states with the lowest weekly COVID-19 hospital admissions were from the South — Mississippi, Georgia, Louisiana, and Tennessee — and had admissions rates of 3.4 or below. The state with the lowest admissions rate was Alaska at 2.0, down from 4.1 a week prior.
As was the case in the prior reporting period, the states with the highest test-positivity rates in the nation were the same: the Far West states of Montana, Colorado, North and South Dakota, Utah, and Wyoming, all at 14.0 and down from 14.4. Like the previous week, the Mid-Atlantic states of Delaware, Maryland, Virginia, Pennsylvania, and West Virginia all recorded the lowest test-positivity rates, though the rate for all ticked up to 5.7 from 4.8.

50. Alaska
> New weekly COVID-19 hospital admissions, Oct. 15-21, 2023: 2.0 per 100,000 (15 total)
> COVID-19 hospital admissions since Aug. 1, 2020: 1,348.9 per 100,000 (7th lowest)
> COVID-19 deaths since Jan. 2020: 209.2 per 100,000 (5th lowest)
> Current COVID-19 test positivity rate: 8.8% (23rd highest)

49. Mississippi
> New weekly COVID-19 hospital admissions, Oct. 15-21, 2023: 2.6 per 100,000 (77 total)
> COVID-19 hospital admissions since Aug. 1, 2020: 1,918.6 per 100,000 (25th highest)
> COVID-19 deaths since Jan. 2020: 509.0 per 100,000 (the highest)
> Current COVID-19 test positivity rate: 6.6% (13th lowest)

48. Georgia
> New weekly COVID-19 hospital admissions, Oct. 15-21, 2023: 2.7 per 100,000 (291 total)
> COVID-19 hospital admissions since Aug. 1, 2020: 2,217.4 per 100,000 (9th highest)
> COVID-19 deaths since Jan. 2020: 334.0 per 100,000 (20th lowest)
> Current COVID-19 test positivity rate: 6.6% (13th lowest)
47. Louisiana
> New weekly COVID-19 hospital admissions, Oct. 15-21, 2023: 3.1 per 100,000 (144 total)
> COVID-19 hospital admissions since Aug. 1, 2020: 2,116.1 per 100,000 (13th highest)
> COVID-19 deaths since Jan. 2020: 387.5 per 100,000 (14th highest)
> Current COVID-19 test positivity rate: 7.2% (24th lowest)

46. Tennessee
> New weekly COVID-19 hospital admissions, Oct. 15-21, 2023: 3.4 per 100,000 (243 total)
> COVID-19 hospital admissions since Aug. 1, 2020: 1,878.0 per 100,000 (24th lowest)
> COVID-19 deaths since Jan. 2020: 410.6 per 100,000 (10th highest)
> Current COVID-19 test positivity rate: 6.6% (13th lowest)

45. Texas
> New weekly COVID-19 hospital admissions, Oct. 15-21, 2023: 3.6 per 100,000 (1,090 total)
> COVID-19 hospital admissions since Aug. 1, 2020: 2,056.6 per 100,000 (17th highest)
> COVID-19 deaths since Jan. 2020: 342.6 per 100,000 (24th lowest)
> Current COVID-19 test positivity rate: 7.2% (24th lowest)

44. Washington
> New weekly COVID-19 hospital admissions, Oct. 15-21, 2023: 3.8 per 100,000 (298 total)
> COVID-19 hospital admissions since Aug. 1, 2020: 1,012.8 per 100,000 (2nd lowest)
> COVID-19 deaths since Jan. 2020: 196.0 per 100,000 (4th lowest)
> Current COVID-19 test positivity rate: 8.8% (23rd highest)

43. Utah
> New weekly COVID-19 hospital admissions, Oct. 15-21, 2023: 3.8 per 100,000 (130 total)
> COVID-19 hospital admissions since Aug. 1, 2020: 1,413.7 per 100,000 (10th lowest)
> COVID-19 deaths since Jan. 2020: 164.5 per 100,000 (3rd lowest)
> Current COVID-19 test positivity rate: 14.0% (the highest)
42. South Carolina
> New weekly COVID-19 hospital admissions, Oct. 15-21, 2023: 3.9 per 100,000 (206 total)
> COVID-19 hospital admissions since Aug. 1, 2020: 1,829.2 per 100,000 (21st lowest)
> COVID-19 deaths since Jan. 2020: 406.6 per 100,000 (12th highest)
> Current COVID-19 test positivity rate: 6.6% (13th lowest)

41. North Carolina
> New weekly COVID-19 hospital admissions, Oct. 15-21, 2023: 4.0 per 100,000 (425 total)
> COVID-19 hospital admissions since Aug. 1, 2020: 1,602.3 per 100,000 (16th lowest)
> COVID-19 deaths since Jan. 2020: 320.2 per 100,000 (18th lowest)
> Current COVID-19 test positivity rate: 6.6% (13th lowest)

40. Maine
> New weekly COVID-19 hospital admissions, Oct. 15-21, 2023: 4.0 per 100,000 (56 total)
> COVID-19 hospital admissions since Aug. 1, 2020: 1,115.2 per 100,000 (3rd lowest)
> COVID-19 deaths since Jan. 2020: 240.3 per 100,000 (8th lowest)
> Current COVID-19 test positivity rate: 7.2% (24th lowest)

39. Florida
> New weekly COVID-19 hospital admissions, Oct. 15-21, 2023: 4.2 per 100,000 (934 total)
> COVID-19 hospital admissions since Aug. 1, 2020: 2,603.1 per 100,000 (4th highest)
> COVID-19 deaths since Jan. 2020: 363.6 per 100,000 (22nd highest)
> Current COVID-19 test positivity rate: 6.6% (13th lowest)

38. Arkansas
> New weekly COVID-19 hospital admissions, Oct. 15-21, 2023: 4.2 per 100,000 (128 total)
> COVID-19 hospital admissions since Aug. 1, 2020: 2,247.7 per 100,000 (7th highest)
> COVID-19 deaths since Jan. 2020: 415.5 per 100,000 (9th highest)
> Current COVID-19 test positivity rate: 7.2% (24th lowest)

37. Hawaii
> New weekly COVID-19 hospital admissions, Oct. 15-21, 2023: 4.2 per 100,000 (61 total)
> COVID-19 hospital admissions since Aug. 1, 2020: 1,397.1 per 100,000 (8th lowest)
> COVID-19 deaths since Jan. 2020: 139.4 per 100,000 (the lowest)
> Current COVID-19 test positivity rate: 11.0% (11th highest)

36. Ohio
> New weekly COVID-19 hospital admissions, Oct. 15-21, 2023: 4.3 per 100,000 (504 total)
> COVID-19 hospital admissions since Aug. 1, 2020: 2,246.6 per 100,000 (8th highest)
> COVID-19 deaths since Jan. 2020: 426.1 per 100,000 (7th highest)
> Current COVID-19 test positivity rate: 9.2% (15th highest)
35. Oklahoma
> New weekly COVID-19 hospital admissions, Oct. 15-21, 2023: 4.4 per 100,000 (175 total)
> COVID-19 hospital admissions since Aug. 1, 2020: 2,762.3 per 100,000 (2nd highest)
> COVID-19 deaths since Jan. 2020: 489.2 per 100,000 (3rd highest)
> Current COVID-19 test positivity rate: 7.2% (24th lowest)
34. Nebraska
> New weekly COVID-19 hospital admissions, Oct. 15-21, 2023: 4.4 per 100,000 (87 total)
> COVID-19 hospital admissions since Aug. 1, 2020: 1,626.3 per 100,000 (17th lowest)
> COVID-19 deaths since Jan. 2020: 294.8 per 100,000 (15th lowest)
> Current COVID-19 test positivity rate: 11.1% (7th highest)

33. Alabama
> New weekly COVID-19 hospital admissions, Oct. 15-21, 2023: 4.5 per 100,000 (229 total)
> COVID-19 hospital admissions since Aug. 1, 2020: 2,378.9 per 100,000 (6th highest)
> COVID-19 deaths since Jan. 2020: 443.9 per 100,000 (6th highest)
> Current COVID-19 test positivity rate: 6.6% (13th lowest)
32. Delaware
> New weekly COVID-19 hospital admissions, Oct. 15-21, 2023: 4.5 per 100,000 (46 total)
> COVID-19 hospital admissions since Aug. 1, 2020: 2,008.4 per 100,000 (18th highest)
> COVID-19 deaths since Jan. 2020: 342.6 per 100,000 (23rd lowest)
> Current COVID-19 test positivity rate: 5.7% (5th lowest)

31. Maryland
> New weekly COVID-19 hospital admissions, Oct. 15-21, 2023: 4.6 per 100,000 (286 total)
> COVID-19 hospital admissions since Aug. 1, 2020: 1,585.3 per 100,000 (14th lowest)
> COVID-19 deaths since Jan. 2020: 296.6 per 100,000 (16th lowest)
> Current COVID-19 test positivity rate: 5.7% (5th lowest)

30. California
> New weekly COVID-19 hospital admissions, Oct. 15-21, 2023: 4.7 per 100,000 (1,832 total)
> COVID-19 hospital admissions since Aug. 1, 2020: 1,594.3 per 100,000 (15th lowest)
> COVID-19 deaths since Jan. 2020: 281.2 per 100,000 (12th lowest)
> Current COVID-19 test positivity rate: 11.0% (11th highest)

29. Illinois
> New weekly COVID-19 hospital admissions, Oct. 15-21, 2023: 4.7 per 100,000 (595 total)
> COVID-19 hospital admissions since Aug. 1, 2020: 1,850.8 per 100,000 (23rd lowest)
> COVID-19 deaths since Jan. 2020: 322.6 per 100,000 (19th lowest)
> Current COVID-19 test positivity rate: 9.2% (15th highest)

28. Missouri
> New weekly COVID-19 hospital admissions, Oct. 15-21, 2023: 4.9 per 100,000 (300 total)
> COVID-19 hospital admissions since Aug. 1, 2020: 2,148.3 per 100,000 (12th highest)
> COVID-19 deaths since Jan. 2020: 366.7 per 100,000 (21st highest)
> Current COVID-19 test positivity rate: 11.1% (7th highest)

27. Michigan
> New weekly COVID-19 hospital admissions, Oct. 15-21, 2023: 4.9 per 100,000 (492 total)
> COVID-19 hospital admissions since Aug. 1, 2020: 1,949.2 per 100,000 (23rd highest)
> COVID-19 deaths since Jan. 2020: 378.6 per 100,000 (17th highest)
> Current COVID-19 test positivity rate: 9.2% (15th highest)

26. Rhode Island
> New weekly COVID-19 hospital admissions, Oct. 15-21, 2023: 4.9 per 100,000 (54 total)
> COVID-19 hospital admissions since Aug. 1, 2020: 1,234.9 per 100,000 (5th lowest)
> COVID-19 deaths since Jan. 2020: 366.8 per 100,000 (20th highest)
> Current COVID-19 test positivity rate: 7.2% (24th lowest)

25. Minnesota
> New weekly COVID-19 hospital admissions, Oct. 15-21, 2023: 5.0 per 100,000 (284 total)
> COVID-19 hospital admissions since Aug. 1, 2020: 1,405.8 per 100,000 (9th lowest)
> COVID-19 deaths since Jan. 2020: 274.4 per 100,000 (10th lowest)
> Current COVID-19 test positivity rate: 9.2% (15th highest)

24. Wyoming
> New weekly COVID-19 hospital admissions, Oct. 15-21, 2023: 5.0 per 100,000 (29 total)
> COVID-19 hospital admissions since Aug. 1, 2020: 1,990.8 per 100,000 (19th highest)
> COVID-19 deaths since Jan. 2020: 371.7 per 100,000 (19th highest)
> Current COVID-19 test positivity rate: 14.0% (the highest)

23. Kentucky
> New weekly COVID-19 hospital admissions, Oct. 15-21, 2023: 5.1 per 100,000 (231 total)
> COVID-19 hospital admissions since Aug. 1, 2020: 3,487.4 per 100,000 (the highest)
> COVID-19 deaths since Jan. 2020: 447.4 per 100,000 (4th highest)
> Current COVID-19 test positivity rate: 6.6% (13th lowest)
22. Iowa
> New weekly COVID-19 hospital admissions, Oct. 15-21, 2023: 5.2 per 100,000 (167 total)
> COVID-19 hospital admissions since Aug. 1, 2020: 1,724.1 per 100,000 (19th lowest)
> COVID-19 deaths since Jan. 2020: 349.8 per 100,000 (25th highest)
> Current COVID-19 test positivity rate: 11.1% (7th highest)

21. Oregon
> New weekly COVID-19 hospital admissions, Oct. 15-21, 2023: 5.2 per 100,000 (222 total)
> COVID-19 hospital admissions since Aug. 1, 2020: 1,128.9 per 100,000 (4th lowest)
> COVID-19 deaths since Jan. 2020: 222.1 per 100,000 (6th lowest)
> Current COVID-19 test positivity rate: 8.8% (23rd highest)

20. Virginia
> New weekly COVID-19 hospital admissions, Oct. 15-21, 2023: 5.2 per 100,000 (455 total)
> COVID-19 hospital admissions since Aug. 1, 2020: 1,428.9 per 100,000 (11th lowest)
> COVID-19 deaths since Jan. 2020: 274.4 per 100,000 (11th lowest)
> Current COVID-19 test positivity rate: 5.7% (5th lowest)

19. Nevada
> New weekly COVID-19 hospital admissions, Oct. 15-21, 2023: 5.3 per 100,000 (170 total)
> COVID-19 hospital admissions since Aug. 1, 2020: 2,059.9 per 100,000 (16th highest)
> COVID-19 deaths since Jan. 2020: 376.0 per 100,000 (18th highest)
> Current COVID-19 test positivity rate: 11.0% (11th highest)
18. New Jersey
> New weekly COVID-19 hospital admissions, Oct. 15-21, 2023: 5.4 per 100,000 (503 total)
> COVID-19 hospital admissions since Aug. 1, 2020: 1,899.1 per 100,000 (25th lowest)
> COVID-19 deaths since Jan. 2020: 383.8 per 100,000 (15th highest)
> Current COVID-19 test positivity rate: 9.0% (21st highest)
17. New Hampshire
> New weekly COVID-19 hospital admissions, Oct. 15-21, 2023: 5.4 per 100,000 (76 total)
> COVID-19 hospital admissions since Aug. 1, 2020: 1,338.0 per 100,000 (6th lowest)
> COVID-19 deaths since Jan. 2020: 238.7 per 100,000 (7th lowest)
> Current COVID-19 test positivity rate: 7.2% (24th lowest)
16. Idaho
> New weekly COVID-19 hospital admissions, Oct. 15-21, 2023: 5.6 per 100,000 (109 total)
> COVID-19 hospital admissions since Aug. 1, 2020: 1,461.1 per 100,000 (12th lowest)
> COVID-19 deaths since Jan. 2020: 286.3 per 100,000 (13th lowest)
> Current COVID-19 test positivity rate: 8.8% (23rd highest)

15. Indiana
> New weekly COVID-19 hospital admissions, Oct. 15-21, 2023: 5.6 per 100,000 (386 total)
> COVID-19 hospital admissions since Aug. 1, 2020: 2,065.7 per 100,000 (15th highest)
> COVID-19 deaths since Jan. 2020: 382.5 per 100,000 (16th highest)
> Current COVID-19 test positivity rate: 9.2% (15th highest)

14. Wisconsin
> New weekly COVID-19 hospital admissions, Oct. 15-21, 2023: 5.7 per 100,000 (336 total)
> COVID-19 hospital admissions since Aug. 1, 2020: 2,176.8 per 100,000 (10th highest)
> COVID-19 deaths since Jan. 2020: 293.0 per 100,000 (14th lowest)
> Current COVID-19 test positivity rate: 9.2% (15th highest)

13. New Mexico
> New weekly COVID-19 hospital admissions, Oct. 15-21, 2023: 5.7 per 100,000 (121 total)
> COVID-19 hospital admissions since Aug. 1, 2020: 1,838.3 per 100,000 (22nd lowest)
> COVID-19 deaths since Jan. 2020: 444.1 per 100,000 (5th highest)
> Current COVID-19 test positivity rate: 7.2% (24th lowest)
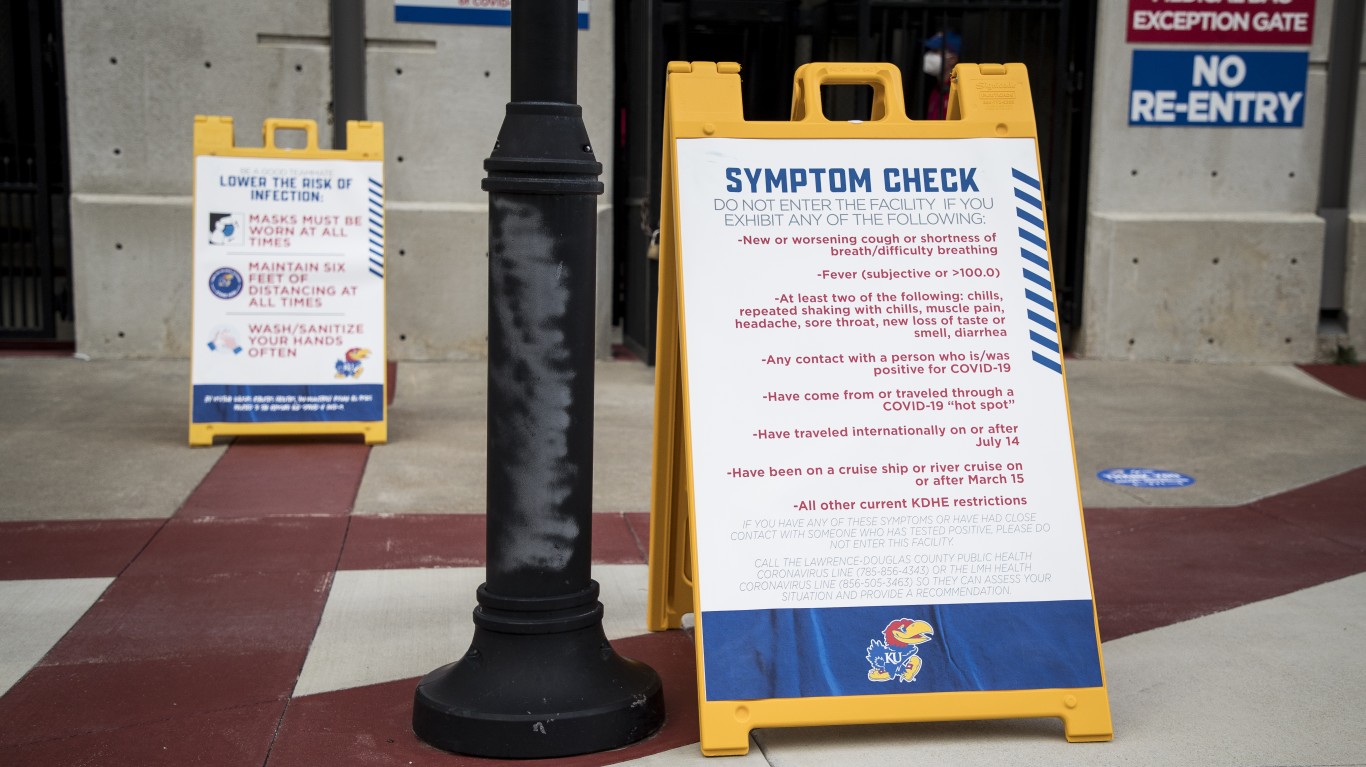
12. Kansas
> New weekly COVID-19 hospital admissions, Oct. 15-21, 2023: 5.8 per 100,000 (169 total)
> COVID-19 hospital admissions since Aug. 1, 2020: 1,968.6 per 100,000 (20th highest)
> COVID-19 deaths since Jan. 2020: 362.7 per 100,000 (24th highest)
> Current COVID-19 test positivity rate: 11.1% (7th highest)

11. Pennsylvania
> New weekly COVID-19 hospital admissions, Oct. 15-21, 2023: 5.8 per 100,000 (747 total)
> COVID-19 hospital admissions since Aug. 1, 2020: 1,921.6 per 100,000 (24th highest)
> COVID-19 deaths since Jan. 2020: 409.5 per 100,000 (11th highest)
> Current COVID-19 test positivity rate: 5.7% (5th lowest)
10. North Dakota
> New weekly COVID-19 hospital admissions, Oct. 15-21, 2023: 5.8 per 100,000 (45 total)
> COVID-19 hospital admissions since Aug. 1, 2020: 1,963.3 per 100,000 (21st highest)
> COVID-19 deaths since Jan. 2020: 340.2 per 100,000 (21st lowest)
> Current COVID-19 test positivity rate: 14.0% (the highest)
9. Connecticut
> New weekly COVID-19 hospital admissions, Oct. 15-21, 2023: 6.0 per 100,000 (216 total)
> COVID-19 hospital admissions since Aug. 1, 2020: 1,824.8 per 100,000 (20th lowest)
> COVID-19 deaths since Jan. 2020: 341.9 per 100,000 (22nd lowest)
> Current COVID-19 test positivity rate: 7.2% (24th lowest)

8. Vermont
> New weekly COVID-19 hospital admissions, Oct. 15-21, 2023: 6.2 per 100,000 (40 total)
> COVID-19 hospital admissions since Aug. 1, 2020: 1,005.8 per 100,000 (the lowest)
> COVID-19 deaths since Jan. 2020: 162.1 per 100,000 (2nd lowest)
> Current COVID-19 test positivity rate: 7.2% (24th lowest)

7. Arizona
> New weekly COVID-19 hospital admissions, Oct. 15-21, 2023: 6.3 per 100,000 (461 total)
> COVID-19 hospital admissions since Aug. 1, 2020: 2,114.6 per 100,000 (14th highest)
> COVID-19 deaths since Jan. 2020: 405.7 per 100,000 (13th highest)
> Current COVID-19 test positivity rate: 11.0% (11th highest)

6. South Dakota
> New weekly COVID-19 hospital admissions, Oct. 15-21, 2023: 6.3 per 100,000 (57 total)
> COVID-19 hospital admissions since Aug. 1, 2020: 2,150.1 per 100,000 (11th highest)
> COVID-19 deaths since Jan. 2020: 362.8 per 100,000 (23rd highest)
> Current COVID-19 test positivity rate: 14.0% (the highest)

5. Massachusetts
> New weekly COVID-19 hospital admissions, Oct. 15-21, 2023: 6.6 per 100,000 (463 total)
> COVID-19 hospital admissions since Aug. 1, 2020: 1,531.7 per 100,000 (13th lowest)
> COVID-19 deaths since Jan. 2020: 303.2 per 100,000 (17th lowest)
> Current COVID-19 test positivity rate: 7.2% (24th lowest)

4. New York
> New weekly COVID-19 hospital admissions, Oct. 15-21, 2023: 6.9 per 100,000 (1,367 total)
> COVID-19 hospital admissions since Aug. 1, 2020: 1,959.3 per 100,000 (22nd highest)
> COVID-19 deaths since Jan. 2020: 415.8 per 100,000 (8th highest)
> Current COVID-19 test positivity rate: 9.0% (21st highest)
3. Colorado
> New weekly COVID-19 hospital admissions, Oct. 15-21, 2023: 7.4 per 100,000 (435 total)
> COVID-19 hospital admissions since Aug. 1, 2020: 1,693.9 per 100,000 (18th lowest)
> COVID-19 deaths since Jan. 2020: 258.3 per 100,000 (9th lowest)
> Current COVID-19 test positivity rate: 14.0% (the highest)
2. West Virginia
> New weekly COVID-19 hospital admissions, Oct. 15-21, 2023: 8.3 per 100,000 (148 total)
> COVID-19 hospital admissions since Aug. 1, 2020: 2,440.1 per 100,000 (5th highest)
> COVID-19 deaths since Jan. 2020: 491.8 per 100,000 (2nd highest)
> Current COVID-19 test positivity rate: 5.7% (5th lowest)

1. Montana
> New weekly COVID-19 hospital admissions, Oct. 15-21, 2023: 9.5 per 100,000 (107 total)
> COVID-19 hospital admissions since Aug. 1, 2020: 2,731.0 per 100,000 (3rd highest)
> COVID-19 deaths since Jan. 2020: 347.5 per 100,000 (25th lowest)
> Current COVID-19 test positivity rate: 14.0% (the highest)
It’s Your Money, Your Future—Own It (sponsor)
Are you ahead, or behind on retirement? For families with more than $500,000 saved for retirement, finding a financial advisor who puts your interest first can be the difference, and today it’s easier than ever. SmartAsset’s free tool matches you with up to three fiduciary financial advisors who serve your area in minutes. Each advisor has been carefully vetted and must act in your best interests. Start your search now.
If you’ve saved and built a substantial nest egg for you and your family, don’t delay; get started right here and help your retirement dreams become a retirement reality.
Thank you for reading! Have some feedback for us?
Contact the 24/7 Wall St. editorial team.
