The 10th Amendment to the U.S. Constitution confers all powers not specifically reserved for the federal government – such as the ability to declare war or regulate money – to the states. With broad authority to establish laws, each state has a unique regulatory environment. These differences, in addition to other fundamental variations related to climate, geography, and history, manifest themselves in ways that have a meaningful impact on everyday life.
Indeed, no two states are exactly alike. Economic conditions, access to services, both essential and otherwise, and overall quality of life vary from state to state – and some parts of the country offer a much higher standard of living than others. (Here is a look at the best countries to move to.)
Using data from sources including the U.S. Census Bureau, the FBI, the Department of Agriculture, and the Bureau of Labor Statistics, 24/7 Wall St. created a weighted index of 20 measures to determine the best – and worst – states to live in. States are ordered from worst to best. The measures used to create this ranking include unemployment, crime, poverty, tax rates, health outcomes, and access to things like healthy food, entertainment, and places for exercise.
Based on a weighted score of these and other key measures, there are some notable geographic patterns. Most of the lowest-ranking states, for example, are located in the South, while many of the best states to live are clustered in the West.
Generally, the highest ranking states on this list tend to have low crime rates, thriving economies, and relatively financially secure populations. Residents of these states are also typically more likely to have easy access to quality health care, public parks and recreation facilities, as well as to entertainment and cultural attractions such as bars, restaurants, theaters, and museums.
It is important to note that even the lowest-ranking states on this list often have several positive attributes. For example, while many of the Southern states do not compare favorably to much of the rest of the country – often due to higher crime and poverty rates – they also offer several advantages, including a warmer climate, a low cost of living, relatively inexpensive housing, and low tax rates. (Here is a look at the 31 poorest states in America.)
Here are the best and worst states to live in.

50. Mississippi
> Median home value: $133,000 (2nd lowest)
> Median household income: $49,111 (the lowest)
> Population with access to exercise opportunities: 57.5% (the lowest)
> Recreational establishments: 38.5 per 10,000 businesses (20th lowest)
> Total population: 2,967,023 (17th lowest)

49. Louisiana
> Median home value: $174,000 (13th lowest)
> Median household income: $53,571 (4th lowest)
> Population with access to exercise opportunities: 75.8% (20th lowest)
> Recreational establishments: 26.8 per 10,000 businesses (5th lowest)
> Total population: 4,657,305 (25th highest)

48. West Virginia
> Median home value: $128,800 (the lowest)
> Median household income: $50,884 (2nd lowest)
> Population with access to exercise opportunities: 57.8% (2nd lowest)
> Recreational establishments: 40.8 per 10,000 businesses (25th highest)
> Total population: 1,801,049 (12th lowest)

47. New Mexico
> Median home value: $184,800 (16th lowest)
> Median household income: $54,020 (5th lowest)
> Population with access to exercise opportunities: 74.3% (14th lowest)
> Recreational establishments: 35.3 per 10,000 businesses (16th lowest)
> Total population: 2,109,366 (15th lowest)
46. Arkansas
> Median home value: $142,100 (3rd lowest)
> Median household income: $52,123 (3rd lowest)
> Population with access to exercise opportunities: 63.0% (4th lowest)
> Recreational establishments: 41.4 per 10,000 businesses (23rd highest)
> Total population: 3,006,309 (18th lowest)

45. Alabama
> Median home value: $157,100 (6th lowest)
> Median household income: $54,943 (6th lowest)
> Population with access to exercise opportunities: 60.9% (3rd lowest)
> Recreational establishments: 33.3 per 10,000 businesses (12th lowest)
> Total population: 4,997,675 (24th highest)

44. Oklahoma
> Median home value: $150,800 (4th lowest)
> Median household income: $56,956 (8th lowest)
> Population with access to exercise opportunities: 71.3% (11th lowest)
> Recreational establishments: 34.7 per 10,000 businesses (14th lowest)
> Total population: 3,948,136 (23rd lowest)

43. Kentucky
> Median home value: $155,100 (5th lowest)
> Median household income: $55,454 (7th lowest)
> Population with access to exercise opportunities: 69.9% (7th lowest)
> Recreational establishments: 39.6 per 10,000 businesses (23rd lowest)
> Total population: 4,494,141 (25th lowest)

42. Tennessee
> Median home value: $193,700 (18th lowest)
> Median household income: $58,516 (10th lowest)
> Population with access to exercise opportunities: 67.6% (6th lowest)
> Recreational establishments: 39.0 per 10,000 businesses (22nd lowest)
> Total population: 6,859,497 (16th highest)
41. South Carolina
> Median home value: $181,800 (15th lowest)
> Median household income: $58,234 (9th lowest)
> Population with access to exercise opportunities: 70.3% (8th lowest)
> Recreational establishments: 42.7 per 10,000 businesses (21st highest)
> Total population: 5,078,903 (23rd highest)

40. Georgia
> Median home value: $206,700 (23rd lowest)
> Median household income: $65,030 (22nd lowest)
> Population with access to exercise opportunities: 74.6% (16th lowest)
> Recreational establishments: 26.4 per 10,000 businesses (4th lowest)
> Total population: 10,625,615 (8th highest)

39. Missouri
> Median home value: $171,800 (11th lowest)
> Median household income: $61,043 (13th lowest)
> Population with access to exercise opportunities: 75.8% (19th lowest)
> Recreational establishments: 41.5 per 10,000 businesses (22nd highest)
> Total population: 6,141,534 (19th highest)

38. North Carolina
> Median home value: $197,500 (20th lowest)
> Median household income: $60,516 (11th lowest)
> Population with access to exercise opportunities: 74.5% (15th lowest)
> Recreational establishments: 35.1 per 10,000 businesses (15th lowest)
> Total population: 10,367,022 (9th highest)

37. Michigan
> Median home value: $172,100 (12th lowest)
> Median household income: $63,202 (18th lowest)
> Population with access to exercise opportunities: 85.2% (18th highest)
> Recreational establishments: 51.8 per 10,000 businesses (16th highest)
> Total population: 10,062,512 (10th highest)

36. Texas
> Median home value: $202,600 (22nd lowest)
> Median household income: $67,321 (23rd highest)
> Population with access to exercise opportunities: 81.7% (25th highest)
> Recreational establishments: 27.8 per 10,000 businesses (7th lowest)
> Total population: 28,862,581 (2nd highest)

35. Indiana
> Median home value: $158,500 (7th lowest)
> Median household income: $61,944 (16th lowest)
> Population with access to exercise opportunities: 76.8% (21st lowest)
> Recreational establishments: 39.9 per 10,000 businesses (24th lowest)
> Total population: 6,751,340 (17th highest)

34. Ohio
> Median home value: $159,900 (8th lowest)
> Median household income: $61,938 (15th lowest)
> Population with access to exercise opportunities: 83.8% (21st highest)
> Recreational establishments: 40.8 per 10,000 businesses (25th lowest)
> Total population: 11,769,923 (7th highest)

33. Florida
> Median home value: $248,700 (22nd highest)
> Median household income: $61,777 (14th lowest)
> Population with access to exercise opportunities: 88.2% (12th highest)
> Recreational establishments: 32.1 per 10,000 businesses (9th lowest)
> Total population: 21,339,762 (3rd highest)

32. Illinois
> Median home value: $212,600 (25th highest)
> Median household income: $72,563 (17th highest)
> Population with access to exercise opportunities: 90.4% (11th highest)
> Recreational establishments: 32.9 per 10,000 businesses (11th lowest)
> Total population: 12,821,813 (6th highest)

31. Alaska
> Median home value: $282,800 (16th highest)
> Median household income: $80,287 (10th highest)
> Population with access to exercise opportunities: 75.7% (18th lowest)
> Recreational establishments: 50.8 per 10,000 businesses (17th highest)
> Total population: 735,951 (3rd lowest)

30. Delaware
> Median home value: $269,700 (17th highest)
> Median household income: $72,724 (16th highest)
> Population with access to exercise opportunities: 81.3% (25th lowest)
> Recreational establishments: 41.3 per 10,000 businesses (24th highest)
> Total population: 981,892 (6th lowest)

29. Kansas
> Median home value: $164,800 (10th lowest)
> Median household income: $64,521 (21st lowest)
> Population with access to exercise opportunities: 79.7% (24th lowest)
> Recreational establishments: 56.5 per 10,000 businesses (10th highest)
> Total population: 2,932,099 (16th lowest)

28. Arizona
> Median home value: $265,600 (19th highest)
> Median household income: $65,913 (25th lowest)
> Population with access to exercise opportunities: 86.2% (14th highest)
> Recreational establishments: 32.5 per 10,000 businesses (10th lowest)
> Total population: 7,079,203 (14th highest)

27. Pennsylvania
> Median home value: $197,300 (19th lowest)
> Median household income: $67,587 (22nd highest)
> Population with access to exercise opportunities: 85.8% (17th highest)
> Recreational establishments: 52.7 per 10,000 businesses (14th highest)
> Total population: 12,970,650 (5th highest)
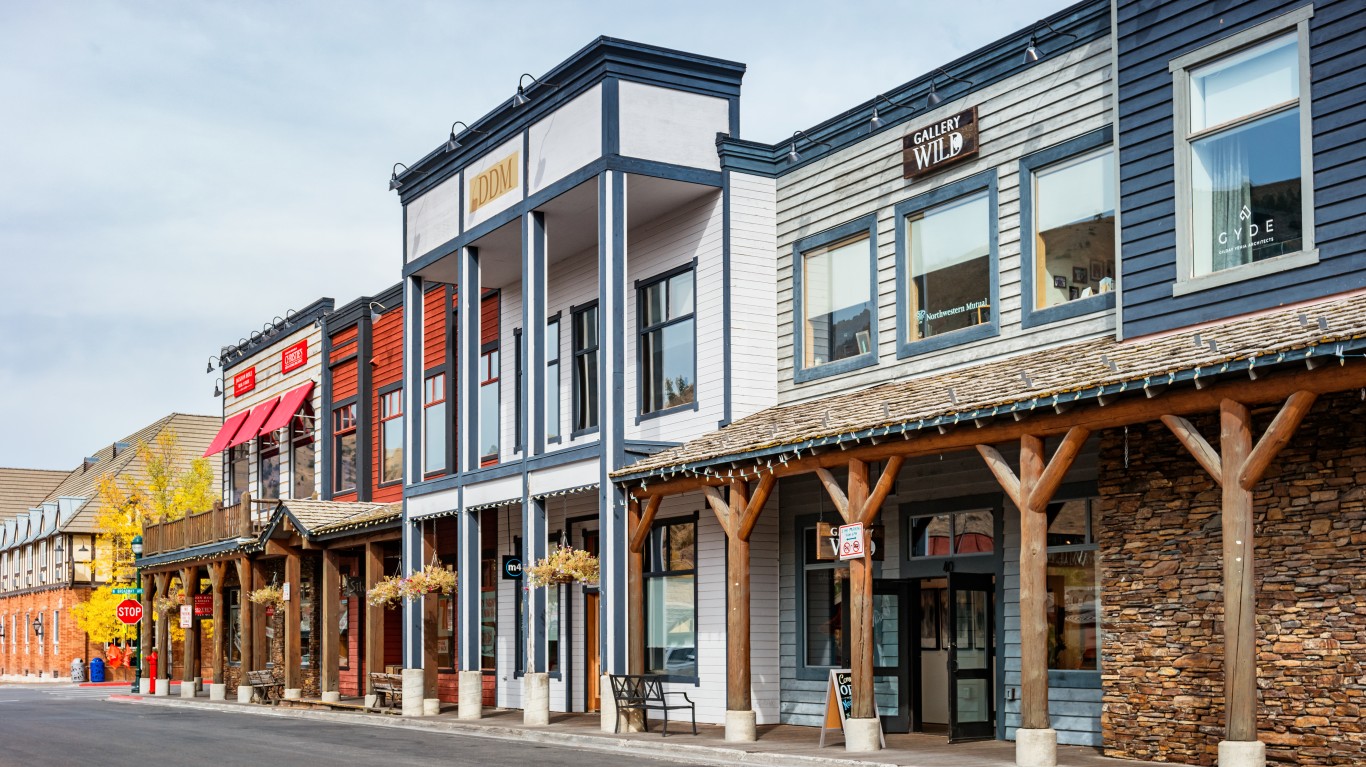
26. Wyoming
> Median home value: $237,900 (24th highest)
> Median household income: $68,002 (20th highest)
> Population with access to exercise opportunities: 77.5% (22nd lowest)
> Recreational establishments: 49.8 per 10,000 businesses (18th highest)
> Total population: 576,641 (the lowest)

25. Nevada
> Median home value: $315,900 (11th highest)
> Median household income: $65,686 (24th lowest)
> Population with access to exercise opportunities: 91.5% (9th highest)
> Recreational establishments: 26.8 per 10,000 businesses (6th lowest)
> Total population: 3,059,238 (19th lowest)

24. Connecticut
> Median home value: $286,700 (15th highest)
> Median household income: $83,572 (6th highest)
> Population with access to exercise opportunities: 93.5% (6th highest)
> Recreational establishments: 63.8 per 10,000 businesses (6th highest)
> Total population: 3,605,330 (22nd lowest)

23. Iowa
> Median home value: $160,700 (9th lowest)
> Median household income: $65,429 (23rd lowest)
> Population with access to exercise opportunities: 79.3% (23rd lowest)
> Recreational establishments: 66.9 per 10,000 businesses (5th highest)
> Total population: 3,179,090 (20th lowest)

22. North Dakota
> Median home value: $209,900 (24th lowest)
> Median household income: $68,131 (19th highest)
> Population with access to exercise opportunities: 72.5% (12th lowest)
> Recreational establishments: 57.2 per 10,000 businesses (9th highest)
> Total population: 773,344 (4th lowest)
21. Rhode Island
> Median home value: $292,600 (13th highest)
> Median household income: $74,489 (15th highest)
> Population with access to exercise opportunities: 95.5% (2nd highest)
> Recreational establishments: 74.5 per 10,000 businesses (3rd highest)
> Total population: 1,091,949 (8th lowest)
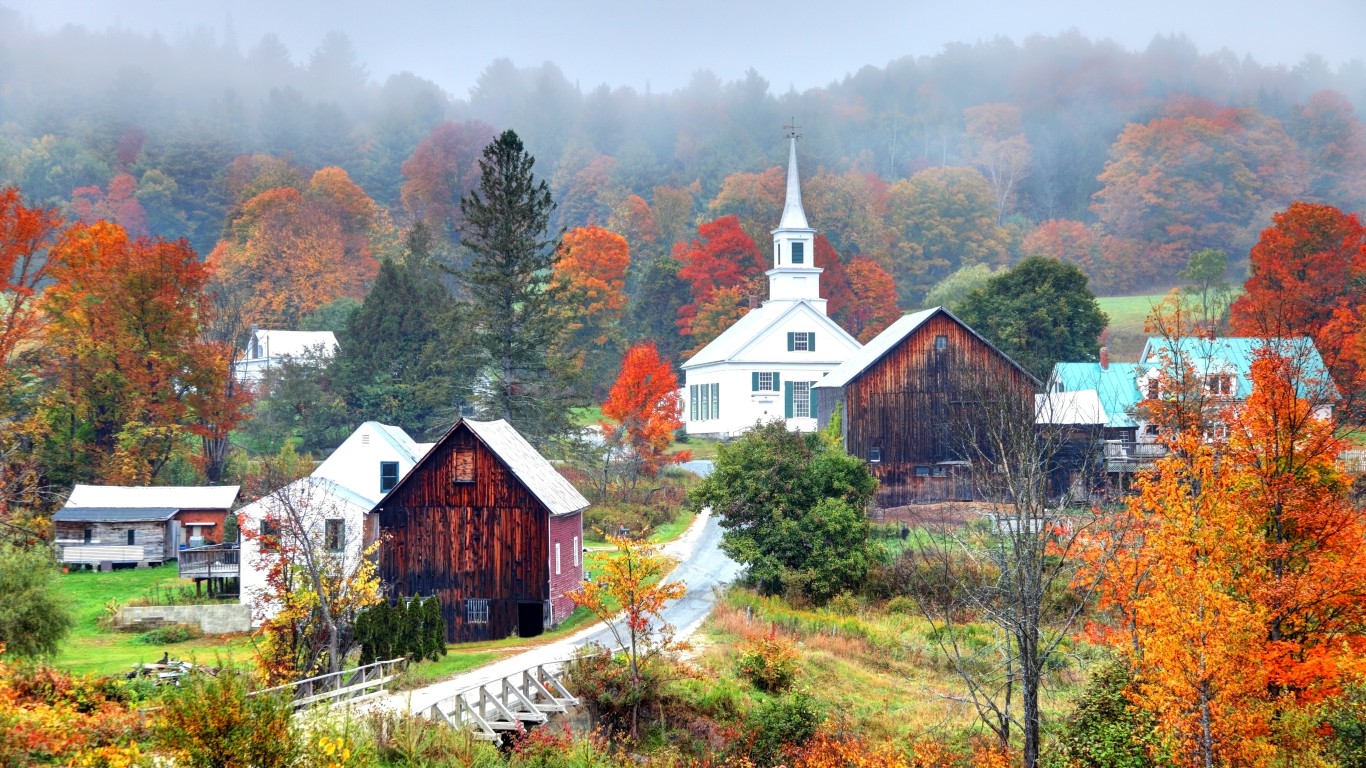
20. Vermont
> Median home value: $240,600 (23rd highest)
> Median household income: $67,674 (21st highest)
> Population with access to exercise opportunities: 70.6% (10th lowest)
> Recreational establishments: 96.6 per 10,000 businesses (2nd highest)
> Total population: 641,637 (2nd lowest)

19. Nebraska
> Median home value: $174,100 (14th lowest)
> Median household income: $66,644 (25th highest)
> Population with access to exercise opportunities: 83.1% (24th highest)
> Recreational establishments: 53.1 per 10,000 businesses (13th highest)
> Total population: 1,951,480 (14th lowest)
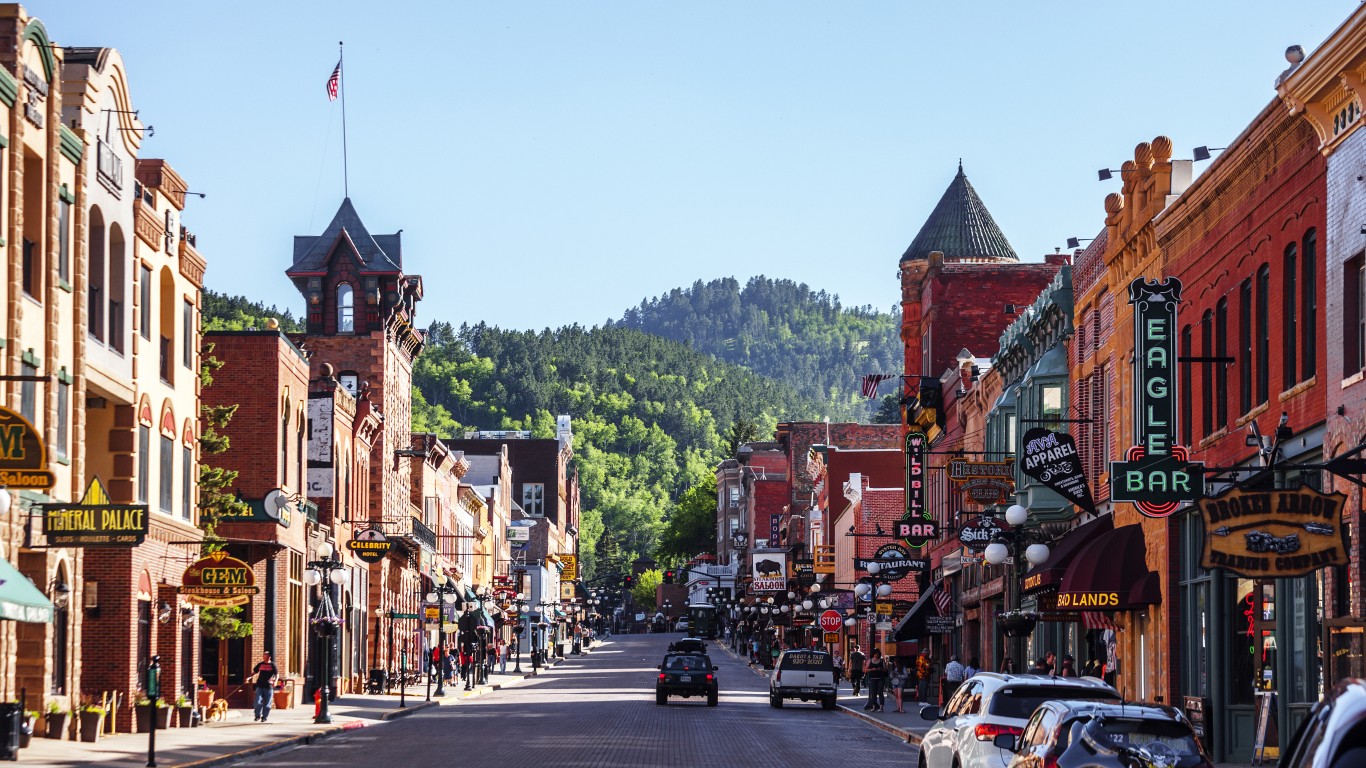
18. South Dakota
> Median home value: $187,800 (17th lowest)
> Median household income: $63,920 (20th lowest)
> Population with access to exercise opportunities: 70.6% (9th lowest)
> Recreational establishments: 70.5 per 10,000 businesses (4th highest)
> Total population: 881,785 (5th lowest)

17. New Jersey
> Median home value: $355,700 (7th highest)
> Median household income: $89,703 (2nd highest)
> Population with access to exercise opportunities: 96.1% (the highest)
> Recreational establishments: 30.0 per 10,000 businesses (8th lowest)
> Total population: 9,234,024 (11th highest)

16. California
> Median home value: $573,200 (2nd highest)
> Median household income: $84,097 (5th highest)
> Population with access to exercise opportunities: 94.6% (4th highest)
> Recreational establishments: 26.3 per 10,000 businesses (3rd lowest)
> Total population: 39,455,353 (the highest)

15. Maryland
> Median home value: $338,500 (10th highest)
> Median household income: $91,431 (the highest)
> Population with access to exercise opportunities: 92.1% (8th highest)
> Recreational establishments: 37.7 per 10,000 businesses (19th lowest)
> Total population: 6,148,545 (18th highest)

14. Virginia
> Median home value: $295,500 (12th highest)
> Median household income: $80,615 (9th highest)
> Population with access to exercise opportunities: 83.4% (23rd highest)
> Recreational establishments: 35.4 per 10,000 businesses (17th lowest)
> Total population: 8,582,479 (12th highest)

13. Maine
> Median home value: $212,100 (25th lowest)
> Median household income: $63,182 (17th lowest)
> Population with access to exercise opportunities: 65.7% (5th lowest)
> Recreational establishments: 102.3 per 10,000 businesses (the highest)
> Total population: 1,357,046 (9th lowest)

12. New Hampshire
> Median home value: $288,700 (14th highest)
> Median household income: $83,449 (7th highest)
> Population with access to exercise opportunities: 84.2% (20th highest)
> Recreational establishments: 60.8 per 10,000 businesses (7th highest)
> Total population: 1,372,175 (10th lowest)

11. New York
> Median home value: $340,600 (8th highest)
> Median household income: $75,157 (14th highest)
> Population with access to exercise opportunities: 93.2% (7th highest)
> Recreational establishments: 58.3 per 10,000 businesses (8th highest)
> Total population: 20,114,745 (4th highest)

10. Montana
> Median home value: $263,700 (20th highest)
> Median household income: $60,560 (12th lowest)
> Population with access to exercise opportunities: 72.8% (13th lowest)
> Recreational establishments: 54.3 per 10,000 businesses (11th highest)
> Total population: 1,077,978 (7th lowest)
9. Wisconsin
> Median home value: $200,400 (21st lowest)
> Median household income: $67,080 (24th highest)
> Population with access to exercise opportunities: 83.5% (22nd highest)
> Recreational establishments: 54.2 per 10,000 businesses (12th highest)
> Total population: 5,871,661 (20th highest)

8. Utah
> Median home value: $339,700 (9th highest)
> Median household income: $79,133 (12th highest)
> Population with access to exercise opportunities: 84.2% (19th highest)
> Recreational establishments: 22.7 per 10,000 businesses (the lowest)
> Total population: 3,231,370 (21st lowest)
7. Minnesota
> Median home value: $250,200 (21st highest)
> Median household income: $77,706 (13th highest)
> Population with access to exercise opportunities: 86.0% (15th highest)
> Recreational establishments: 52.7 per 10,000 businesses (15th highest)
> Total population: 5,670,472 (22nd highest)

6. Idaho
> Median home value: $266,500 (18th highest)
> Median household income: $63,377 (19th lowest)
> Population with access to exercise opportunities: 74.7% (17th lowest)
> Recreational establishments: 38.8 per 10,000 businesses (21st lowest)
> Total population: 1,811,617 (13th lowest)

5. Massachusetts
> Median home value: $424,700 (3rd highest)
> Median household income: $89,026 (3rd highest)
> Population with access to exercise opportunities: 94.7% (3rd highest)
> Recreational establishments: 49.4 per 10,000 businesses (19th highest)
> Total population: 6,991,852 (15th highest)

4. Oregon
> Median home value: $362,200 (6th highest)
> Median household income: $70,084 (18th highest)
> Population with access to exercise opportunities: 87.9% (13th highest)
> Recreational establishments: 37.7 per 10,000 businesses (18th lowest)
> Total population: 4,207,177 (24th lowest)

3. Washington
> Median home value: $397,600 (4th highest)
> Median household income: $82,400 (8th highest)
> Population with access to exercise opportunities: 86.0% (16th highest)
> Recreational establishments: 34.0 per 10,000 businesses (13th lowest)
> Total population: 7,617,364 (13th highest)

2. Colorado
> Median home value: $397,500 (5th highest)
> Median household income: $80,184 (11th highest)
> Population with access to exercise opportunities: 90.4% (10th highest)
> Recreational establishments: 25.9 per 10,000 businesses (2nd lowest)
> Total population: 5,723,176 (21st highest)

1. Hawaii
> Median home value: $662,100 (the highest)
> Median household income: $88,005 (4th highest)
> Population with access to exercise opportunities: 93.7% (5th highest)
> Recreational establishments: 43.1 per 10,000 businesses (20th highest)
> Total population: 1,453,498 (11th lowest)
Methodology:
To identify the best and worst states to live in, 24/7 Wall St. created a weighted index of 20 measures across three categories: economy, quality of life, and community.
The economy category consists of seven measures:
- Employment growth from 2016 to 2021, included at full weight
- Annual unemployment rate, included at full weight
- Median household income, included at full weight
- Poverty rate, included at full weight
- Percentage of the population 25 years and over with bachelor’s degree or higher, included at full weight
- Median home value, included at full weight
- Median real estate taxes as percentage of median home value, included at full weight
The quality of life category consists of nine measures:
- Percentage of commuting workers 16 and over took public transportation, walked, or took other means to work, included at full weight
- Mean travel time to work, included at half-weight
- Average hospital 30-day readmission rate, included at half-weight
- Average hospital mortality rate for heart attack, CABG surgery, COPD, heart failure, neumonia, and stroke, included at half-weight
- Percentage of the population in urban census tracts at least 1 mile from a grocery store and in rural census tracts at least 10 miles from a grocery store, included at half-weight
- Annual crude drug-induced mortality rate per 100,000 residents, included at half-weight
- Rate of hospital stays for ambulatory-care sensitive conditions per 100,000 Medicare enrollees, included at half-weight
- Violent crimes per 100,000 residents, included at half-weight
- Property crimes per 100,000 residents, included at half-weight
The community category consists of four measures:
- Population with access to exercise opportunities, included at full weight
- Motion picture theaters (except drive-ins), libraries and archives, theater companies and dinner theaters, sports teams and clubs, museums, zoos and botanical gardens, nature parks and other similar institutions, golf courses and country clubs, and marinas per 10,000 establishments, included at full weight
- Drinking places (alcoholic beverages) per 10,000 establishments, included at full weight
- Restaurants and other eating places per 10,000 establishments, included at full weight
Data on population, employment, unemployment, median home value, median household income, median property taxes paid, commuter characteristics, average travel time to work, and poverty came from the U.S. Census Bureau’s American Community Survey and are five-year estimates for the period 2017 to 2021. Employment data used to calculate five-year employment growth are five-year estimates for the years 2012 to 2016.
Data on the share of the population in urban census tracts or areas at least 1 mile from a grocery store and in rural census tracts at least 10 miles from a grocery store, a measure of poor food access, came from the U.S. Department of Agriculture’s 2021 update to the Food Access Research Atlas.
Data on hospital locations came from the Centers for Medicare & Medicaid Services. Data on 30-day readmission rates and 30-day mortality rates also came from the Centers for Medicare & Medicaid Services and are for the period July 2019 to June 2022. Data was aggregated to the hospital level to the state level. Data on the number of drug-related deaths per 100,000 residents per year from the period 2019 to 2021 is from the Centers for Disease Control and Prevention. Data on preventable hospitalizations per 1,000 Medicare enrollees and the percentage of the population with access to exercise opportunities came from the 2023 County Health Rankings and Roadmaps program, a collaboration between the Robert Wood Johnson Foundation and University of Wisconsin Population Health Institute.
Data on the number of violent crimes and property crimes reported per 100,000 residents came from the FBI’s Uniform Crime Reporting Program and are for the year 2020.
Data on the number of motion picture theaters (except drive-ins), libraries and archives, theater companies and dinner theaters, sports teams and clubs, museums, zoos and botanical gardens, nature parks and other similar institutions, golf courses and country clubs, marinas, drinking places, and restaurants came from the Census Bureau’s 2021 County Business Patterns.
Thank you for reading! Have some feedback for us?
Contact the 24/7 Wall St. editorial team.

