The United States boasts the largest defense spending budget in the world, and this has been the case for decades now. The philosophy behind this foreign policy harkens back to President Theodore Roosevelt and his Big Stick policy. Projecting power, under control, has more or less represented the U.S. military doctrine and with this has come massive military spending over the years. (Here is how the world’s top military spenders compare to the U.S.)
To identify what the U.S. spent on the military the year you were born, 24/7 Wall St. reviewed data on U.S. military spending from the Stockholm International Peace Research Institute Military Expenditure Database, listing the years 1970-2022. Figures are in current U.S. dollars. We also calculated the percentage change in military spending from the previous year.
In 1970, during the height of the Vietnam War, the U.S. military budget had risen to more than $80 billion, a more than 50% increase from 1965, when the U.S. first sent troops into the Southeast Asian nation.
After the Vietnam War, expenditures continued to steadily increase, and by the early 1980s, military spending accelerated significantly. This surge came under President Ronald Reagan, practically tripling military expenditures of the Vietnam era.
In the years following the Cold War, during an era of relative peace, defense spending declined. The turning point was the terrorist attack of Sept. 11, 2001, after which the U.S. embarked on the War on Terror, again increasing defense expenditures significantly.
In the post 9/11 era, the Department of Defense budget peaked in 2011 around $750 billion due to large-scale operations in Iraq and Afghanistan. In the latter years of the Obama Administration, spending contracted moderately, reflecting gradual disengagement from the active battlefronts.
However, defense spending has continuously grown since 2016 under the Trump administration, reaching fresh highs in 2020 and continuing even higher under the current Biden Administration, mostly in response to Russia’s invasion of Ukraine and the aid provided to Ukraine. (Also see which countries are sending the most aid to Ukraine.)
Click here to see what the US spent on the military every year since 1970.

1970: $83.41 billion
> Increase from previous year: -1.86% – #43 largest Increase on list
[in-text-ad]

1971: $78.24 billion
> Increase from previous year: -6.20% – #51 largest Increase on list

1972: $80.71 billion
> Increase from previous year: 3.16% – #29 largest Increase on list

1973: $81.47 billion
> Increase from previous year: 0.94% – #40 largest Increase on list
[in-text-ad-2]

1974: $89.28 billion
> Increase from previous year: 9.59% – #12 largest Increase on list

1975: $92.08 billion
> Increase from previous year: 3.14% – #30 largest Increase on list
[in-text-ad]

1976: $94.72 billion
> Increase from previous year: 2.87% – #32 largest Increase on list

1977: $104.67 billion
> Increase from previous year: 10.50% – #10 largest Increase on list

1978: $113.38 billion
> Increase from previous year: 8.32% – #16 largest Increase on list
[in-text-ad-2]

1979: $126.88 billion
> Increase from previous year: 11.91% – #6 largest Increase on list

1980: $143.69 billion
> Increase from previous year: 13.25% – #5 largest Increase on list
[in-text-ad]
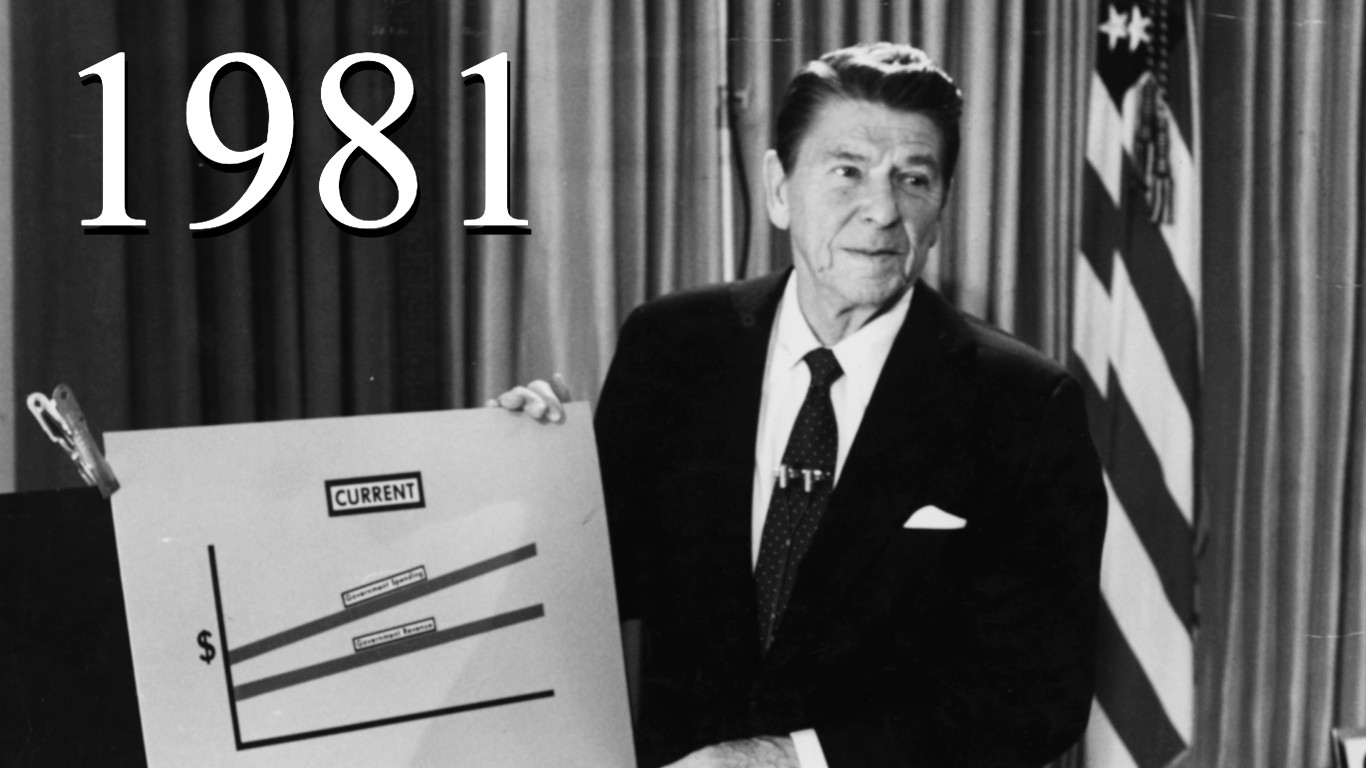
1981: $176.56 billion
> Increase from previous year: 22.88% – #2 largest Increase on list
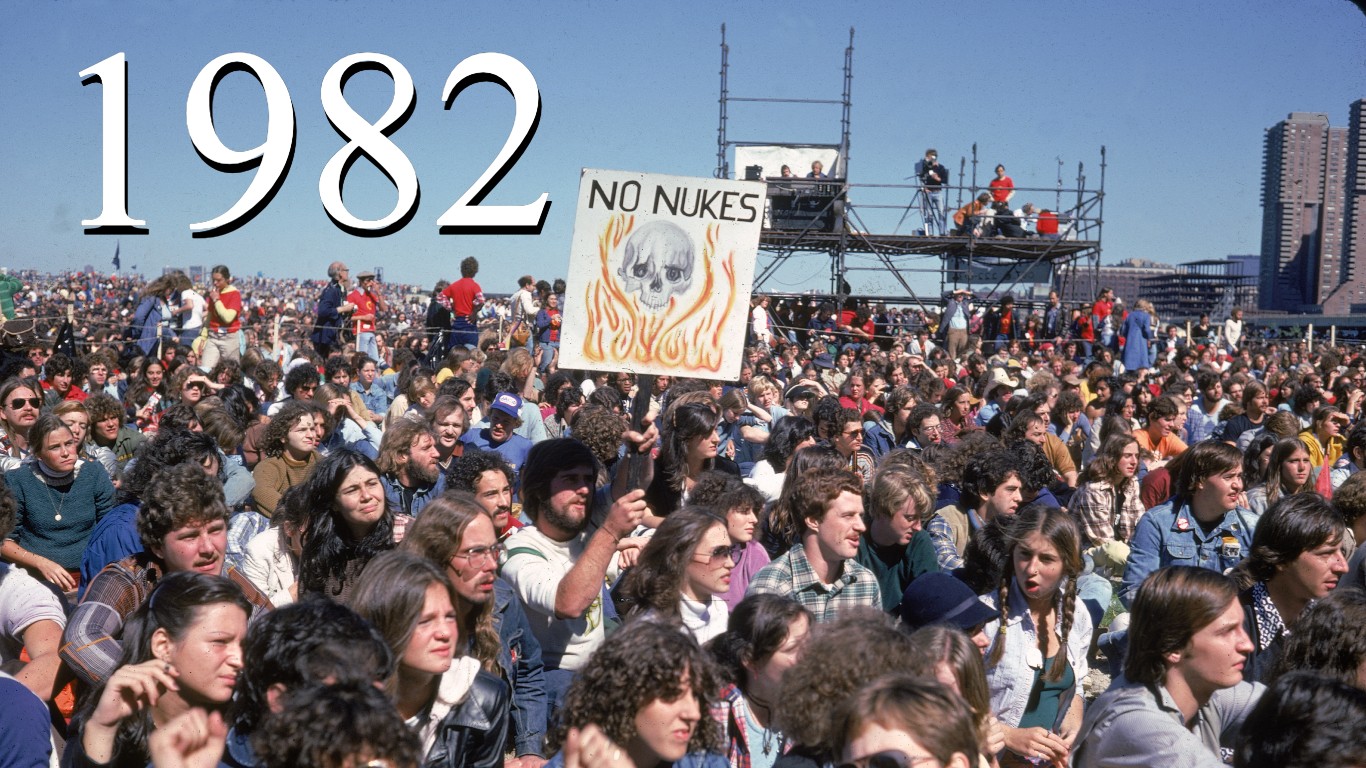
1982: $221.67 billion
> Increase from previous year: 25.55% – #1 largest Increase on list

1983: $223.43 billion
> Increase from previous year: 0.79% – #41 largest Increase on list
[in-text-ad-2]

1984: $245.15 billion
> Increase from previous year: 9.72% – #11 largest Increase on list

1985: $272.16 billion
> Increase from previous year: 11.02% – #9 largest Increase on list
[in-text-ad]

1986: $295.55 billion
> Increase from previous year: 8.59% – #14 largest Increase on list

1987: $304.09 billion
> Increase from previous year: 2.89% – #31 largest Increase on list

1988: $309.66 billion
> Increase from previous year: 1.83% – #35 largest Increase on list
[in-text-ad-2]

1989: $321.87 billion
> Increase from previous year: 3.94% – #26 largest Increase on list
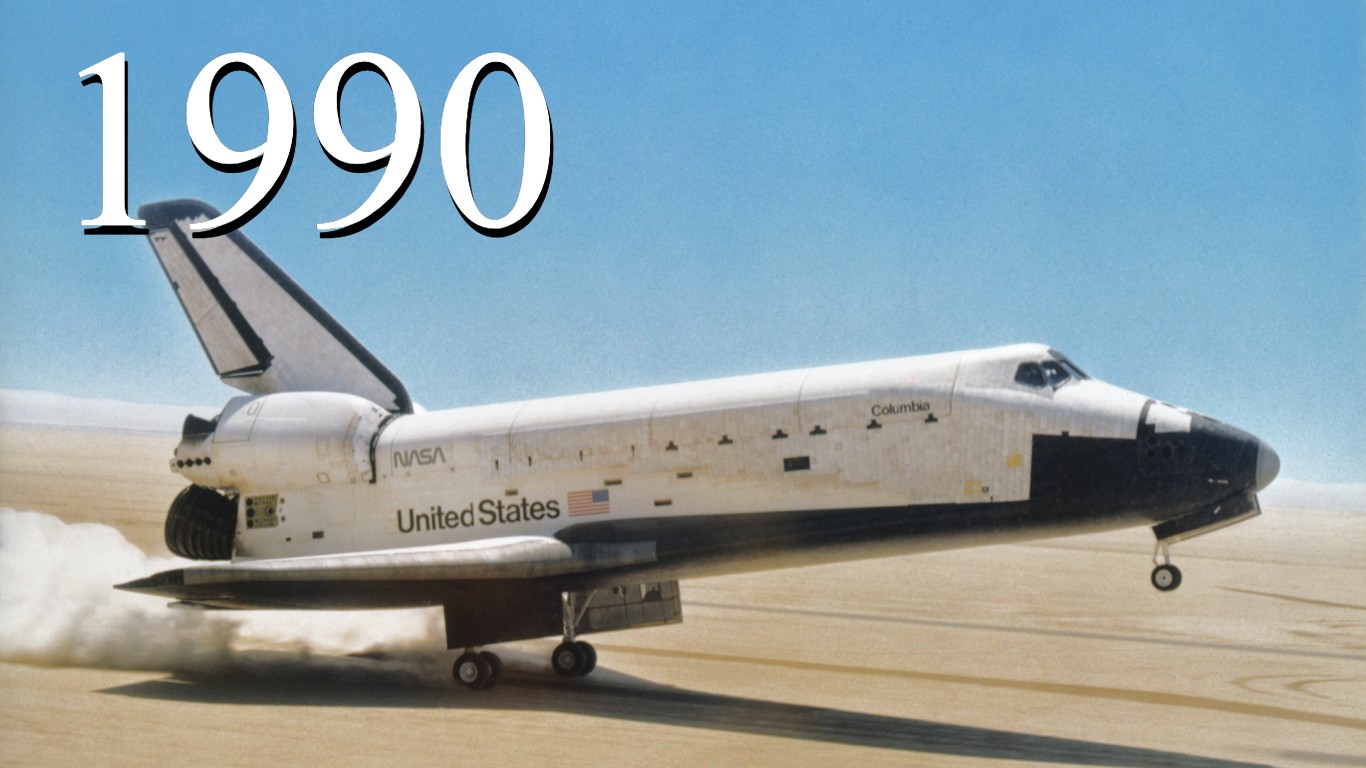
1990: $325.13 billion
> Increase from previous year: 1.01% – #38 largest Increase on list
[in-text-ad]
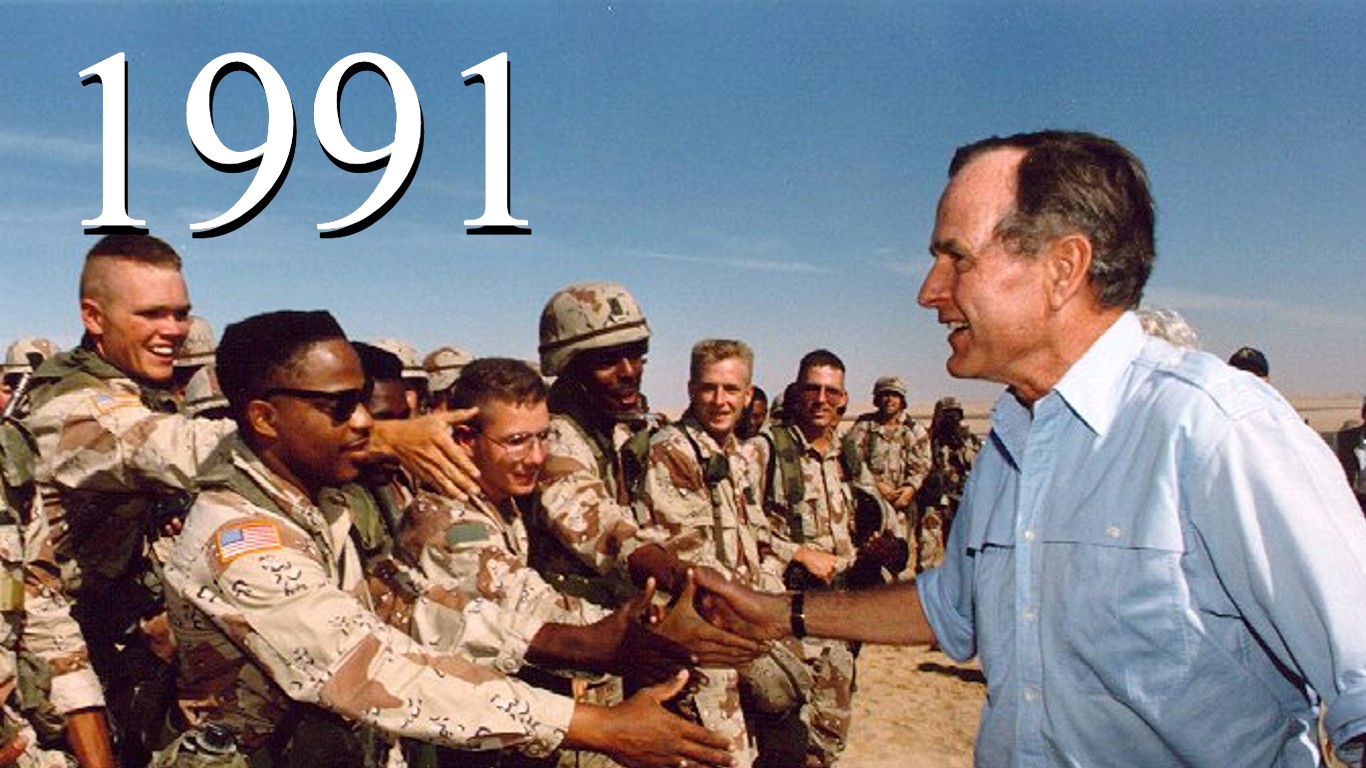
1991: $299.37 billion
> Increase from previous year: -7.92% – #53 largest increase on list
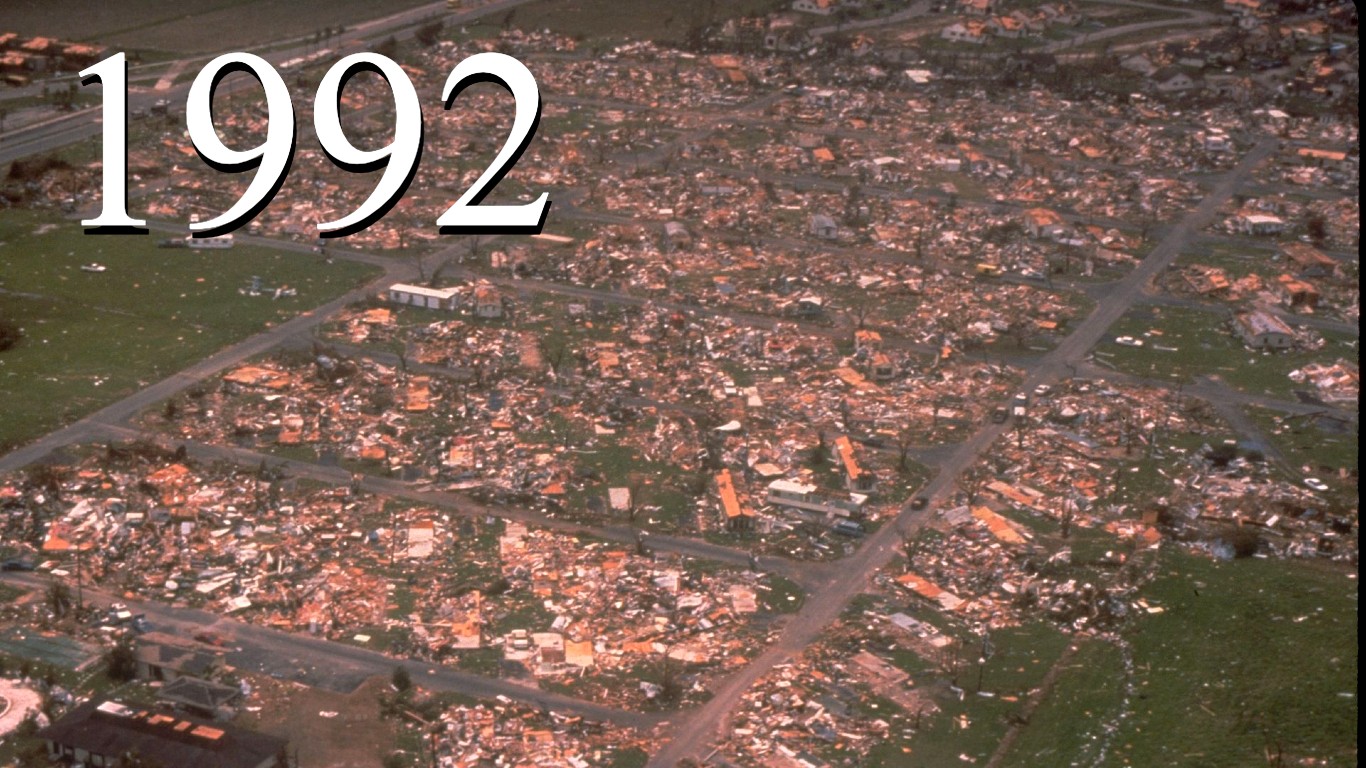
1992: $325.03 billion
> Increase from previous year: 8.57% – #15 largest Increase on list

1993: $316.72 billion
> Increase from previous year: -2.56% – #45 largest Increase on list
[in-text-ad-2]

1994: $308.08 billion
> Increase from previous year: -2.73% – #47 largest Increase on list

1995: $295.85 billion
> Increase from previous year: -3.97% – #49 largest Increase on list
[in-text-ad]

1996: $287.96 billion
> Increase from previous year: -2.67% – #46 largest Increase on list

1997: $293.17 billion
> Increase from previous year: 1.81% – #36 largest Increase on list

1998: $291.00 billion
> Increase from previous year: -0.74% – #42 largest Increase on list
[in-text-ad-2]
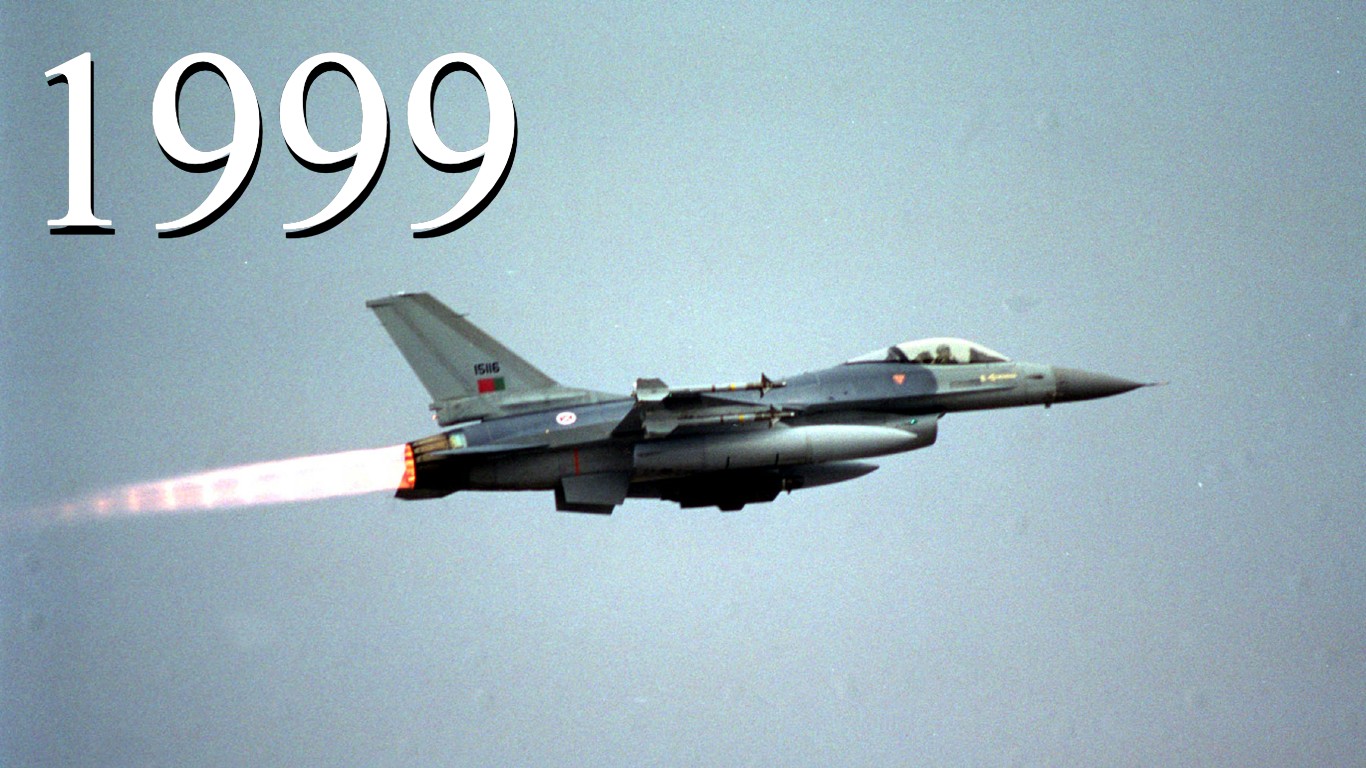
1999: $298.09 billion
> Increase from previous year: 2.44% – #33 largest Increase on list

2000: $320.09 billion
> Increase from previous year: 7.38% – #20 largest Increase on list
[in-text-ad]
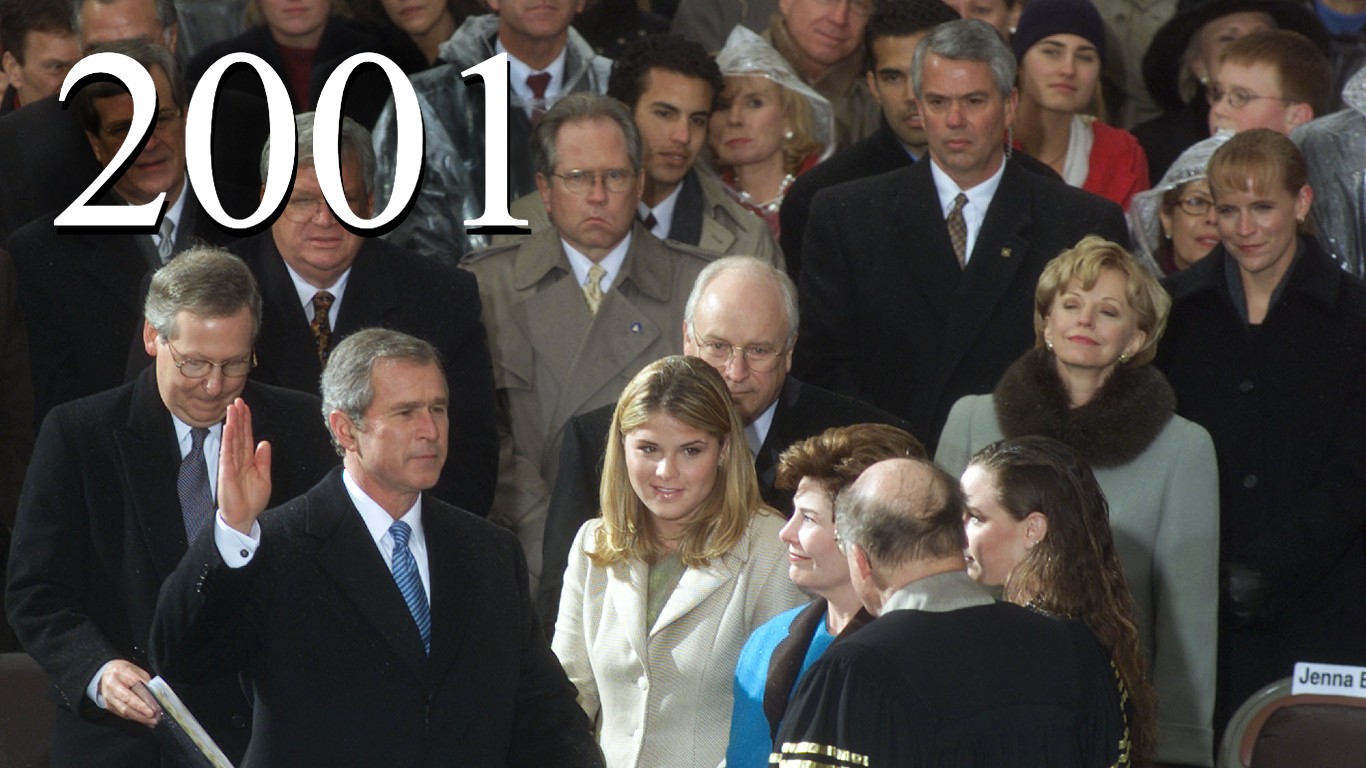
2001: $331.81 billion
> Increase from previous year: 3.66% – #27 largest Increase on list
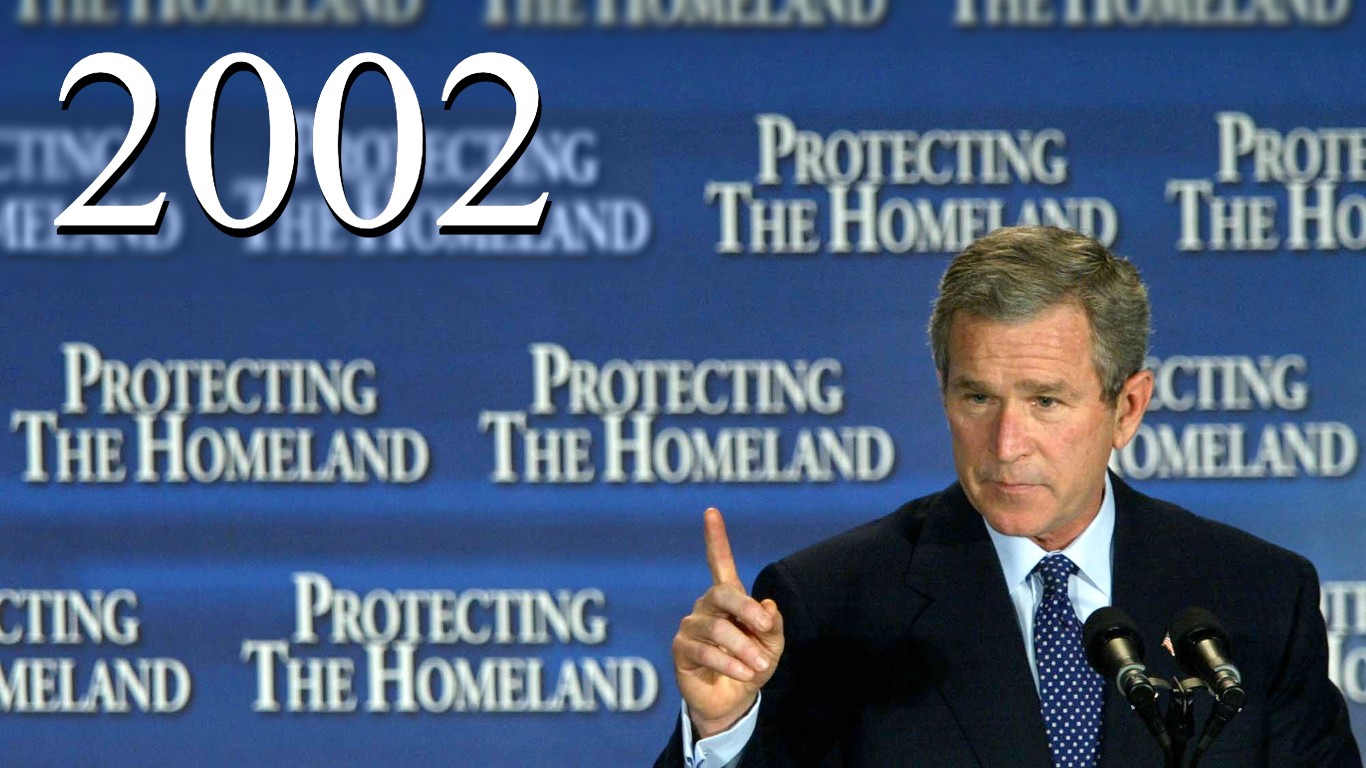
2002: $378.46 billion
> Increase from previous year: 14.06% – #4 largest Increase on list
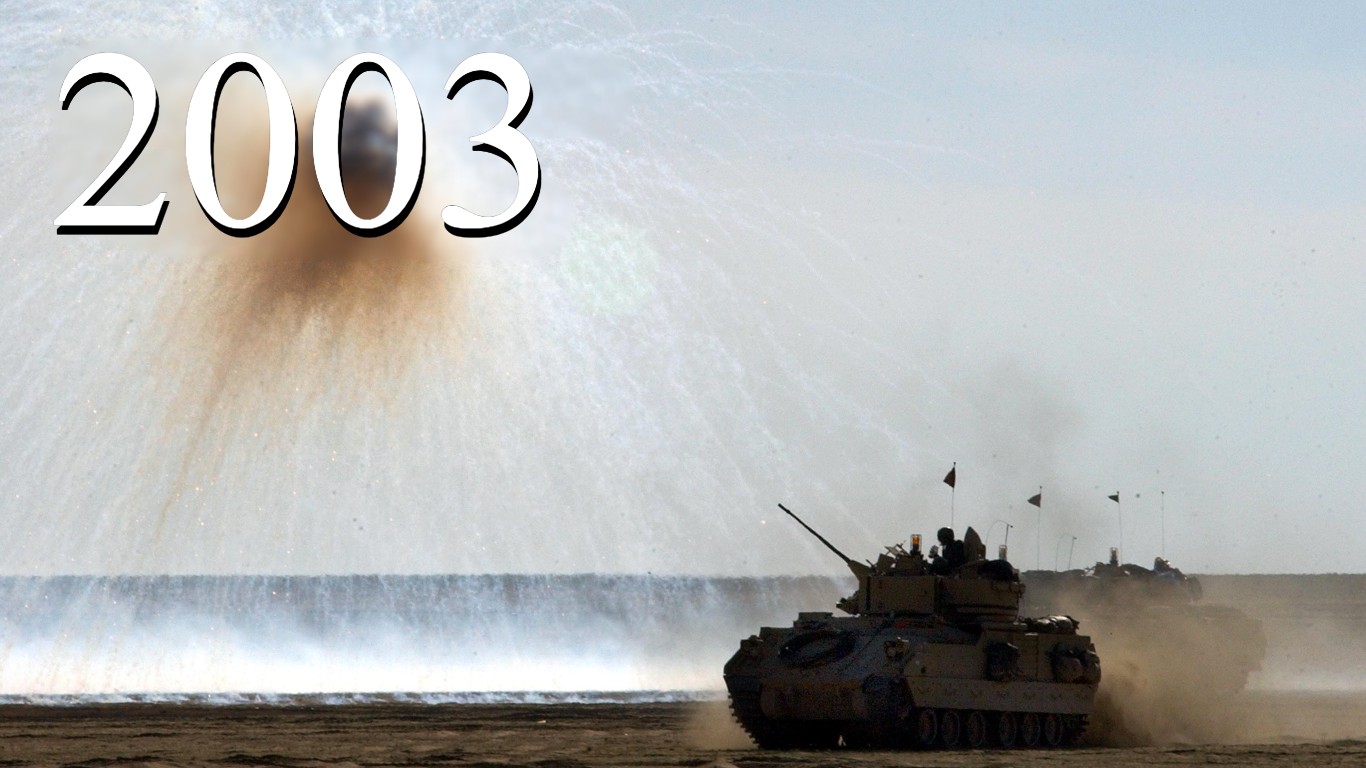
2003: $440.53 billion
> Increase from previous year: 16.40% – #3 largest Increase on list
[in-text-ad-2]

2004: $493.00 billion
> Increase from previous year: 11.91% – #7 largest Increase on list
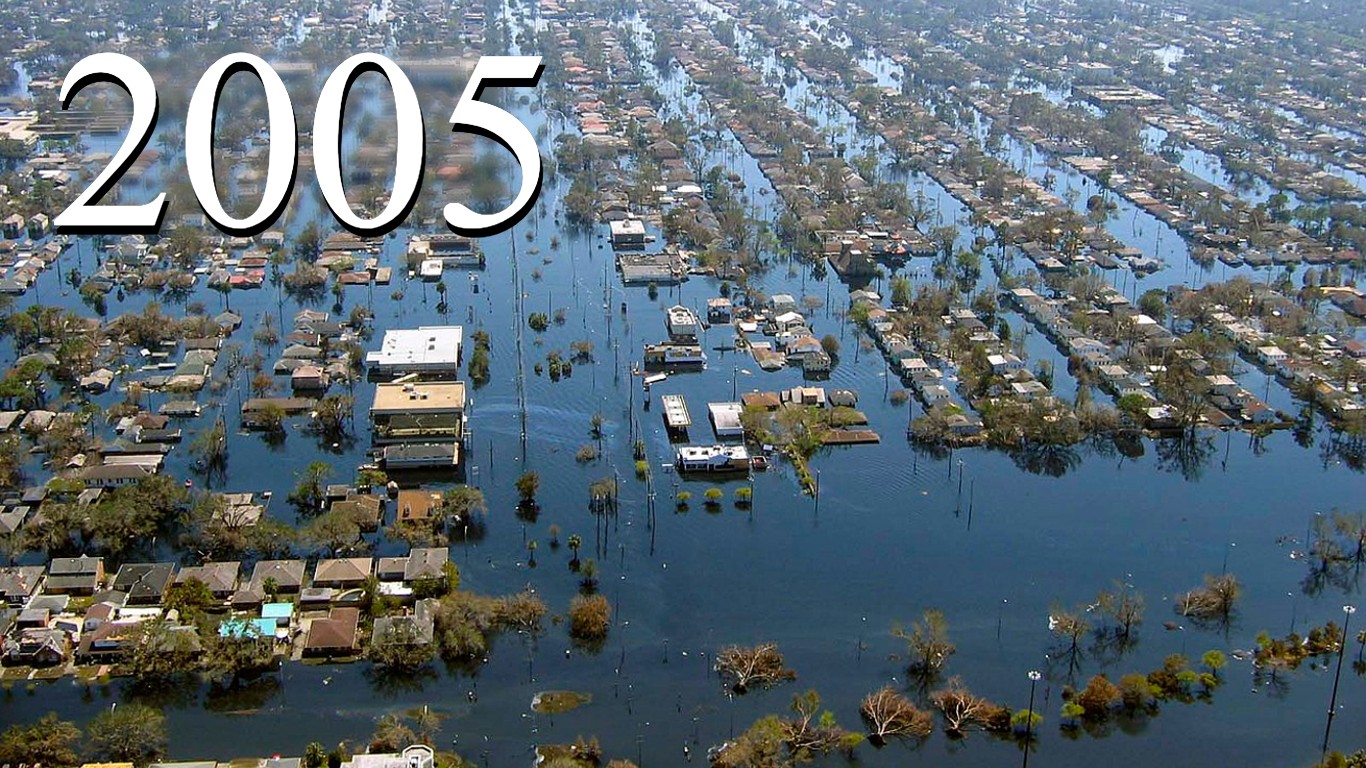
2005: $533.20 billion
> Increase from previous year: 8.15% – #17 largest Increase on list
[in-text-ad]

2006: $558.34 billion
> Increase from previous year: 4.71% – #24 largest Increase on list
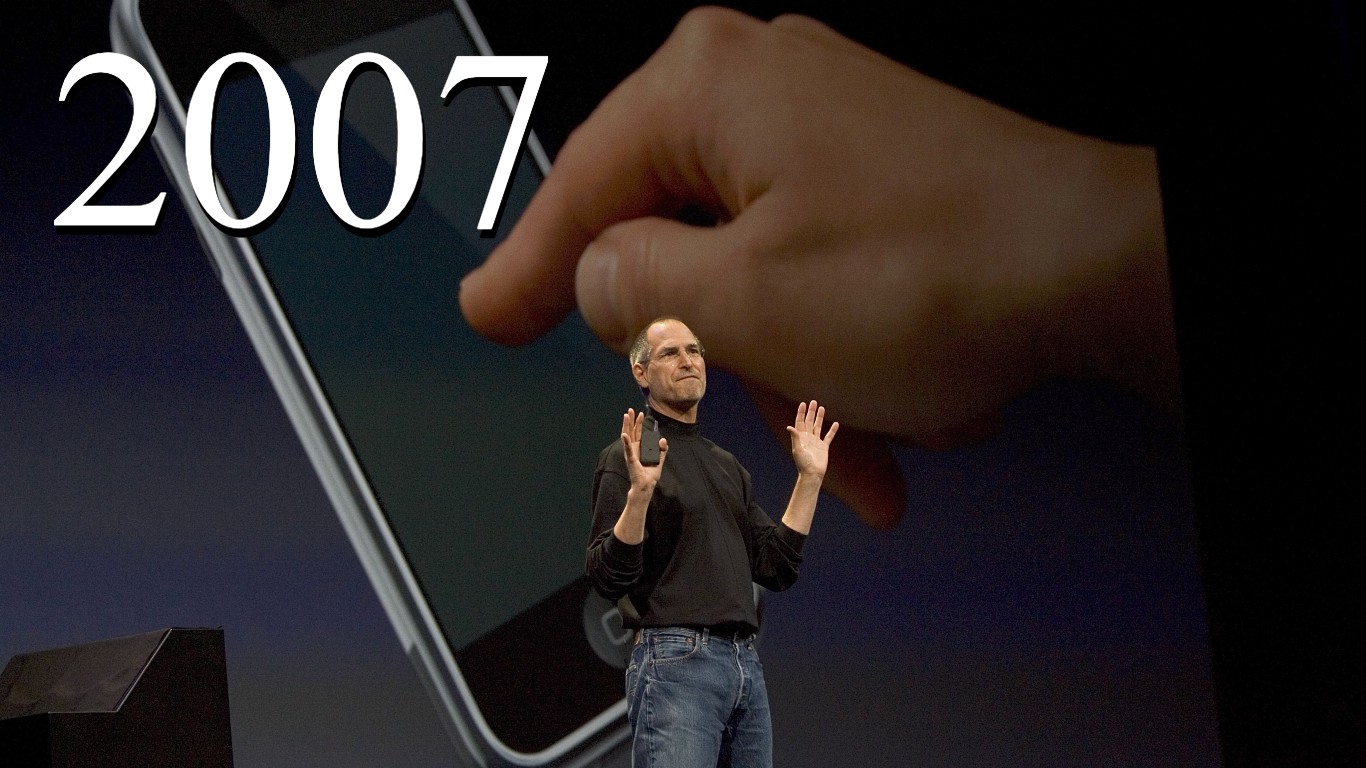
2007: $589.59 billion
> Increase from previous year: 5.60% – #22 largest Increase on list
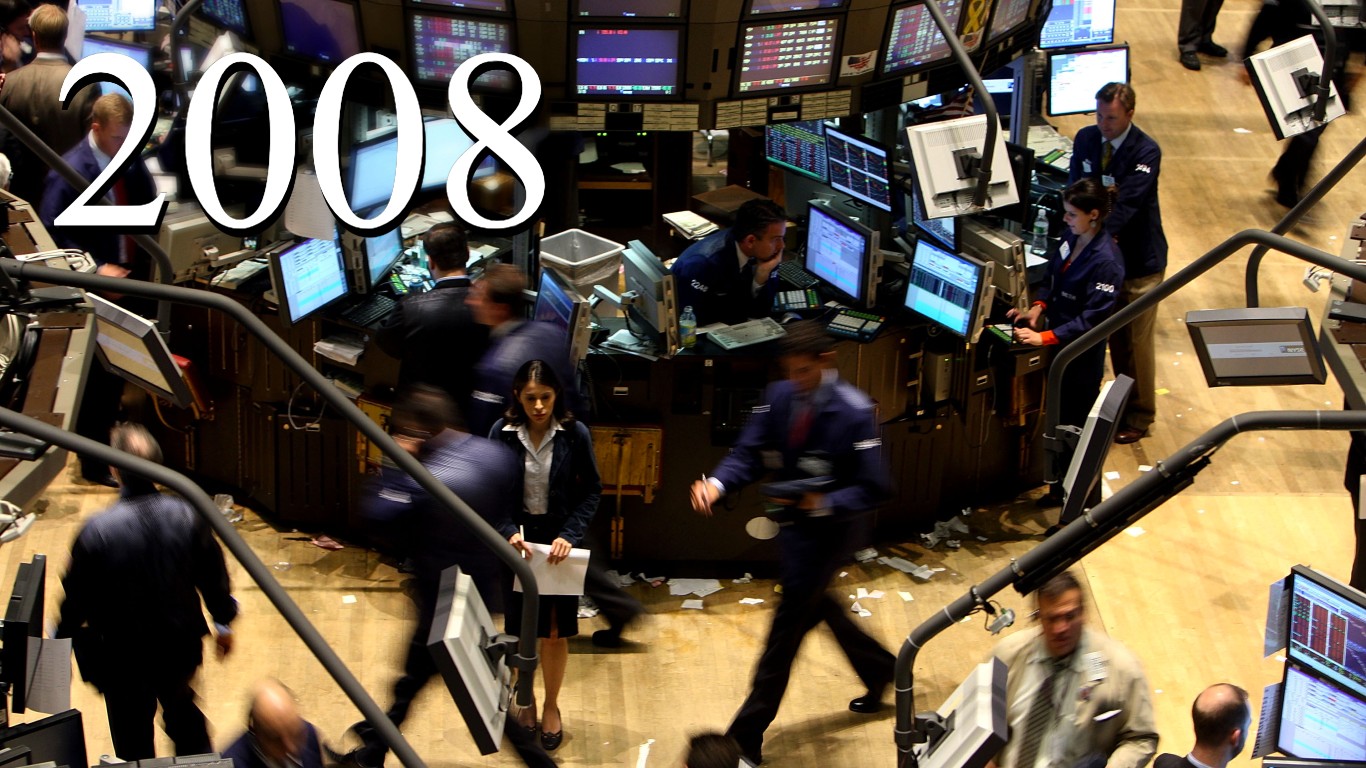
2008: $656.76 billion
> Increase from previous year: 11.39% – #8 largest Increase on list
[in-text-ad-2]
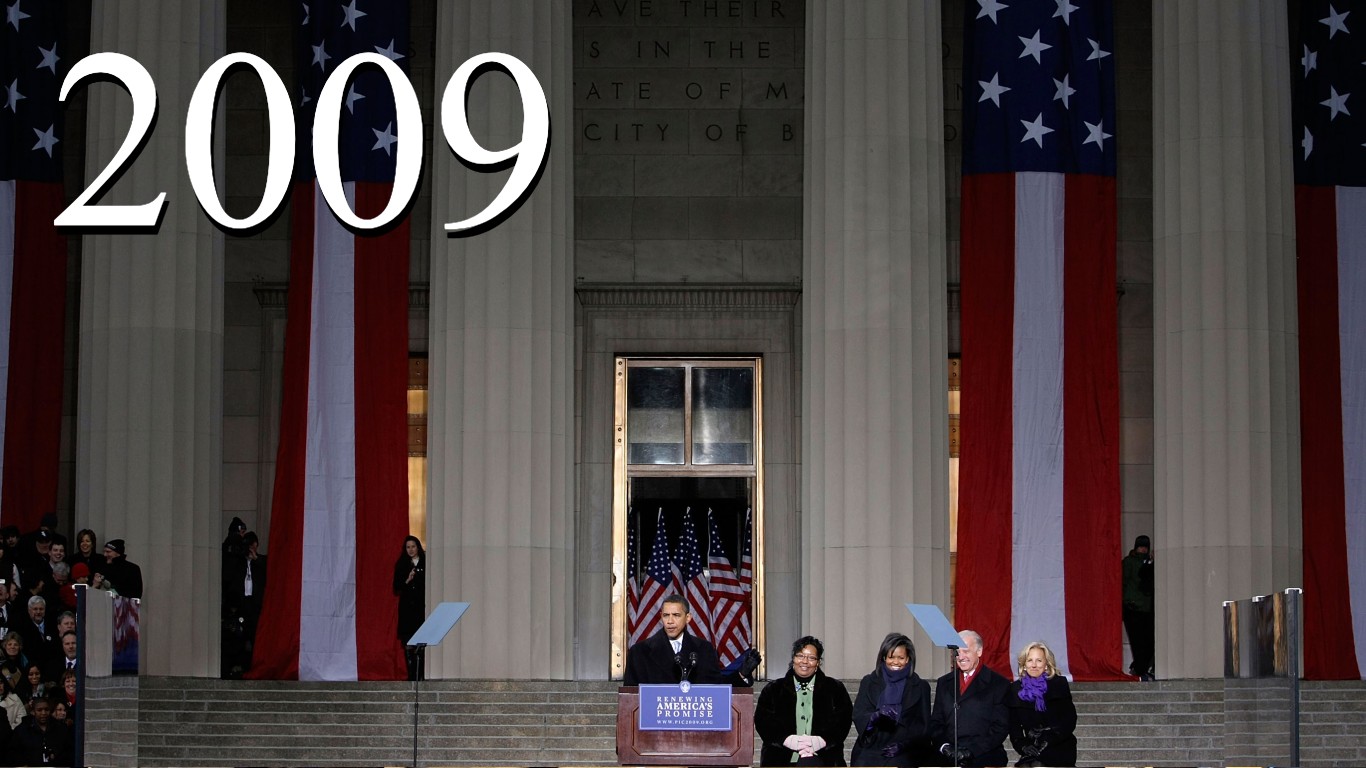
2009: $705.92 billion
> Increase from previous year: 7.49% – #19 largest Increase on list

2010: $738.01 billion
> Increase from previous year: 4.55% – #25 largest Increase on list
[in-text-ad]

2011: $752.29 billion
> Increase from previous year: 1.93% – #34 largest Increase on list

2012: $725.21 billion
> Increase from previous year: -3.60% – #48 largest Increase on list

2013: $679.23 billion
> Increase from previous year: -6.34% – #52 largest increase on list
[in-text-ad-2]

2014: $647.79 billion
> Increase from previous year: -4.63% – #50 largest Increase on list

2015: $633.83 billion
> Increase from previous year: -2.16% – #44 largest Increase on list
[in-text-ad]

2016: $639.86 billion
> Increase from previous year: 0.95% – #39 largest Increase on list
2017: $646.75 billion
> Increase from previous year: 1.08% – #37 largest Increase on list

2018: $682.49 billion
> Increase from previous year: 5.53% – #23 largest Increase on list
[in-text-ad-2]

2019: $734.34 billion
> Increase from previous year: 7.60% – #18 largest Increase on list

2020: $778.40 billion
> Increase from previous year: 6.00% – #21 largest Increase on list
[in-text-ad]

2021: $806.23 billion
> Increase from previous year: 3.60% – #28 largest Increase on list

2022: $876.94 billion
> Increase from previous year: 8.77% – #13 largest Increase on list
Want to Retire Early? Start Here (Sponsor)
Want retirement to come a few years earlier than you’d planned? Or are you ready to retire now, but want an extra set of eyes on your finances?
Now you can speak with up to 3 financial experts in your area for FREE. By simply clicking here you can begin to match with financial professionals who can help you build your plan to retire early. And the best part? The first conversation with them is free.
Click here to match with up to 3 financial pros who would be excited to help you make financial decisions.
Thank you for reading! Have some feedback for us?
Contact the 24/7 Wall St. editorial team.
 24/7 Wall St.
 24/7 Wall St.
 24/7 Wall St.