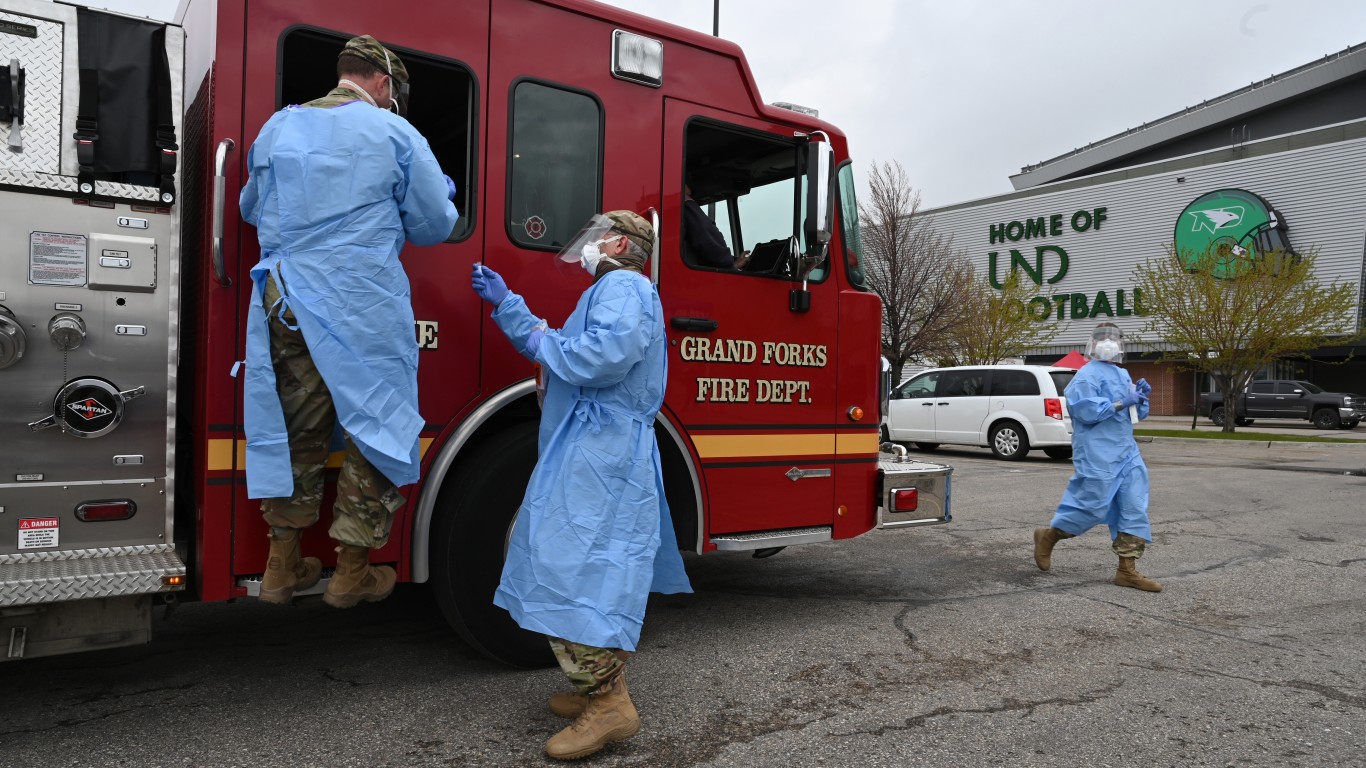
Hospital admissions for COVID-19 surged and test positivity remained virtually unchanged for the latest reporting period. As winter draws near, there is a greater possibility that other viruses and illnesses may weaken immune systems, allowing the coronavirus to infect the people more easily.
To determine the states where the COVID-19 surge is the worst right now, 24/7 Tempo reviewed data on recent COVID-19 hospital admissions from the Centers for Disease Control and Prevention. States were ranked based on the number of new hospital admissions due to COVID-19 per 100,000 state residents for the week of Nov. 5-11, 2023. Supplemental data on the total number of recorded COVID-19 hospital admissions since Aug. 1, 2020; the total number of deaths due to COVID-19 since January 2020; and the COVID-19 test positivity rate for the week of Nov. 5-11, 2023 also came from the CDC.
The seven-day moving average of hospital admissions across the country rose 8.6% to 16,239 for the reporting period ending Nov. 11 from the previous week. Test positivity was basically unchanged at 8.4% for the week ending Nov. 11.
Hawaii had the highest number of new hospital admissions due to COVID-19 per 100,000 state residents in the latest report with a rate of 11.9. A week earlier, the island state’s rate was 8.2, second-highest behind Montana.
Nine of the 10 states with the highest rates were among the highest 10 the previous week. Five of the lowest 10 in the current period were also among the lowest 10 the prior week. New Jersey had the lowest hospital admissions rate, followed by Mississippi and Louisiana. Georgia had the lowest rate the prior week. (Here is a list of famous people who died from COVID-19.)
Four Midwest/Plains states — Nebraska, Kansas, Missouri, and Iowa — had a test positivity rate of 13.4, the highest in the country. This was a drop from the four states that had a nation-leading 16.7 rate the prior week. New York and New Jersey again had the lowest rates this week at 5.8. The next 10 lowest states were from the South and Mid-Atlantic regions.
The CDC said the latest COVID-19 variant, HV.1, accounted for more than one-fourth of all COVID-19 cases since the end of October. In late July, the variant was responsible for just 0.5% of COVID-19 cases.
As health officials prepare for a resurgence of COVID-19 because of holiday gatherings, the U.S. The Postal Service announced on Nov. 20 that a new group of four free COVID-19 tests is available that can be ordered from the federal government. The tests will begin to be shipped Nov. 27, according to the postal service.
50. New Jersey

- New weekly COVID-19 hospital admissions, Nov. 5-11, 2023: 2.9 per 100,000 (264 total)
- COVID-19 hospital admissions since Aug. 1, 2020: 1,911.6 per 100,000 (25th lowest)
- COVID-19 deaths since January 2020: 384.9 per 100,000 (15th highest)
- Current COVID-19 test positivity rate: 5.8% (2nd lowest)
49. Mississippi

- New weekly COVID-19 hospital admissions, Nov. 5-11, 2023: 3.0 per 100,000 (88 total)
- COVID-19 hospital admissions since Aug. 1, 2020: 1,927.6 per 100,000 (25th highest)
- COVID-19 deaths since January 2020: 510.7 per 100,000 (the highest)
- Current COVID-19 test positivity rate: 7.2% (20th lowest)
48. Louisiana

- New weekly COVID-19 hospital admissions, Nov. 5-11, 2023: 3.0 per 100,000 (140 total)
- COVID-19 hospital admissions since Aug. 1, 2020: 2,124.8 per 100,000 (14th highest)
- COVID-19 deaths since January 2020: 388.5 per 100,000 (14th highest)
- Current COVID-19 test positivity rate: 6.4% (7th lowest)
47. Washington

- New weekly COVID-19 hospital admissions, Nov. 5-11, 2023: 3.1 per 100,000 (240 total)
- COVID-19 hospital admissions since Aug. 1, 2020: 1,021.8 per 100,000 (2nd lowest)
- COVID-19 deaths since January 2020: 197.1 per 100,000 (4th lowest)
- Current COVID-19 test positivity rate: 7.7% (17th highest)
46. Rhode Island

- New weekly COVID-19 hospital admissions, Nov. 5-11, 2023: 3.1 per 100,000 (34 total)
- COVID-19 hospital admissions since Aug. 1, 2020: 1,246.7 per 100,000 (5th lowest)
- COVID-19 deaths since January 2020: 368.3 per 100,000 (20th highest)
- Current COVID-19 test positivity rate: 7.7% (17th highest)
45. Florida

- New weekly COVID-19 hospital admissions, Nov. 5-11, 2023: 3.2 per 100,000 (713 total)
- COVID-19 hospital admissions since Aug. 1, 2020: 2,613.7 per 100,000 (4th highest)
- COVID-19 deaths since January 2020: 364.7 per 100,000 (22nd highest)
- Current COVID-19 test positivity rate: 7.2% (20th lowest)
44. Georgia

- New weekly COVID-19 hospital admissions, Nov. 5-11, 2023: 3.3 per 100,000 (358 total)
- COVID-19 hospital admissions since Aug. 1, 2020: 2,227.8 per 100,000 (9th highest)
- COVID-19 deaths since January 2020: 334.8 per 100,000 (20th lowest)
- Current COVID-19 test positivity rate: 7.2% (20th lowest)
43. North Carolina
- New weekly COVID-19 hospital admissions, Nov. 5-11, 2023: 3.6 per 100,000 (387 total)
- COVID-19 hospital admissions since Aug. 1, 2020: 1,613.4 per 100,000 (16th lowest)
- COVID-19 deaths since January 2020: 321.4 per 100,000 (18th lowest)
- Current COVID-19 test positivity rate: 7.2% (20th lowest)
42. Maine

- New weekly COVID-19 hospital admissions, Nov. 5-11, 2023: 3.8 per 100,000 (52 total)
- COVID-19 hospital admissions since Aug. 1, 2020: 1,126.6 per 100,000 (3rd lowest)
- COVID-19 deaths since January 2020: 242.5 per 100,000 (8th lowest)
- Current COVID-19 test positivity rate: 7.7% (17th highest)
41. Maryland

- New weekly COVID-19 hospital admissions, Nov. 5-11, 2023: 4.1 per 100,000 (250 total)
- COVID-19 hospital admissions since Aug. 1, 2020: 1,597.9 per 100,000 (14th lowest)
- COVID-19 deaths since January 2020: 297.9 per 100,000 (16th lowest)
- Current COVID-19 test positivity rate: 6.6% (12th lowest)
40. South Carolina

- New weekly COVID-19 hospital admissions, Nov. 5-11, 2023: 4.1 per 100,000 (218 total)
- COVID-19 hospital admissions since Aug. 1, 2020: 1,841.3 per 100,000 (21st lowest)
- COVID-19 deaths since January 2020: 407.6 per 100,000 (12th highest)
- Current COVID-19 test positivity rate: 7.2% (20th lowest)
39. Texas

- New weekly COVID-19 hospital admissions, Nov. 5-11, 2023: 4.2 per 100,000 (1,248 total)
- COVID-19 hospital admissions since Aug. 1, 2020: 2,066.1 per 100,000 (16th highest)
- COVID-19 deaths since January 2020: 343.3 per 100,000 (22nd lowest)
- Current COVID-19 test positivity rate: 6.4% (7th lowest)
38. Delaware
- New weekly COVID-19 hospital admissions, Nov. 5-11, 2023: 4.3 per 100,000 (44 total)
- COVID-19 hospital admissions since Aug. 1, 2020: 2,021.1 per 100,000 (18th highest)
- COVID-19 deaths since January 2020: 344.5 per 100,000 (24th lowest)
- Current COVID-19 test positivity rate: 6.6% (12th lowest)
37. Alaska
- New weekly COVID-19 hospital admissions, Nov. 5-11, 2023: 4.4 per 100,000 (32 total)
- COVID-19 hospital admissions since Aug. 1, 2020: 1,358.8 per 100,000 (7th lowest)
- COVID-19 deaths since January 2020: 210.1 per 100,000 (5th lowest)
- Current COVID-19 test positivity rate: 7.7% (17th highest)
36. Oregon

- New weekly COVID-19 hospital admissions, Nov. 5-11, 2023: 4.4 per 100,000 (185 total)
- COVID-19 hospital admissions since Aug. 1, 2020: 1,143.3 per 100,000 (4th lowest)
- COVID-19 deaths since January 2020: 224.0 per 100,000 (6th lowest)
- Current COVID-19 test positivity rate: 7.7% (17th highest)
35. California

- New weekly COVID-19 hospital admissions, Nov. 5-11, 2023: 4.4 per 100,000 (1,713 total)
- COVID-19 hospital admissions since Aug. 1, 2020: 1,606.8 per 100,000 (15th lowest)
- COVID-19 deaths since January 2020: 281.9 per 100,000 (12th lowest)
- Current COVID-19 test positivity rate: 7.4% (24th lowest)
34. Utah

- New weekly COVID-19 hospital admissions, Nov. 5-11, 2023: 4.4 per 100,000 (150 total)
- COVID-19 hospital admissions since Aug. 1, 2020: 1,425.7 per 100,000 (9th lowest)
- COVID-19 deaths since January 2020: 165.0 per 100,000 (3rd lowest)
- Current COVID-19 test positivity rate: 12.4% (5th highest)
33. Oklahoma
- New weekly COVID-19 hospital admissions, Nov. 5-11, 2023: 4.6 per 100,000 (185 total)
- COVID-19 hospital admissions since Aug. 1, 2020: 2,775.0 per 100,000 (2nd highest)
- COVID-19 deaths since January 2020: 490.7 per 100,000 (3rd highest)
- Current COVID-19 test positivity rate: 6.4% (7th lowest)
32. Tennessee

- New weekly COVID-19 hospital admissions, Nov. 5-11, 2023: 4.6 per 100,000 (327 total)
- COVID-19 hospital admissions since Aug. 1, 2020: 1,890.0 per 100,000 (24th lowest)
- COVID-19 deaths since January 2020: 411.8 per 100,000 (10th highest)
- Current COVID-19 test positivity rate: 7.2% (20th lowest)
31. Alabama
- New weekly COVID-19 hospital admissions, Nov. 5-11, 2023: 4.7 per 100,000 (237 total)
- COVID-19 hospital admissions since Aug. 1, 2020: 2,392.6 per 100,000 (6th highest)
- COVID-19 deaths since January 2020: 444.7 per 100,000 (6th highest)
- Current COVID-19 test positivity rate: 7.2% (20th lowest)
30. New Hampshire

- New weekly COVID-19 hospital admissions, Nov. 5-11, 2023: 4.9 per 100,000 (69 total)
- COVID-19 hospital admissions since Aug. 1, 2020: 1,352.7 per 100,000 (6th lowest)
- COVID-19 deaths since January 2020: 240.3 per 100,000 (7th lowest)
- Current COVID-19 test positivity rate: 7.7% (17th highest)
29. Arkansas
- New weekly COVID-19 hospital admissions, Nov. 5-11, 2023: 5.0 per 100,000 (151 total)
- COVID-19 hospital admissions since Aug. 1, 2020: 2,260.6 per 100,000 (8th highest)
- COVID-19 deaths since January 2020: 416.2 per 100,000 (9th highest)
- Current COVID-19 test positivity rate: 6.4% (7th lowest)
28. Indiana

- New weekly COVID-19 hospital admissions, Nov. 5-11, 2023: 5.0 per 100,000 (340 total)
- COVID-19 hospital admissions since Aug. 1, 2020: 2,077.8 per 100,000 (15th highest)
- COVID-19 deaths since January 2020: 383.7 per 100,000 (16th highest)
- Current COVID-19 test positivity rate: 10.4% (11th highest)
27. Massachusetts

- New weekly COVID-19 hospital admissions, Nov. 5-11, 2023: 5.1 per 100,000 (354 total)
- COVID-19 hospital admissions since Aug. 1, 2020: 1,548.7 per 100,000 (13th lowest)
- COVID-19 deaths since January 2020: 304.8 per 100,000 (17th lowest)
- Current COVID-19 test positivity rate: 7.7% (17th highest)
26. Idaho

- New weekly COVID-19 hospital admissions, Nov. 5-11, 2023: 5.1 per 100,000 (99 total)
- COVID-19 hospital admissions since Aug. 1, 2020: 1,475.2 per 100,000 (12th lowest)
- COVID-19 deaths since January 2020: 287.6 per 100,000 (13th lowest)
- Current COVID-19 test positivity rate: 7.7% (17th highest)
25. Minnesota

- New weekly COVID-19 hospital admissions, Nov. 5-11, 2023: 5.1 per 100,000 (293 total)
- COVID-19 hospital admissions since Aug. 1, 2020: 1,419.4 per 100,000 (8th lowest)
- COVID-19 deaths since January 2020: 276.0 per 100,000 (11th lowest)
- Current COVID-19 test positivity rate: 10.4% (11th highest)
24. Michigan
- New weekly COVID-19 hospital admissions, Nov. 5-11, 2023: 5.2 per 100,000 (517 total)
- COVID-19 hospital admissions since Aug. 1, 2020: 1,964.1 per 100,000 (23rd highest)
- COVID-19 deaths since January 2020: 379.8 per 100,000 (17th highest)
- Current COVID-19 test positivity rate: 10.4% (11th highest)
23. Nevada

- New weekly COVID-19 hospital admissions, Nov. 5-11, 2023: 5.2 per 100,000 (164 total)
- COVID-19 hospital admissions since Aug. 1, 2020: 2,055.6 per 100,000 (17th highest)
- COVID-19 deaths since January 2020: 376.1 per 100,000 (18th highest)
- Current COVID-19 test positivity rate: 7.4% (24th lowest)
22. New York

- New weekly COVID-19 hospital admissions, Nov. 5-11, 2023: 5.3 per 100,000 (1,035 total)
- COVID-19 hospital admissions since Aug. 1, 2020: 1,974.1 per 100,000 (22nd highest)
- COVID-19 deaths since January 2020: 416.9 per 100,000 (8th highest)
- Current COVID-19 test positivity rate: 5.8% (2nd lowest)
21. Wyoming

- New weekly COVID-19 hospital admissions, Nov. 5-11, 2023: 5.3 per 100,000 (31 total)
- COVID-19 hospital admissions since Aug. 1, 2020: 2,006.8 per 100,000 (19th highest)
- COVID-19 deaths since January 2020: 373.6 per 100,000 (19th highest)
- Current COVID-19 test positivity rate: 12.4% (5th highest)
20. Virginia

- New weekly COVID-19 hospital admissions, Nov. 5-11, 2023: 5.4 per 100,000 (465 total)
- COVID-19 hospital admissions since Aug. 1, 2020: 1,443.9 per 100,000 (11th lowest)
- COVID-19 deaths since January 2020: 275.4 per 100,000 (10th lowest)
- Current COVID-19 test positivity rate: 6.6% (12th lowest)
19. Iowa
- New weekly COVID-19 hospital admissions, Nov. 5-11, 2023: 5.5 per 100,000 (176 total)
- COVID-19 hospital admissions since Aug. 1, 2020: 1,737.8 per 100,000 (19th lowest)
- COVID-19 deaths since January 2020: 350.8 per 100,000 (25th highest)
- Current COVID-19 test positivity rate: 13.4% (the highest)
18. Connecticut

- New weekly COVID-19 hospital admissions, Nov. 5-11, 2023: 5.5 per 100,000 (200 total)
- COVID-19 hospital admissions since Aug. 1, 2020: 1,841.0 per 100,000 (20th lowest)
- COVID-19 deaths since January 2020: 343.4 per 100,000 (23rd lowest)
- Current COVID-19 test positivity rate: 7.7% (17th highest)
17. North Dakota
- New weekly COVID-19 hospital admissions, Nov. 5-11, 2023: 5.5 per 100,000 (43 total)
- COVID-19 hospital admissions since Aug. 1, 2020: 1,982.3 per 100,000 (21st highest)
- COVID-19 deaths since January 2020: 342.2 per 100,000 (21st lowest)
- Current COVID-19 test positivity rate: 12.4% (5th highest)
16. Ohio

- New weekly COVID-19 hospital admissions, Nov. 5-11, 2023: 5.8 per 100,000 (676 total)
- COVID-19 hospital admissions since Aug. 1, 2020: 2,264.1 per 100,000 (7th highest)
- COVID-19 deaths since January 2020: 427.5 per 100,000 (7th highest)
- Current COVID-19 test positivity rate: 10.4% (11th highest)
15. Pennsylvania

- New weekly COVID-19 hospital admissions, Nov. 5-11, 2023: 5.8 per 100,000 (746 total)
- COVID-19 hospital admissions since Aug. 1, 2020: 1,937.4 per 100,000 (24th highest)
- COVID-19 deaths since January 2020: 411.2 per 100,000 (11th highest)
- Current COVID-19 test positivity rate: 6.6% (12th lowest)
14. Illinois

- New weekly COVID-19 hospital admissions, Nov. 5-11, 2023: 5.9 per 100,000 (740 total)
- COVID-19 hospital admissions since Aug. 1, 2020: 1,866.6 per 100,000 (23rd lowest)
- COVID-19 deaths since January 2020: 323.8 per 100,000 (19th lowest)
- Current COVID-19 test positivity rate: 10.4% (11th highest)
13. Missouri

- New weekly COVID-19 hospital admissions, Nov. 5-11, 2023: 5.9 per 100,000 (364 total)
- COVID-19 hospital admissions since Aug. 1, 2020: 2,165.5 per 100,000 (12th highest)
- COVID-19 deaths since January 2020: 368.0 per 100,000 (21st highest)
- Current COVID-19 test positivity rate: 13.4% (the highest)
12. Arizona

- New weekly COVID-19 hospital admissions, Nov. 5-11, 2023: 6.5 per 100,000 (478 total)
- COVID-19 hospital admissions since Aug. 1, 2020: 2,131.0 per 100,000 (13th highest)
- COVID-19 deaths since January 2020: 406.9 per 100,000 (13th highest)
- Current COVID-19 test positivity rate: 7.4% (24th lowest)
11. Vermont

- New weekly COVID-19 hospital admissions, Nov. 5-11, 2023: 6.6 per 100,000 (43 total)
- COVID-19 hospital admissions since Aug. 1, 2020: 1,021.4 per 100,000 (the lowest)
- COVID-19 deaths since January 2020: 164.3 per 100,000 (2nd lowest)
- Current COVID-19 test positivity rate: 7.7% (17th highest)
10. Kansas
- New weekly COVID-19 hospital admissions, Nov. 5-11, 2023: 6.7 per 100,000 (197 total)
- COVID-19 hospital admissions since Aug. 1, 2020: 1,990.4 per 100,000 (20th highest)
- COVID-19 deaths since January 2020: 363.8 per 100,000 (24th highest)
- Current COVID-19 test positivity rate: 13.4% (the highest)
9. Wisconsin

- New weekly COVID-19 hospital admissions, Nov. 5-11, 2023: 6.8 per 100,000 (400 total)
- COVID-19 hospital admissions since Aug. 1, 2020: 2,195.9 per 100,000 (10th highest)
- COVID-19 deaths since January 2020: 294.2 per 100,000 (14th lowest)
- Current COVID-19 test positivity rate: 10.4% (11th highest)
8. Nebraska
- New weekly COVID-19 hospital admissions, Nov. 5-11, 2023: 7.1 per 100,000 (140 total)
- COVID-19 hospital admissions since Aug. 1, 2020: 1,645.9 per 100,000 (17th lowest)
- COVID-19 deaths since January 2020: 296.0 per 100,000 (15th lowest)
- Current COVID-19 test positivity rate: 13.4% (the highest)
7. Colorado
- New weekly COVID-19 hospital admissions, Nov. 5-11, 2023: 7.7 per 100,000 (450 total)
- COVID-19 hospital admissions since Aug. 1, 2020: 1,716.8 per 100,000 (18th lowest)
- COVID-19 deaths since January 2020: 259.8 per 100,000 (9th lowest)
- Current COVID-19 test positivity rate: 12.4% (5th highest)
6. South Dakota

- New weekly COVID-19 hospital admissions, Nov. 5-11, 2023: 8.0 per 100,000 (73 total)
- COVID-19 hospital admissions since Aug. 1, 2020: 2,173.6 per 100,000 (11th highest)
- COVID-19 deaths since January 2020: 364.7 per 100,000 (23rd highest)
- Current COVID-19 test positivity rate: 12.4% (5th highest)
5. Kentucky

- New weekly COVID-19 hospital admissions, Nov. 5-11, 2023: 8.1 per 100,000 (365 total)
- COVID-19 hospital admissions since Aug. 1, 2020: 3,507.8 per 100,000 (the highest)
- COVID-19 deaths since January 2020: 449.3 per 100,000 (4th highest)
- Current COVID-19 test positivity rate: 7.2% (20th lowest)
4. Montana

- New weekly COVID-19 hospital admissions, Nov. 5-11, 2023: 8.1 per 100,000 (91 total)
- COVID-19 hospital admissions since Aug. 1, 2020: 2,751.3 per 100,000 (3rd highest)
- COVID-19 deaths since January 2020: 349.1 per 100,000 (25th lowest)
- Current COVID-19 test positivity rate: 12.4% (5th highest)
3. New Mexico

- New weekly COVID-19 hospital admissions, Nov. 5-11, 2023: 8.5 per 100,000 (180 total)
- COVID-19 hospital admissions since Aug. 1, 2020: 1,860.4 per 100,000 (22nd lowest)
- COVID-19 deaths since January 2020: 446.0 per 100,000 (5th highest)
- Current COVID-19 test positivity rate: 6.4% (7th lowest)
2. West Virginia
- New weekly COVID-19 hospital admissions, Nov. 5-11, 2023: 10.5 per 100,000 (187 total)
- COVID-19 hospital admissions since Aug. 1, 2020: 2,467.7 per 100,000 (5th highest)
- COVID-19 deaths since January 2020: 494.2 per 100,000 (2nd highest)
- Current COVID-19 test positivity rate: 6.6% (12th lowest)
1. Hawaii
- New weekly COVID-19 hospital admissions, Nov. 5-11, 2023: 11.9 per 100,000 (171 total)
- COVID-19 hospital admissions since Aug. 1, 2020: 1,427.4 per 100,000 (10th lowest)
- COVID-19 deaths since January 2020: 140.3 per 100,000 (the lowest)
- Current COVID-19 test positivity rate: 7.4% (24th lowest)
It’s Your Money, Your Future—Own It (sponsor)
Are you ahead, or behind on retirement? For families with more than $500,000 saved for retirement, finding a financial advisor who puts your interest first can be the difference, and today it’s easier than ever. SmartAsset’s free tool matches you with up to three fiduciary financial advisors who serve your area in minutes. Each advisor has been carefully vetted and must act in your best interests. Start your search now.
If you’ve saved and built a substantial nest egg for you and your family, don’t delay; get started right here and help your retirement dreams become a retirement reality.
Thank you for reading! Have some feedback for us?
Contact the 24/7 Wall St. editorial team.


