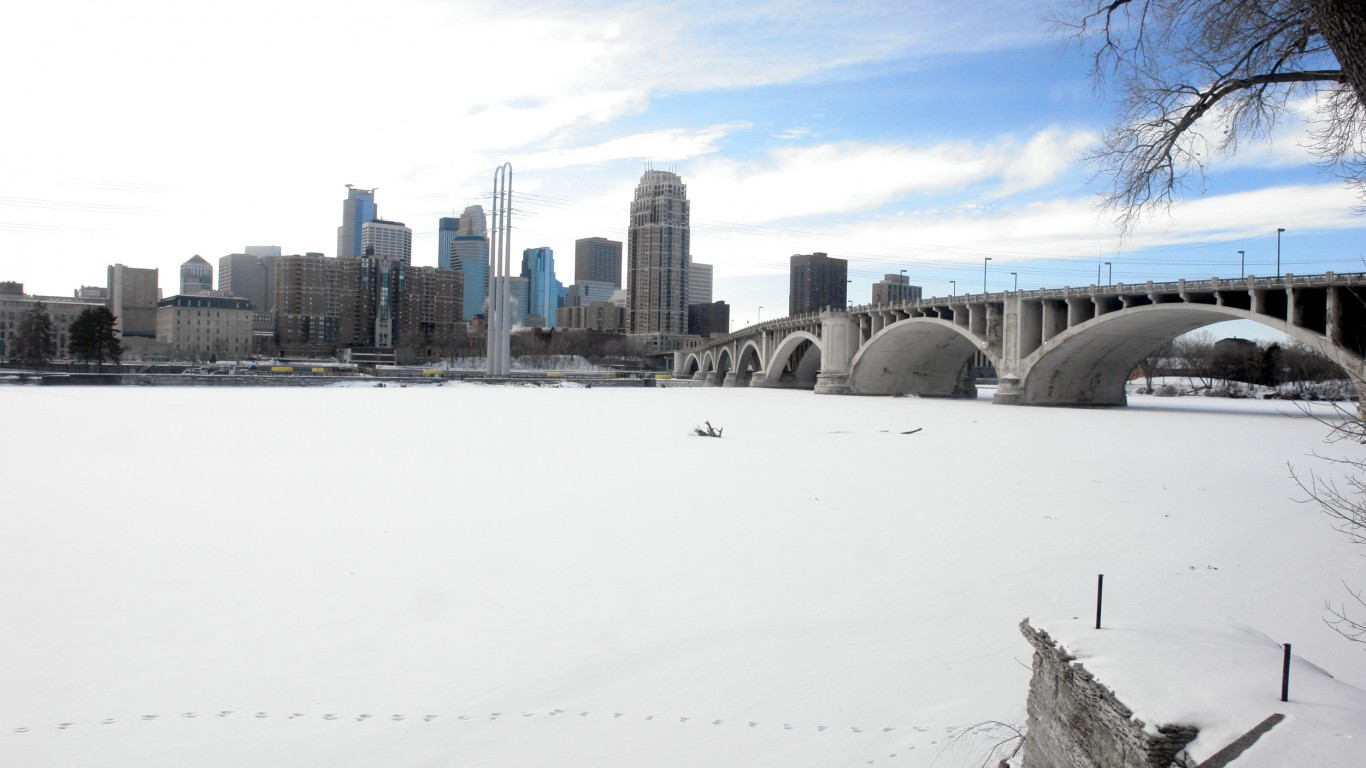
Despite better warning systems and stronger infrastructure, all areas of the world remain vulnerable to the worst that Mother Nature can mete out.
In 2022, there were 387 natural hazards and disasters worldwide, according to the Emergency Event Database EM-DAT, costing over 30,000 lives and resulting in economic losses of almost $224 billion. Heat waves caused more than 16,000 deaths in Europe. Drought impacted 88.9 million people in Africa. Flooding in Pakistan affected 33 million people. Hurricane Ian lashed the Americas, costing $100 billion. As people build in areas vulnerable to climate change or move to places that had been considered not suitable for habitation, the economic costs will continue to rise.
24/7 Wall St. compiled a list of the worst natural disasters since 1980, based on economic damage. We gleaned information from Statista, a global data and business intelligence platform, the NOAA National Centers for Environmental Information, and other sources. Natural disasters are ordered by the economic cost, which represents the inflation-adjusted cost, using the 2023 consumer price index. Estimates of economic damage are constantly updated, and this list represents the most current estimate of economic loss.
Since 1980, hurricanes have caused the most damage of any natural phenomenon on our list, with 11 destructive events. They have struck island nations in the Caribbean and the U.S. mainland. (Also see, the most hurricane-vulnerable counties in America.)
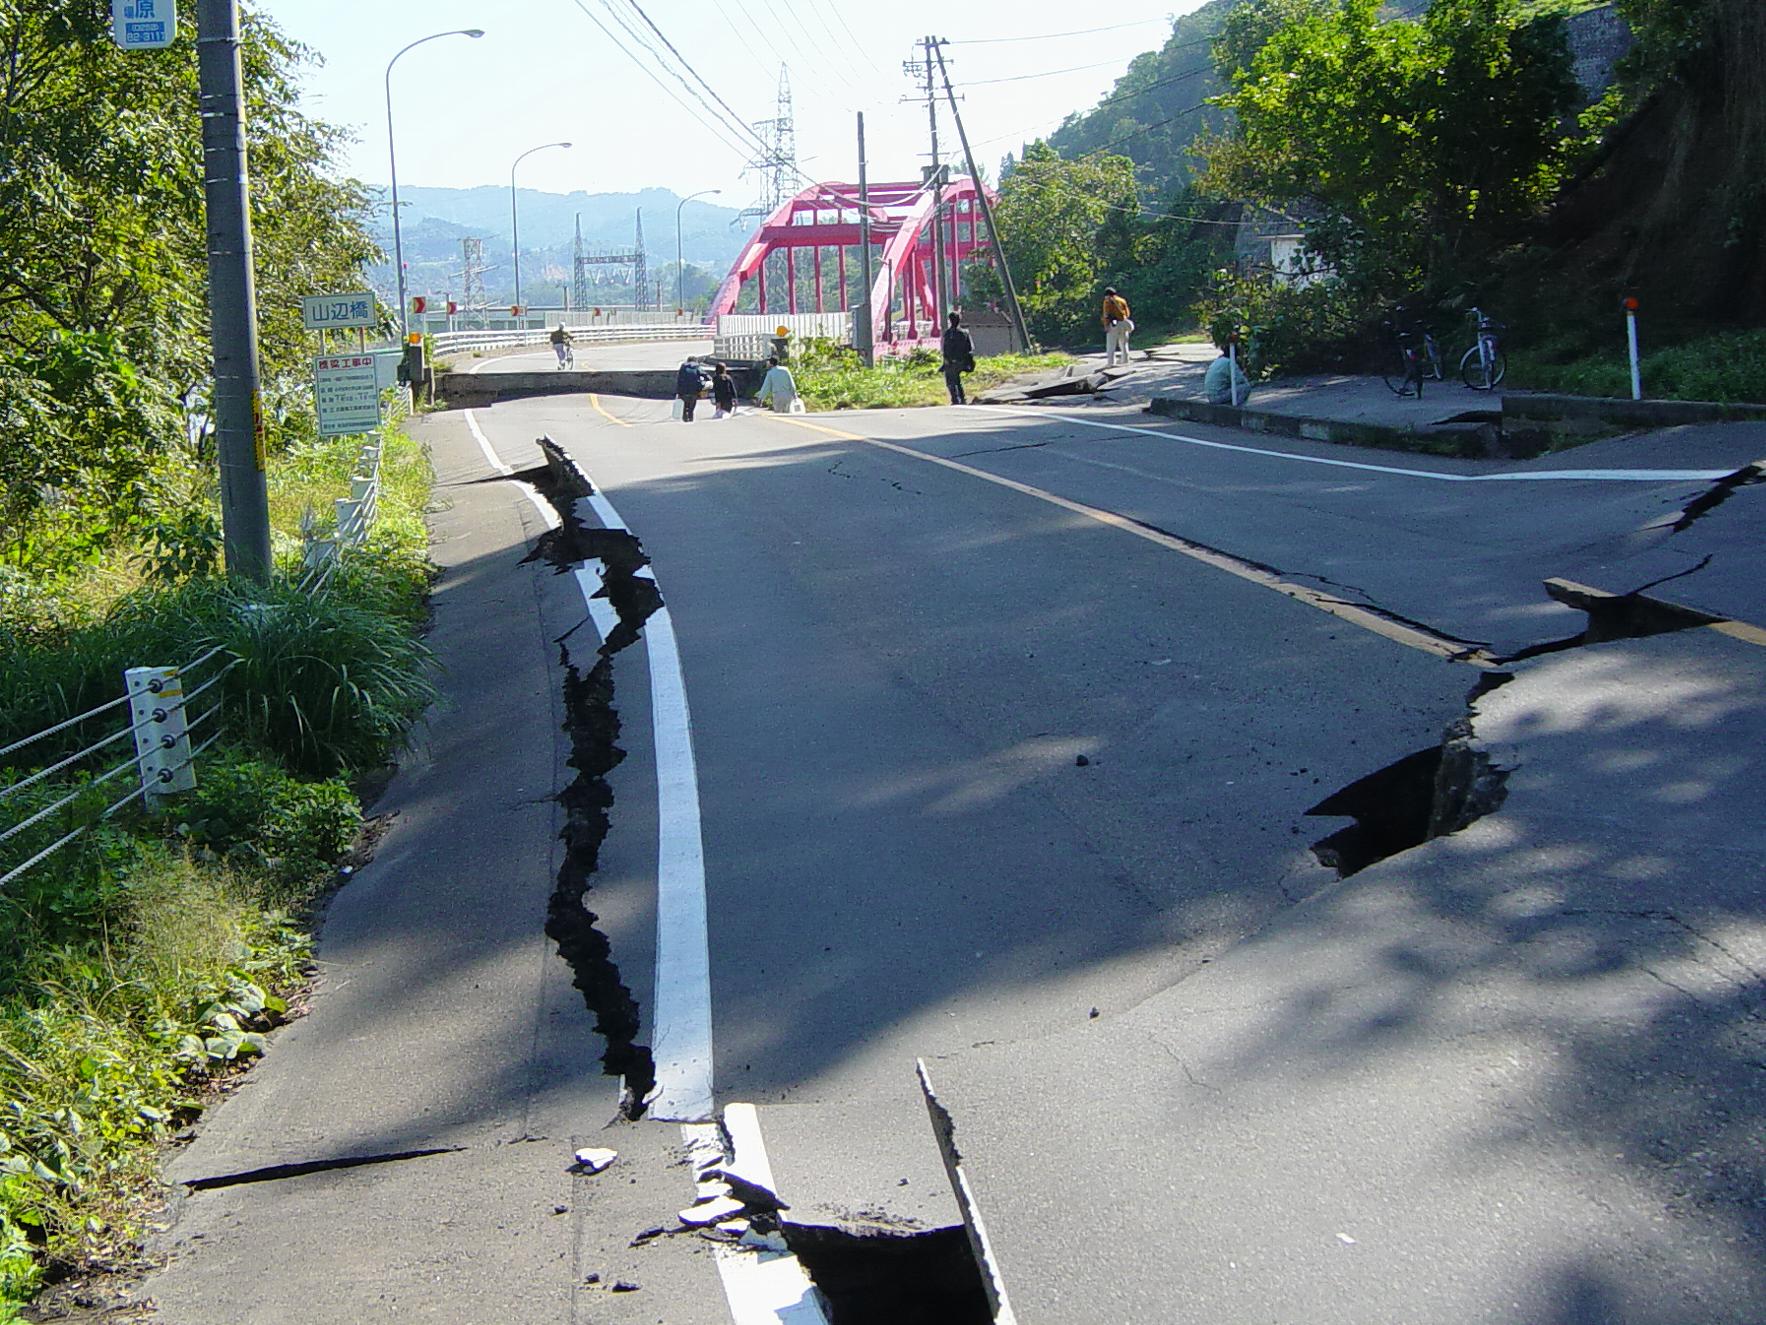
Even though earthquakes rumble across borders, few countries have been more devastated by the temblors than Japan, which was struck by four major quakes since 1980 that made our list. Other nations hit by earthquakes on our list are China and most recently Turkey and Syria, absorbing a 7.8 magnitude quake in February 2023. (These are the most powerful earthquakes ever recorded.)
Events involving precipitation extremes account for other disastrous events. Most of the worst catastrophic flooding since 1980 occurred in Asia, though there were devastating episodes in Europe and the American Midwest. Three major droughts/heat waves have ravaged the United States since 1980, destroying crops and livestock.
Here are the worst natural disasters since 1980.
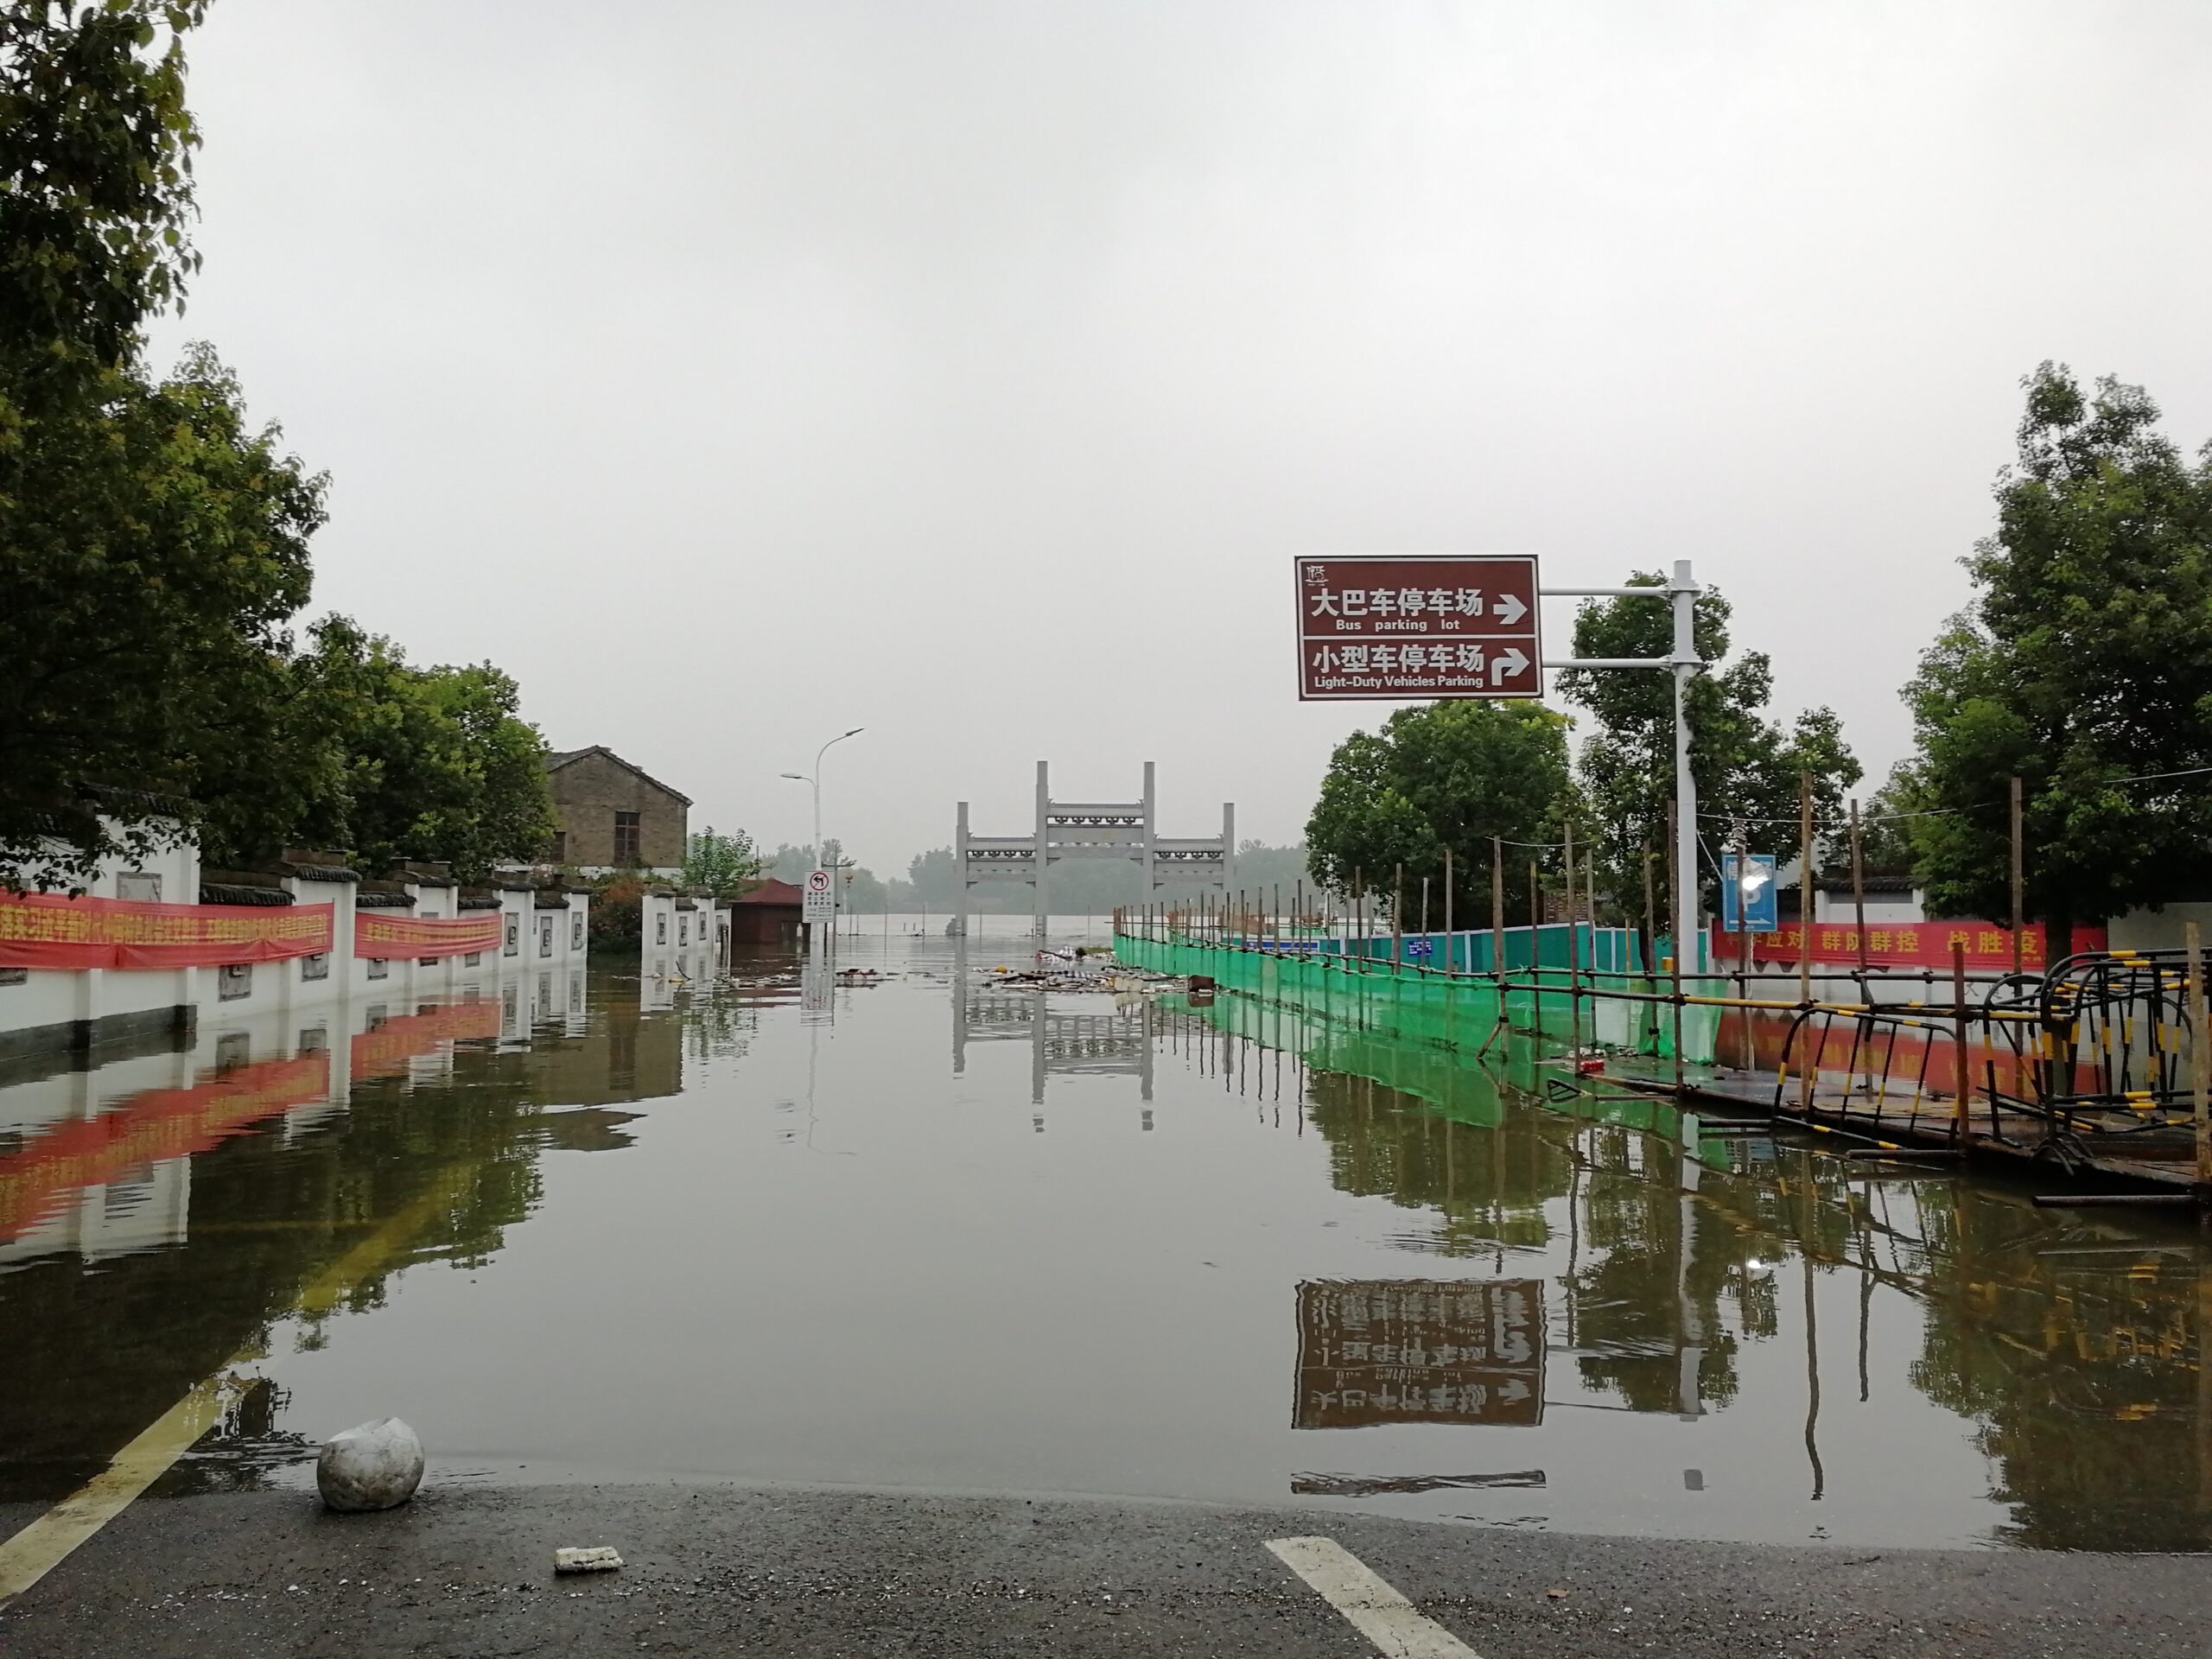
Floods
- Location: China, India, Japan
- Year: 2020
- Economic cost: $408 billion
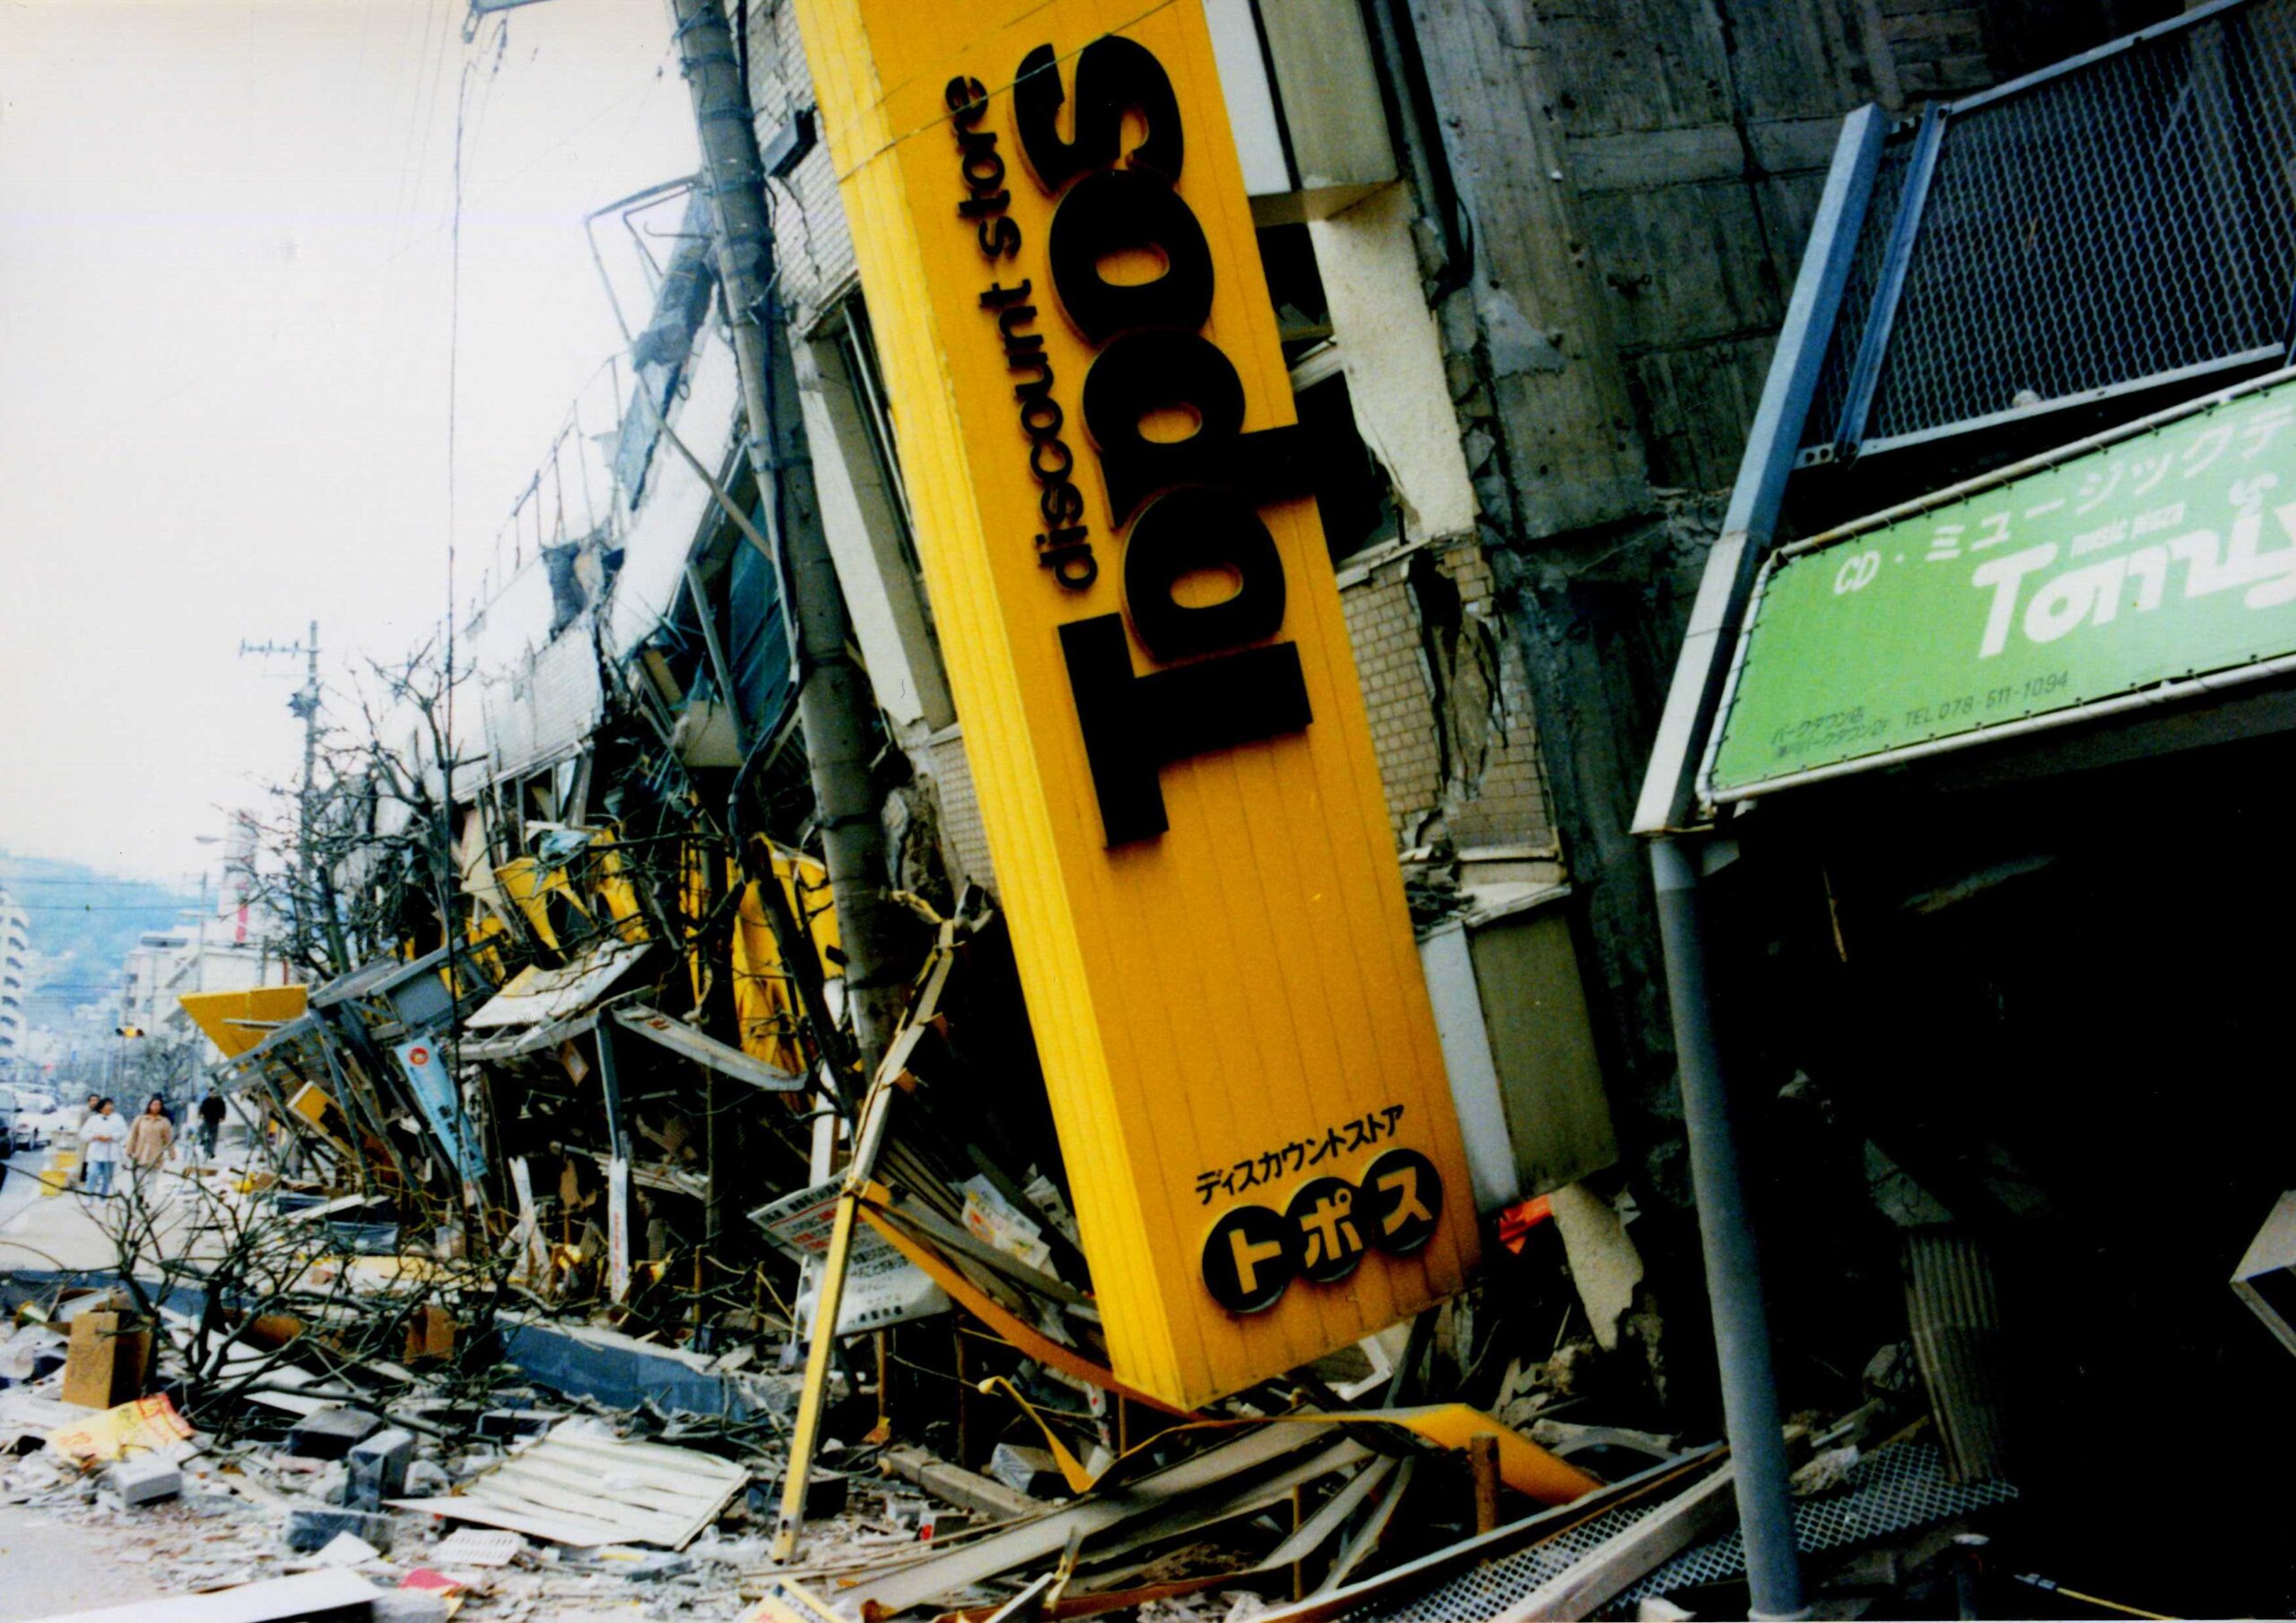
Earthquake
- Location: Kobe, Japan
- Year: 1995
- Economic cost: $300 billion+
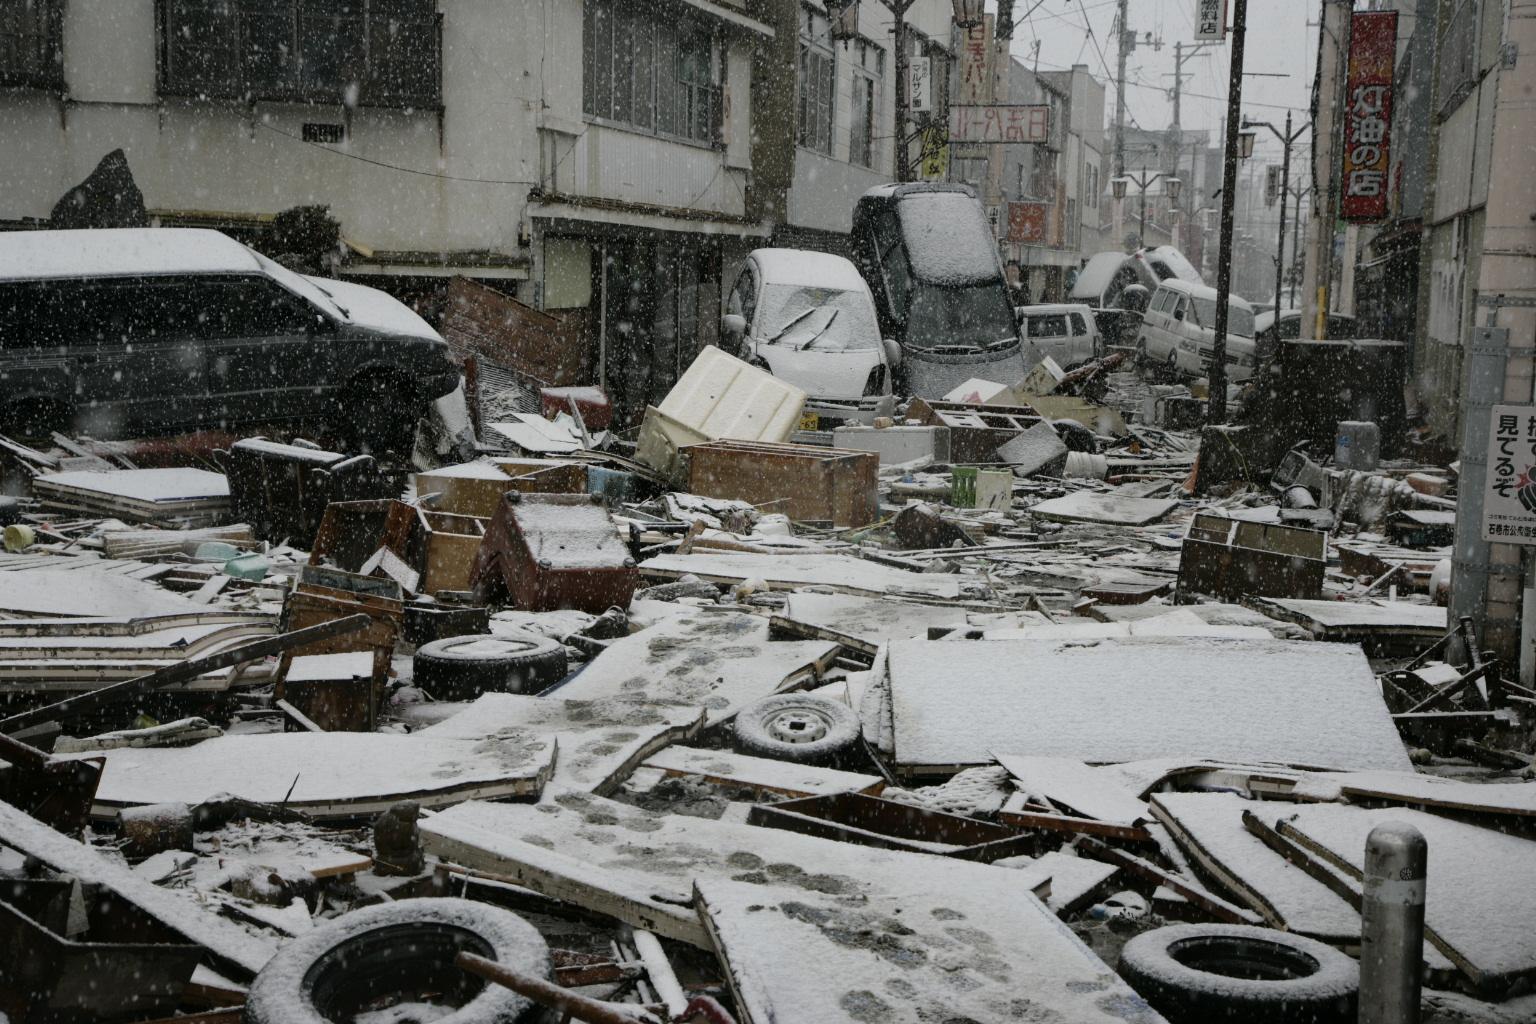
Earthquake/tsunami
- Location: Fukushima, Japan
- Year: 2011
- Economic cost: $210 billion
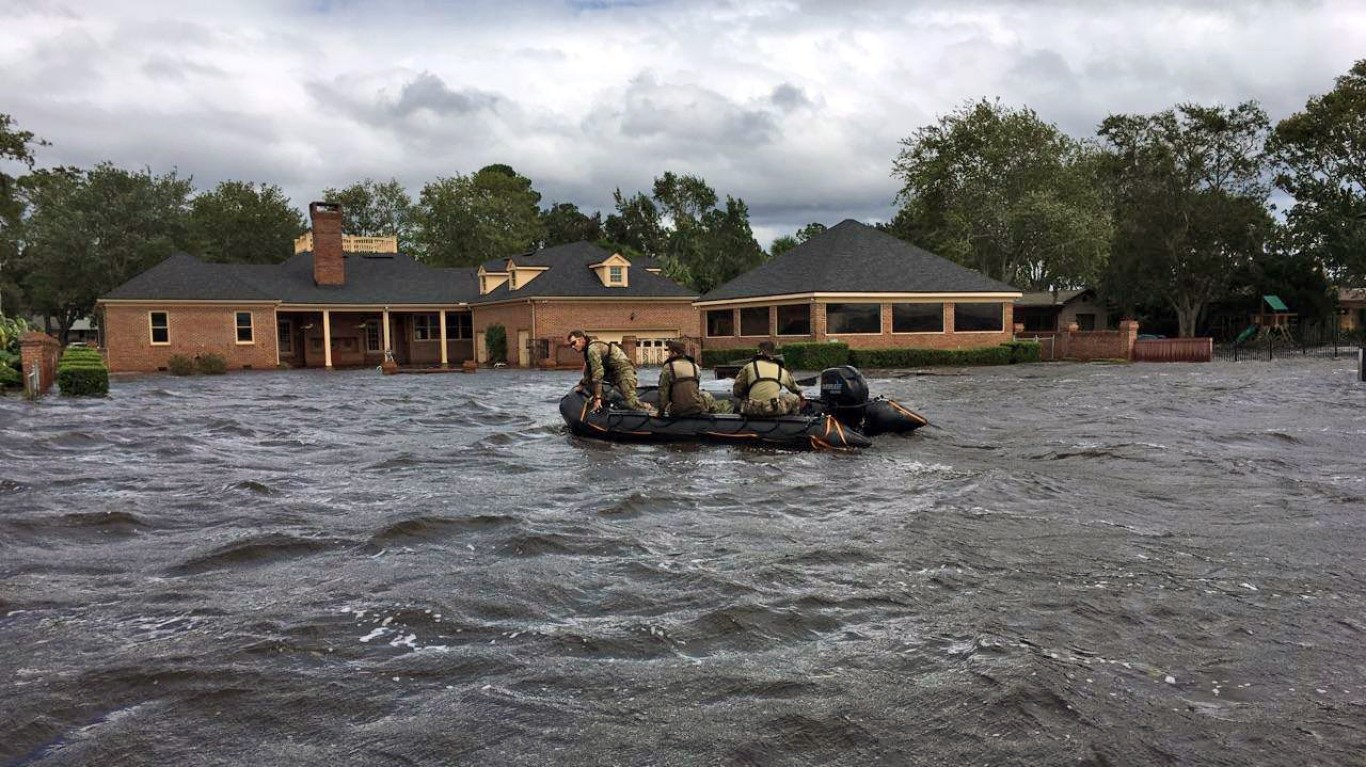
Hurricane Katrina
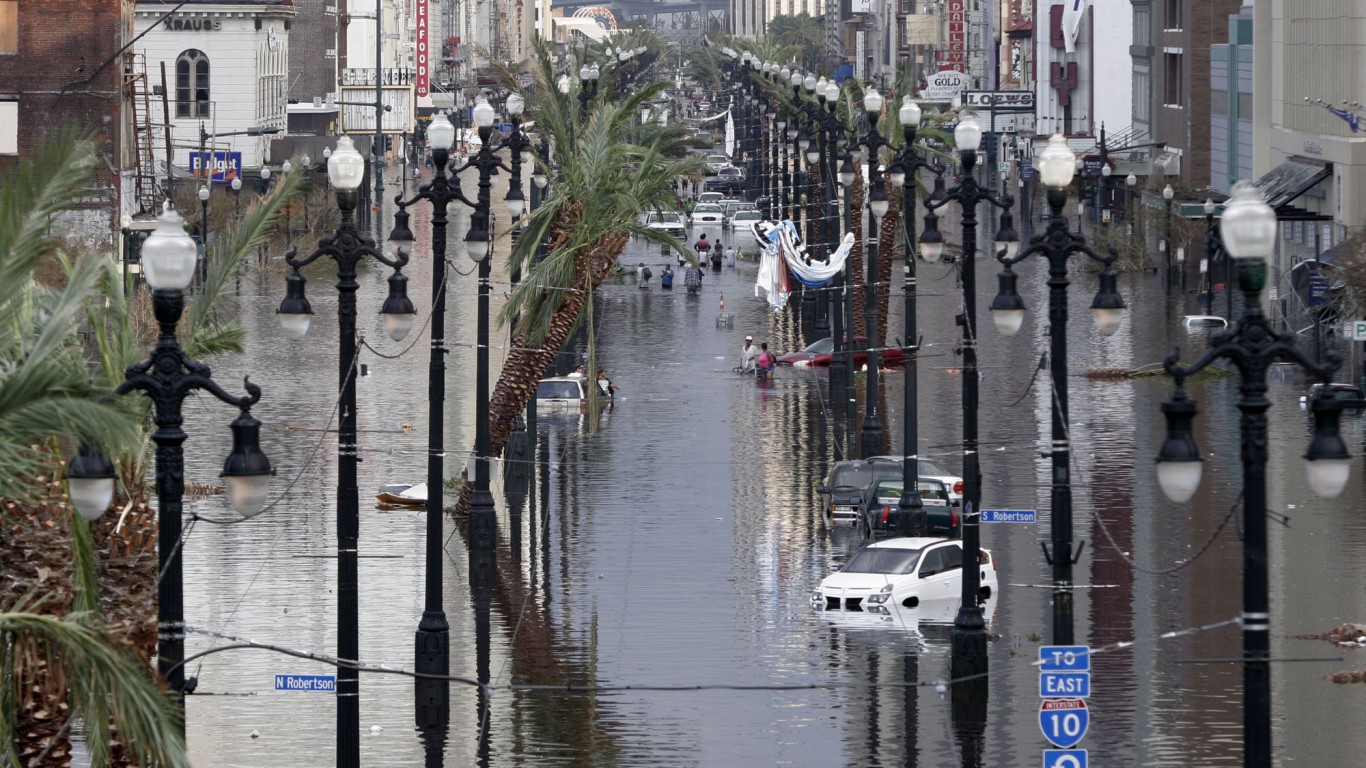
- Location: United States
- Year: 2005
- Economic cost: $195 billion
Hurricane Harvey
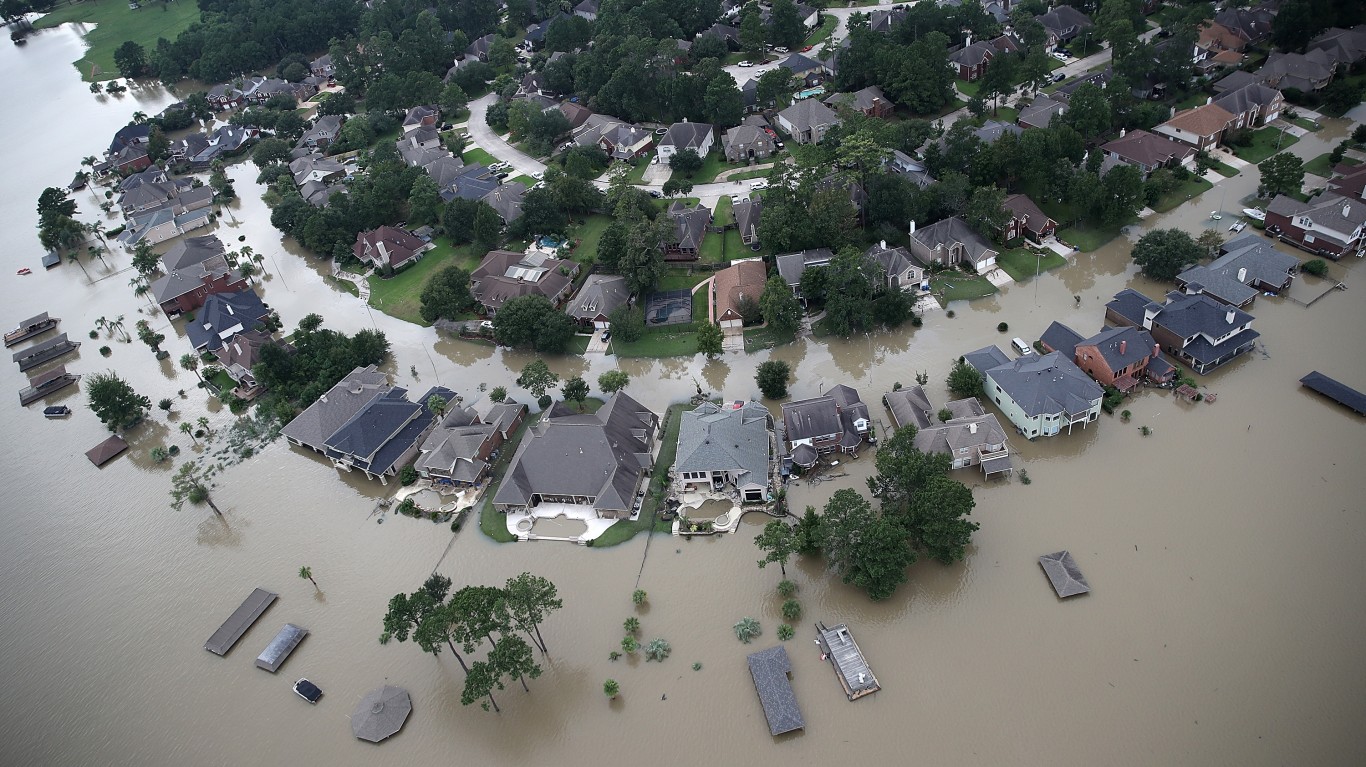
- Location: United States
- Year: 2017
- Economic cost: $155 billion
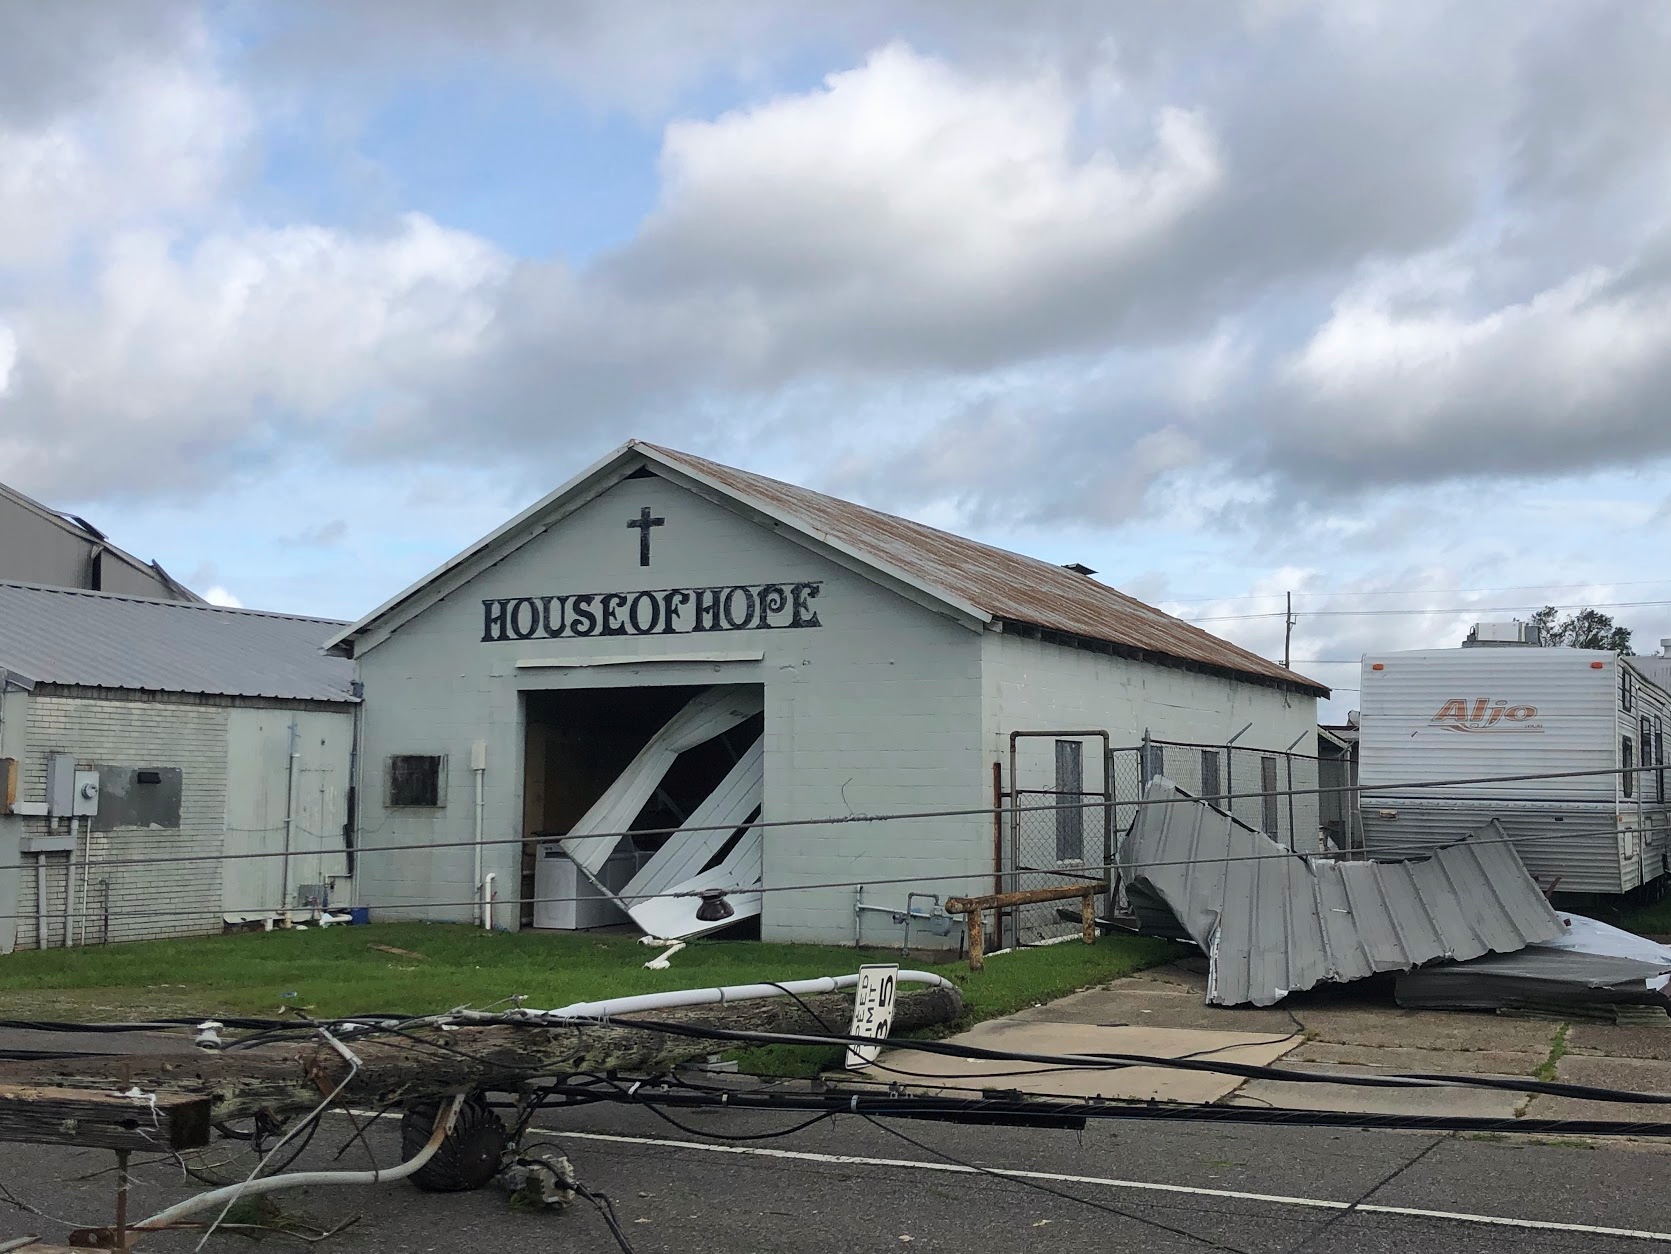
Hurricane Ian
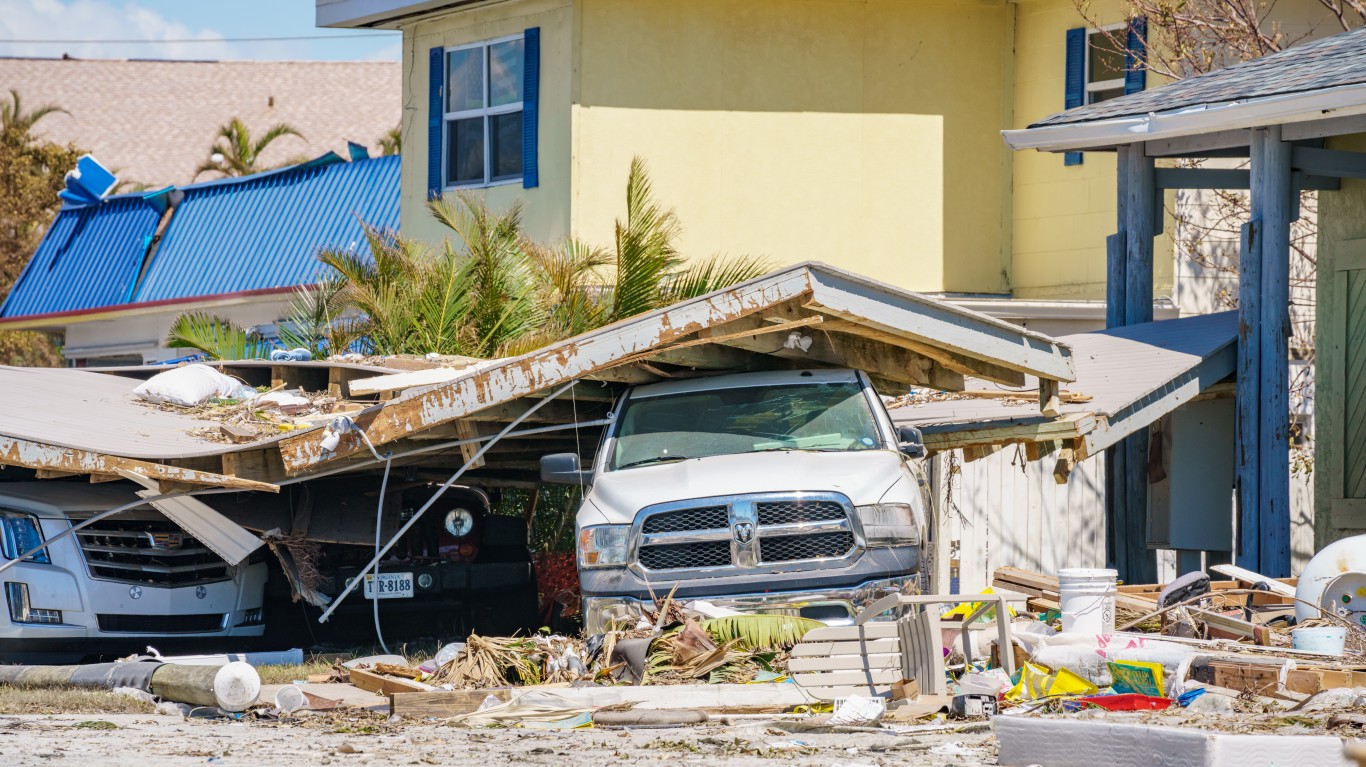
- Location: Florida
- Year: 2022
- Economic cost: $116.3 billion
Hurricane Maria
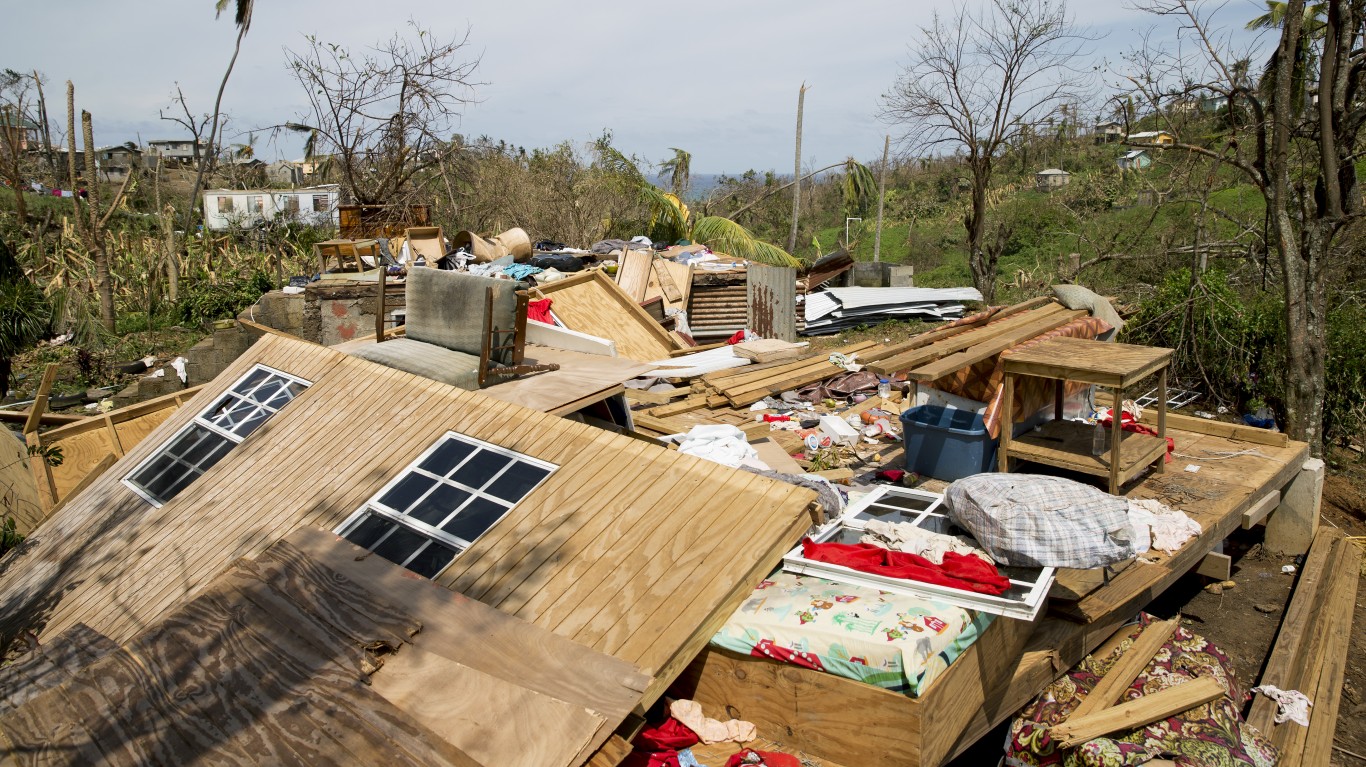
- Location: Caribbean
- Year: 2017
- Economic cost: $111.6 billion
Kobe earthquake
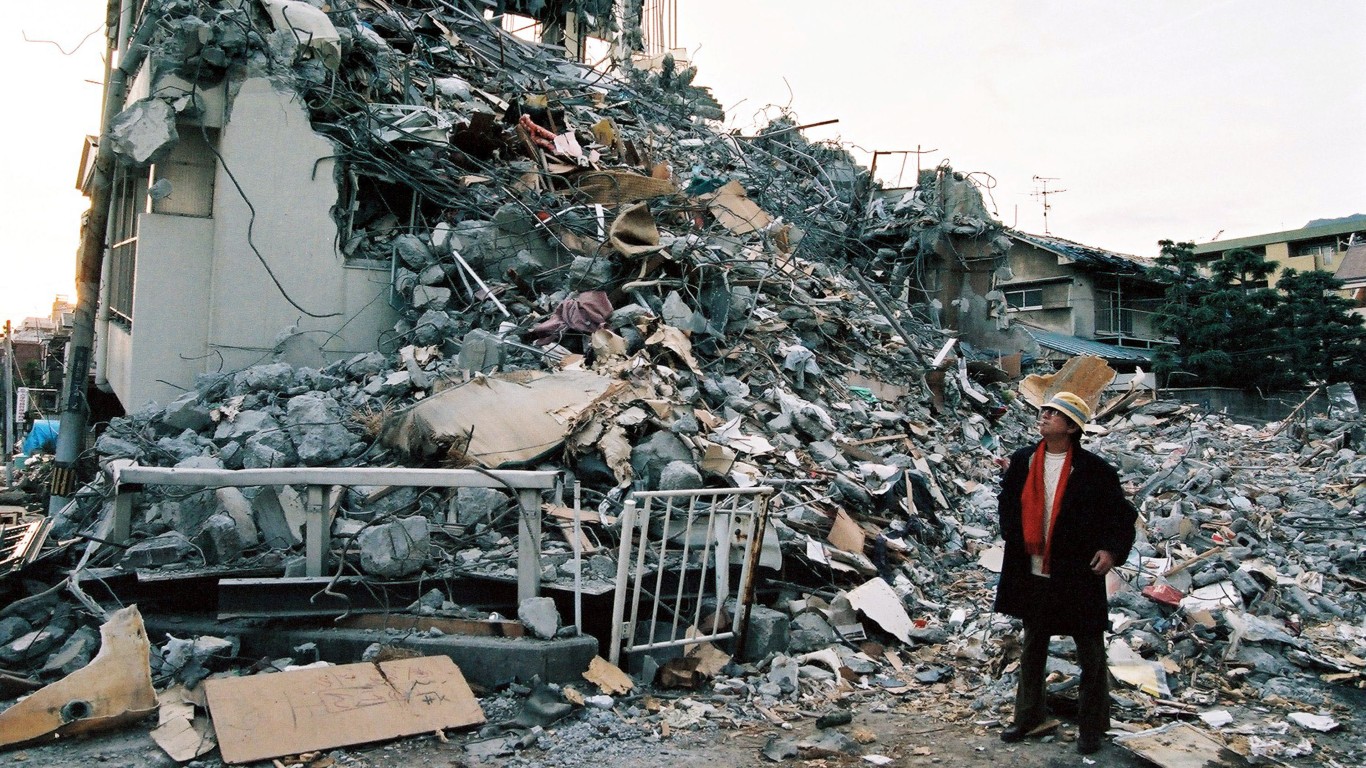
- Location: Japan
- Year: 1995
- Economic cost: $100 billion
Bushfires
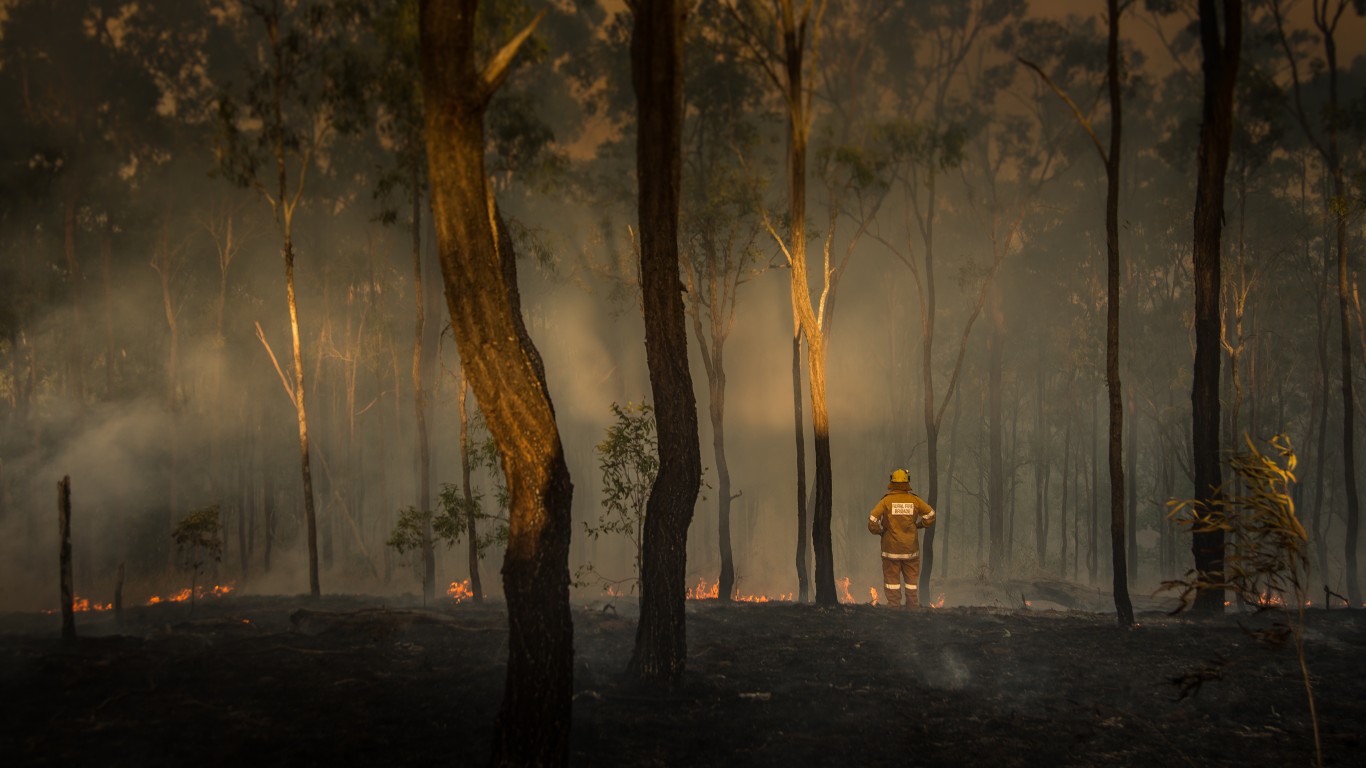
- Location: Australia
- Year: 2019-20
- Economic cost: $95 billion
Hurricane Sandy
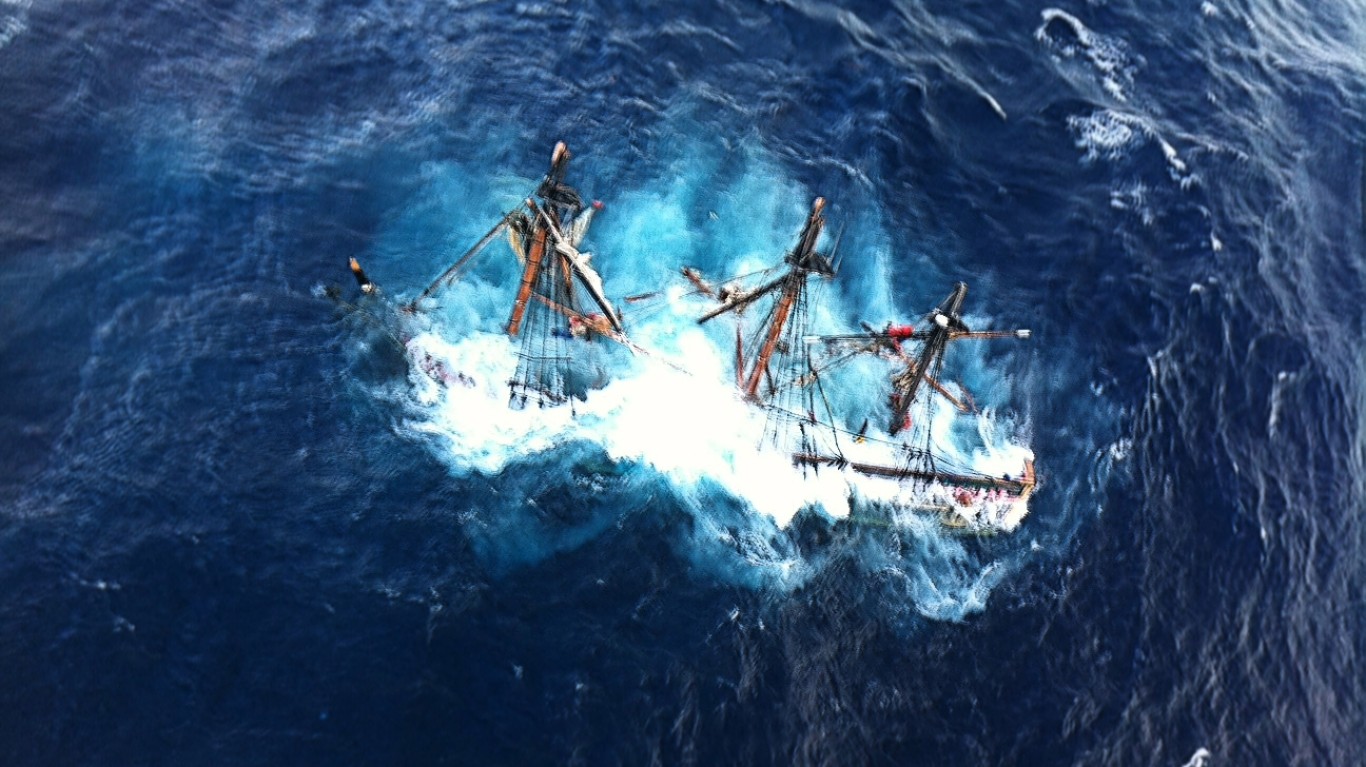
- Location: U.S./Canada/Caribbean
- Year: 2012
- Economic cost: $86.5 billion
Sichuan earthquake
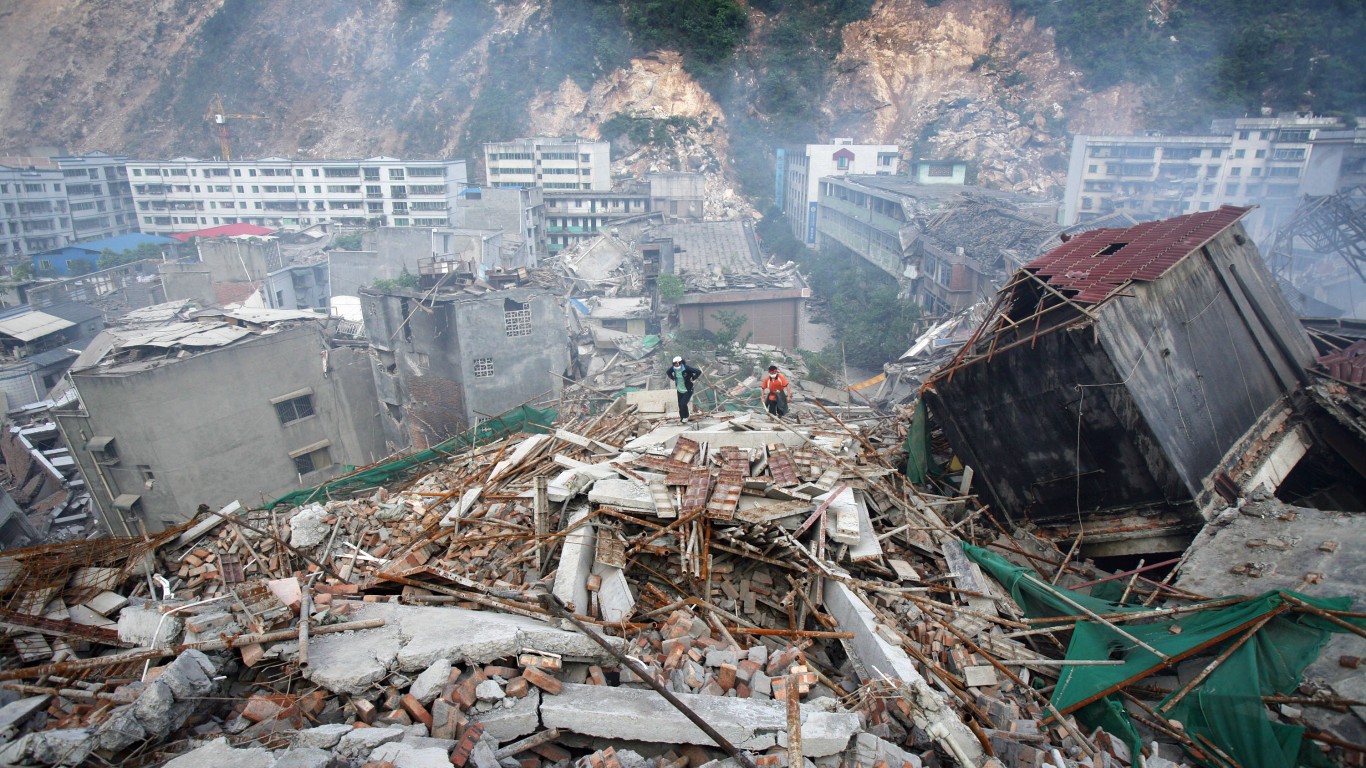
- Location: China
- Year: 2008
- Economic cost: $85 billion
Earthquake
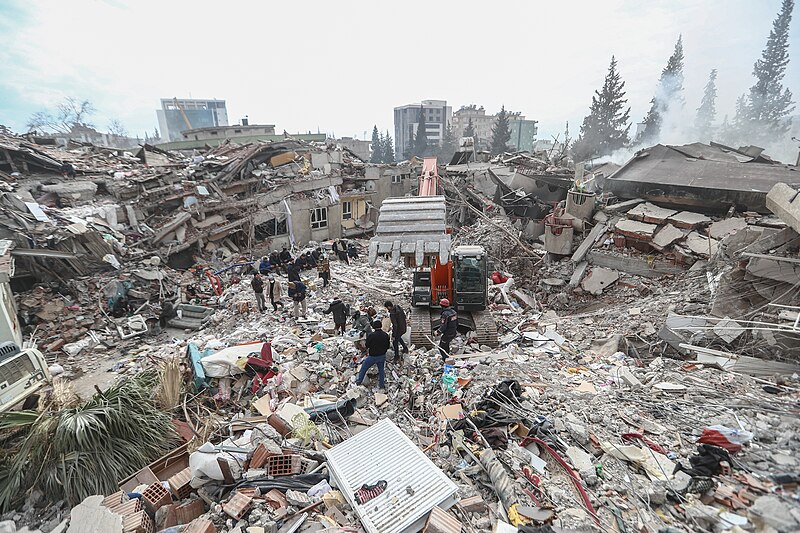
- Location: Turkey/Syria
- Year: 2023
- Economic cost: $84 billion
Hurricane Ida
- Location: U.S./Canada
- Year: 2021
- Economic cost: $82.4 billion
Hurricane Irma
- Location: U.S./Caribbean
- Year: 2017
- Economic cost: $60 billion
Hurricane Andrew
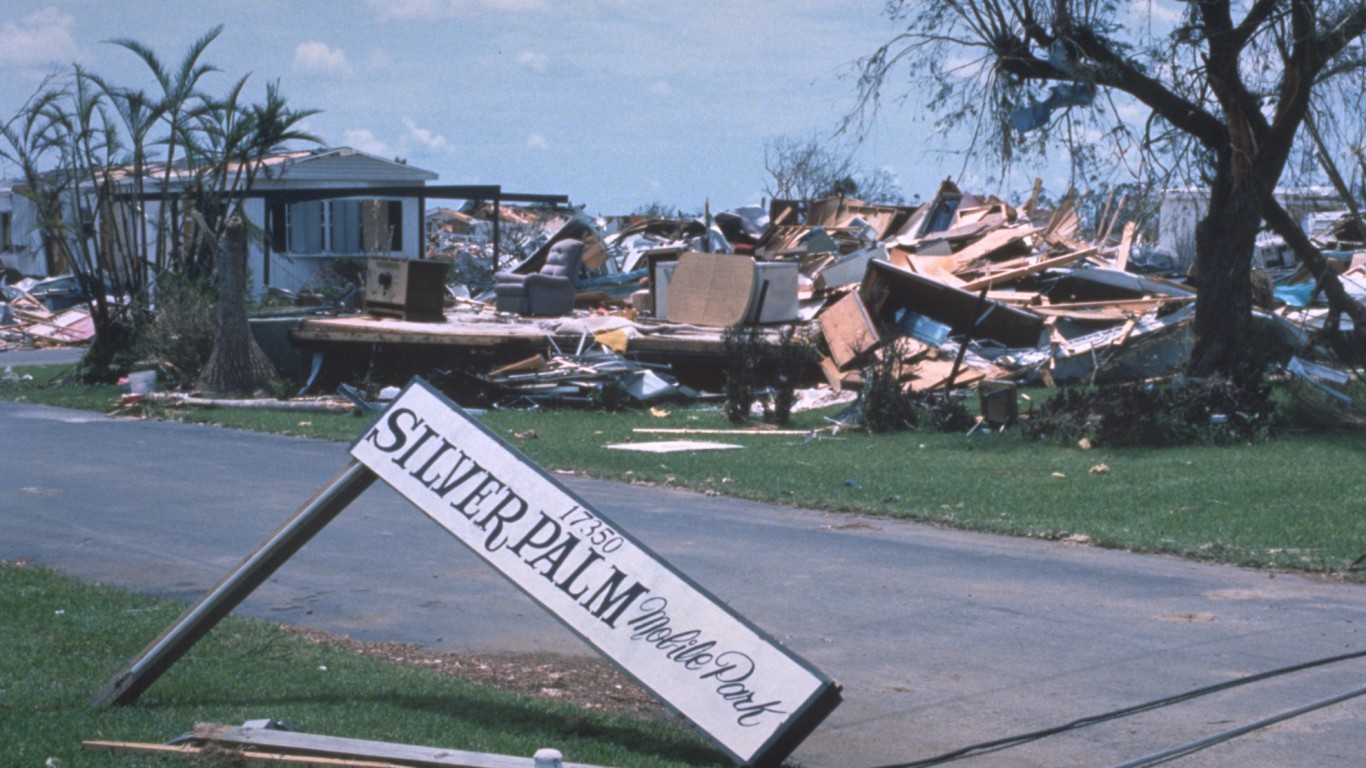
- Location: United States
- Year: 1992
- Economic cost: $58.9 billion
Flash floods
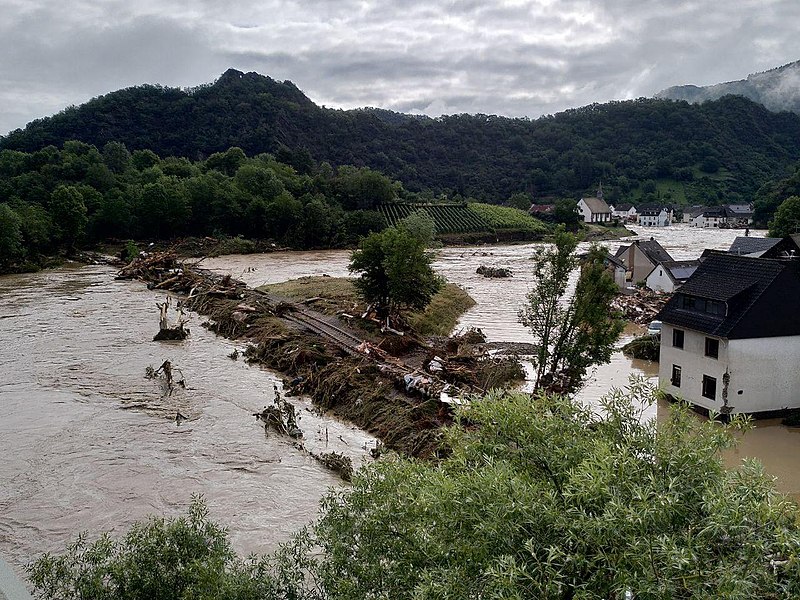
- Location: Europe
- Year: 2021
- Economic cost: $54 billion
Drought/heat wave
- Location: Most of U.S.
- Year: 1988
- Economic cost: $53 billion
Earthquake
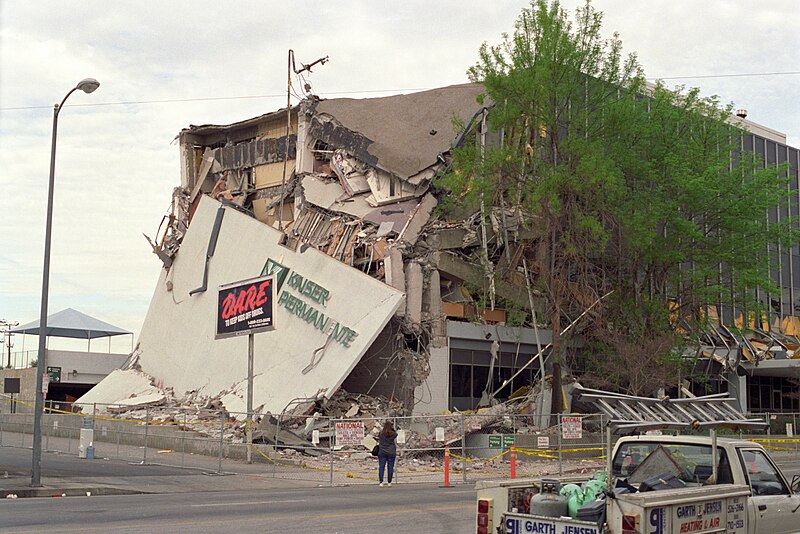
- Location: California
- Year: 1994
- Economic cost: $49 billion
Flood
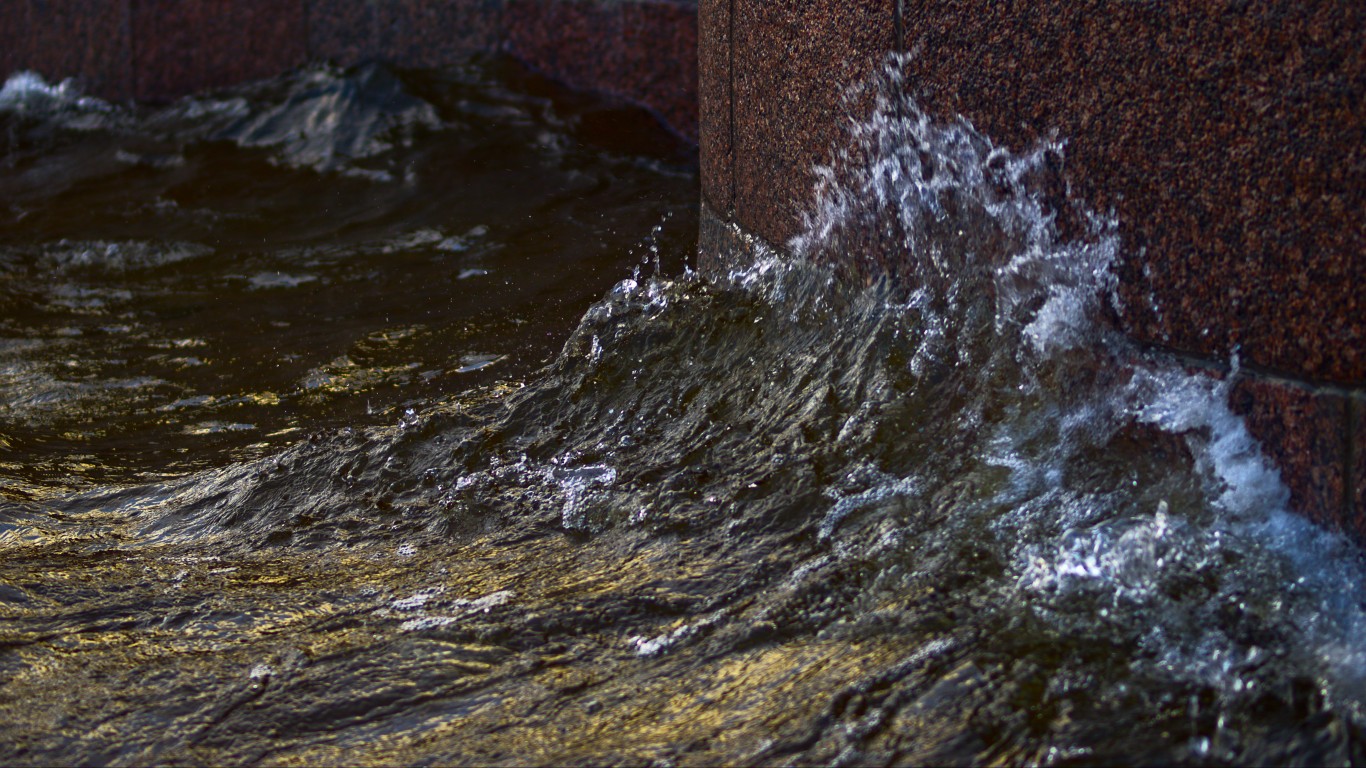
- Location: China
- Year: 1998
- Economic cost: $47 billion
Flood
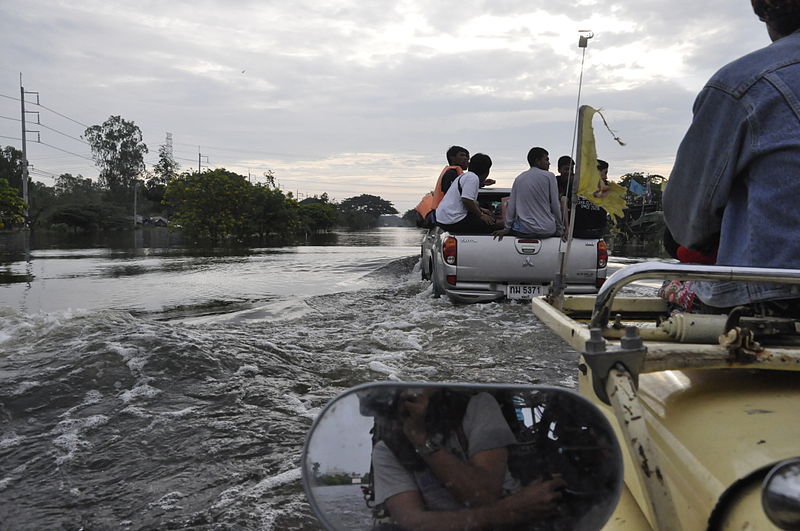
- Location: Thailand
- Year: 2011
- Economic cost: $45.5 billion
Flood
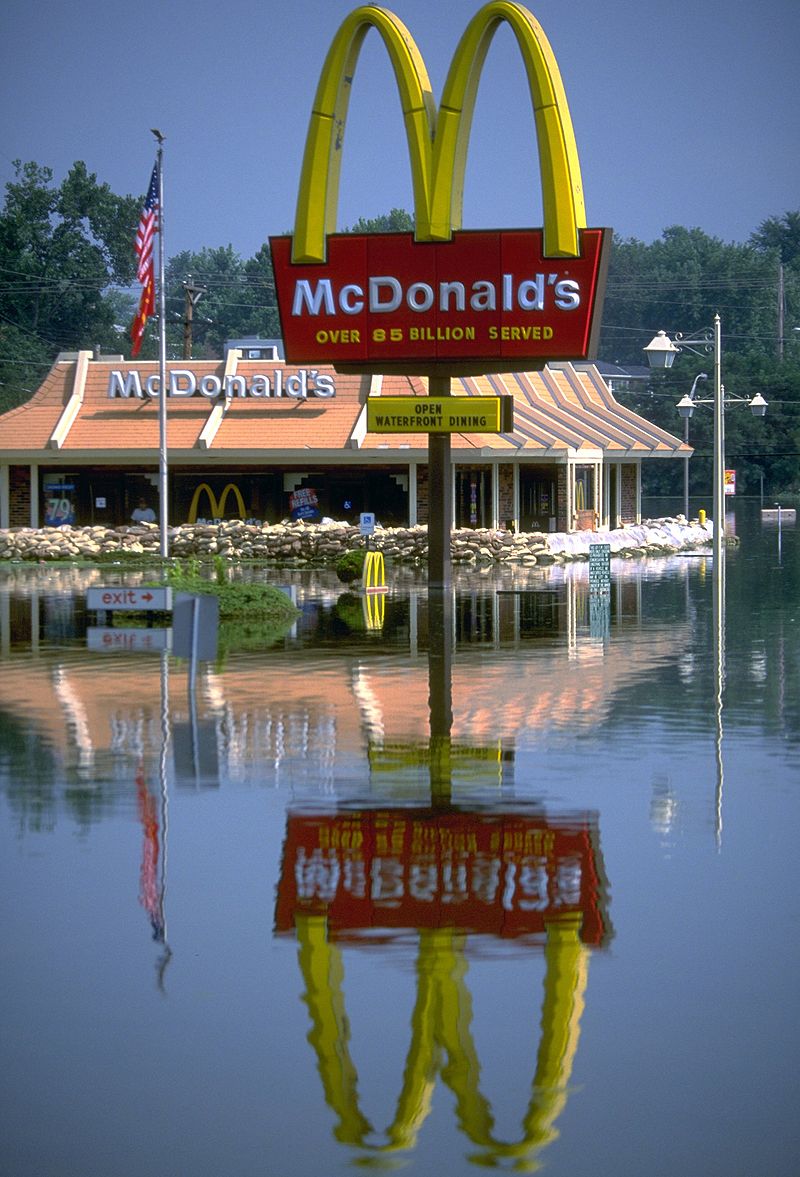
- Location: Midwest U.S.
- Year: 1993
- Economic cost: $45.1 billion
Hurricane Ike
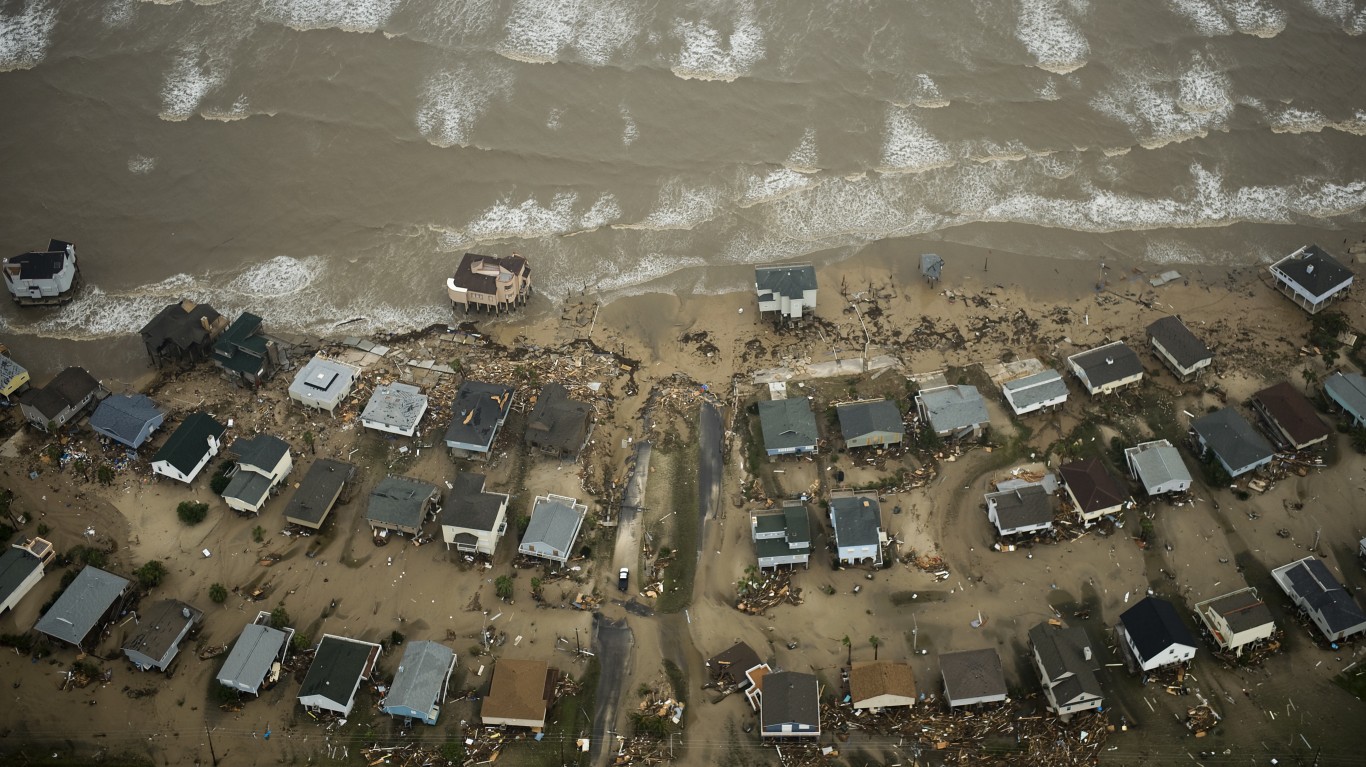
- Location: United States
- Year: 2008
- Economic cost: $42 billion
Drought/heat wave
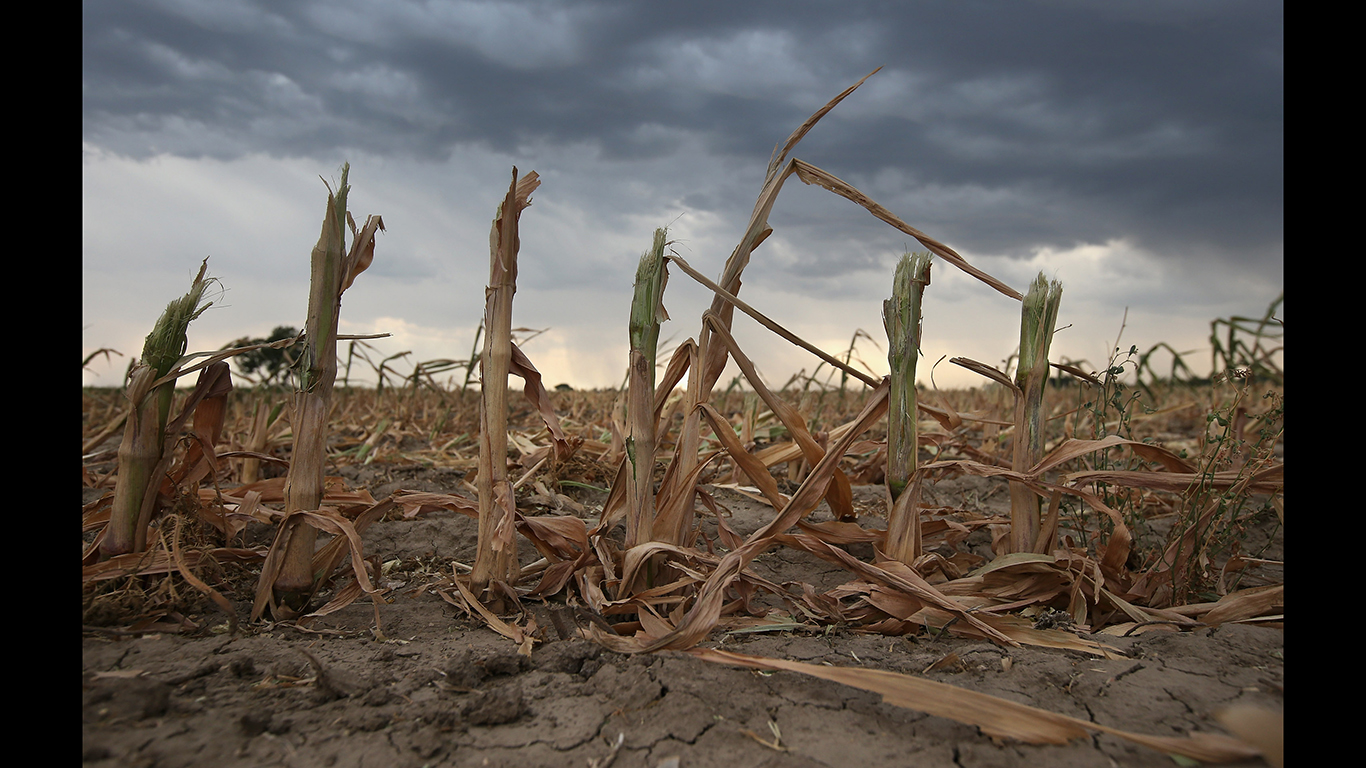
- Location: Half of U.S.
- Year: 2012
- Economic cost: $40.5 billion
Earthquake
- Location: Japan
- Year: 2004
- Economic cost: $40 billion
Drought/Heat wave
- Location: Central and eastern U.S.
- Year: 1980
- Economic cost: $39.6 billion
Hurricane Ivan
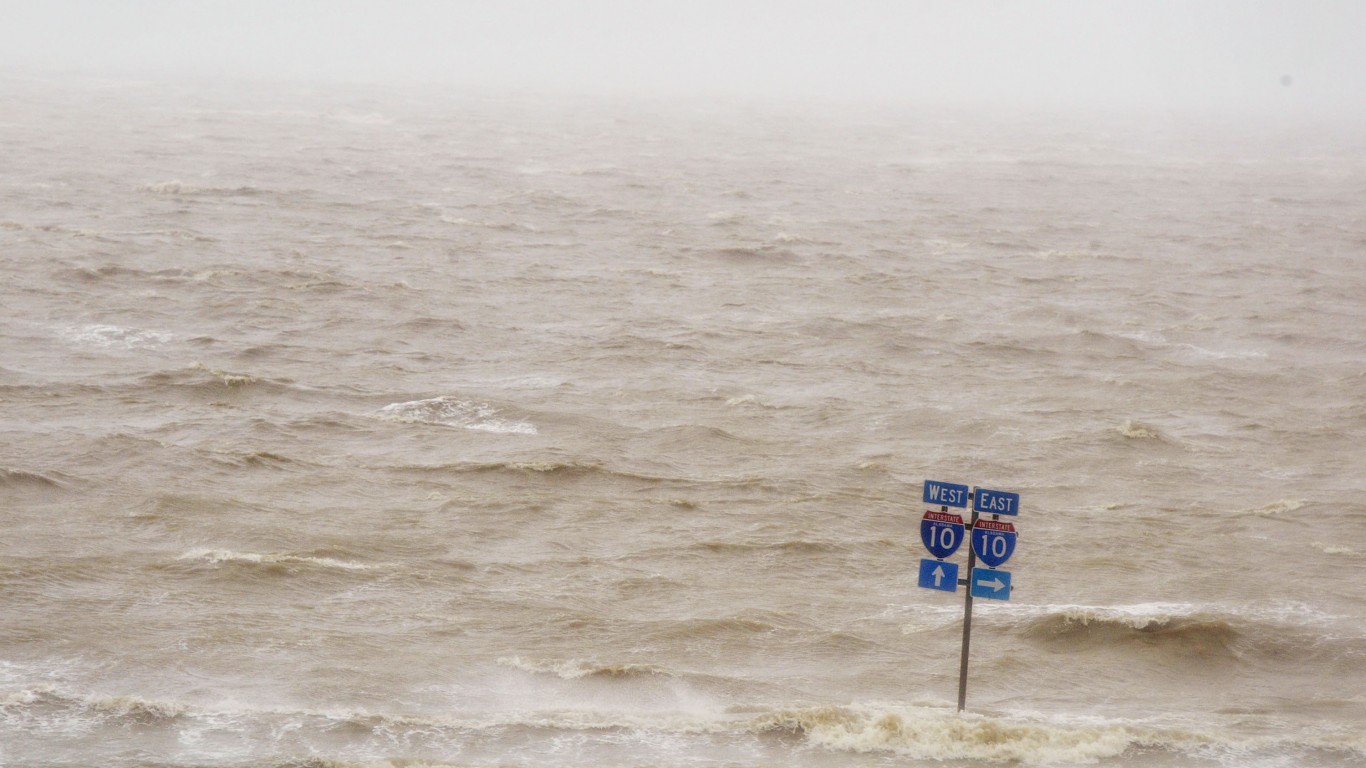
- Location: Southern U.S.
- Year: 2004
- Economic cost: $33.2 billion
Hurricane Michael
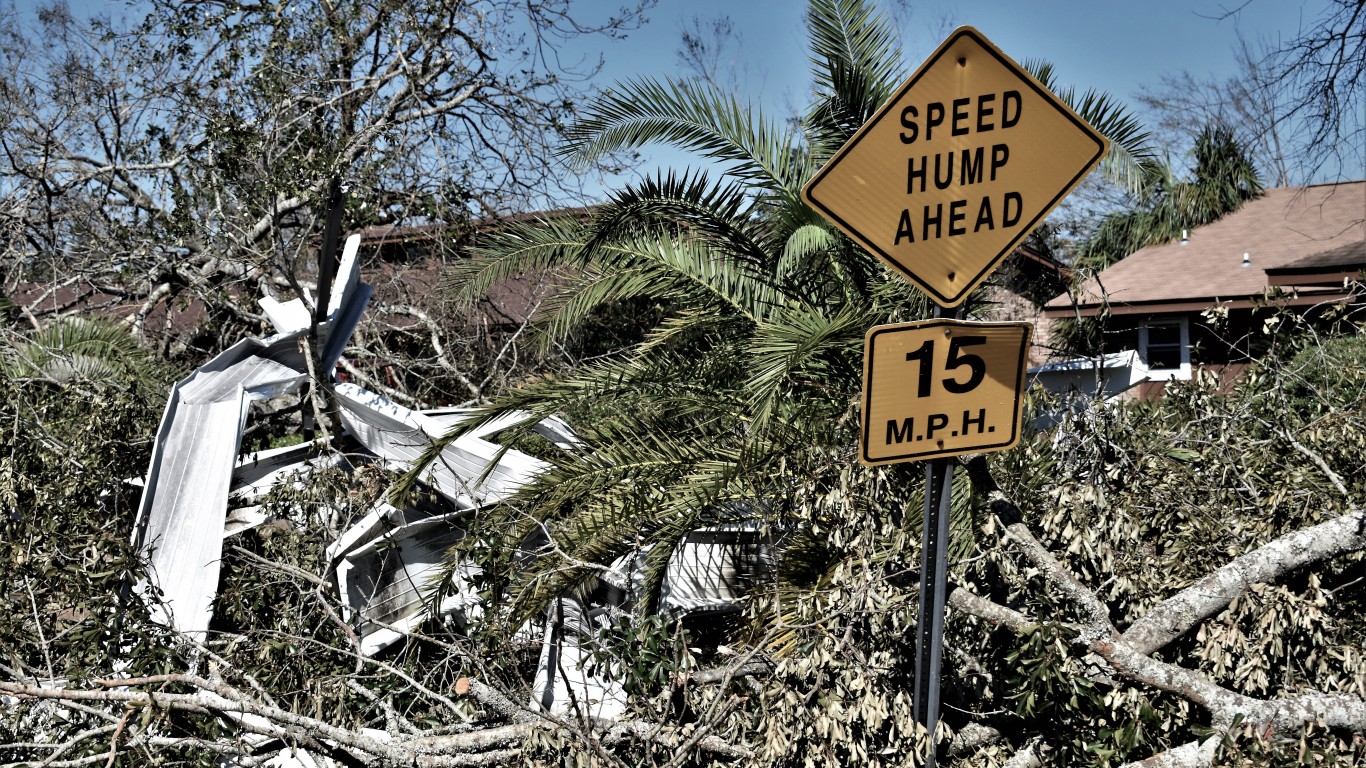
- Location: Florida
- Year: 2018
- Economic cost: $30.2 billion
In 20 Years, I Haven’t Seen A Cash Back Card This Good
After two decades of reviewing financial products I haven’t seen anything like this. Credit card companies are at war, handing out free rewards and benefits to win the best customers.
A good cash back card can be worth thousands of dollars a year in free money, not to mention other perks like travel, insurance, and access to fancy lounges.
Our top pick today pays up to 5% cash back, a $200 bonus on top, and $0 annual fee. Click here to apply before they stop offering rewards this generous.
Flywheel Publishing has partnered with CardRatings for our coverage of credit card products. Flywheel Publishing and CardRatings may receive a commission from card issuers.
Thank you for reading! Have some feedback for us?
Contact the 24/7 Wall St. editorial team.
