
Alcohol consumption has declined in many countries around the world since 2011, but has shown worrisome increases in others, according to a new report from the Organization for Economic Co-operation and Development, a 38-country intergovernmental organization based in France.
“Alcohol use is a leading cause of death and disability worldwide, particularly among those of working age,” according to the OECD. “High alcohol intake is a major risk factor for heart diseases and strokes, liver cirrhosis and certain cancers, but even low and moderate alcohol consumption increases the long-term risk of these diseases. Alcohol also contributes to more car crashes and injuries, violence, homicides, suicides and mental health disorders than any other psychoactive substance, particularly among young people.” (These are 25 famous people who drank themselves to death.)
The organization drew data from national sources in the countries concerned, defining alcohol consumption in terms of annual sales of pure alcohol per person aged 15 and over. (Consumption in Luxembourg was estimated using average figures from France and Germany.) The most current data is mostly from 2021, but exceptions are noted in the list that follows. (By way of comparison, these are the drunkest states in America.)
The (slightly) good news is that average consumption across all OECD member countries was 8.6 liters per person, down slightly from 8.9 liters in 2011. The Baltic nation of Latvia showed the biggest jump, from 10.1 liters in 2011 to 12.2 in 2021. Its neighbor Lithuania, on the other hand, showed the most dramatic decline of any country, sinking from 14.7 liters in 2011 to 12.1 in 2021.
In two countries particularly famous for their imbibing, consumption also dropped considerably. Ireland went from 11.7 liters per person in 2011 to 9.5 liters in 2021 – the second-biggest decline after Lithuania’s – while in France, the rate sank from 12.4 to 10.5 liters.
In order to combat alcohol abuse, the OECD recommends that nations implement a so-called “PPPP” strategy, which it defines as “pricing policies to limit affordability of cheap alcohol, policing to counter drink-driving, primary care-based counseling for people with harmful patterns of alcohol use, and protecting children from alcohol promotion.”
Here are the booziest countries on earth.
25. New Zealand
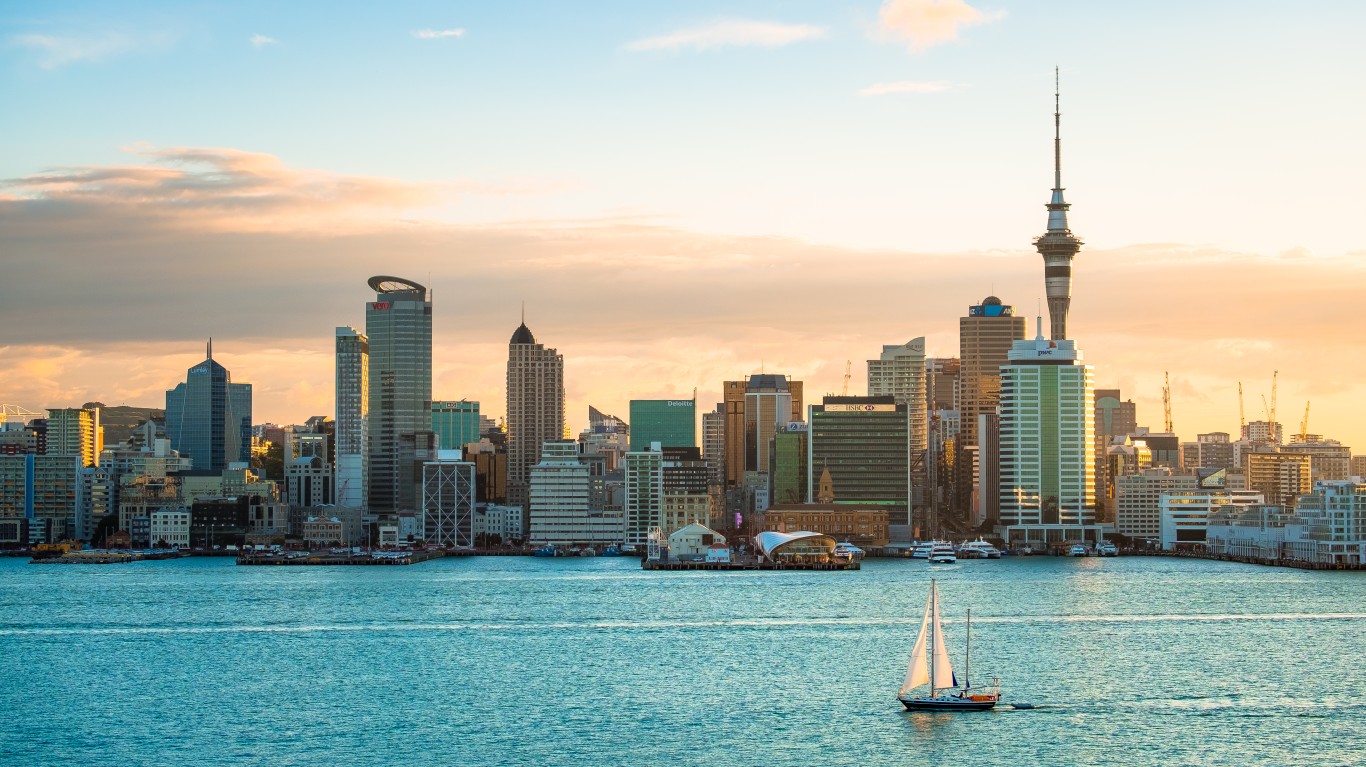
- Alcohol consumption (15 and over) in liters per capita, 2011: 9.5
- Alcohol consumption (15 and over) in liters per capita, 2021: 8.8
24. Belgium

- Alcohol consumption (15 and over) in liters per capita, 2011: 10.1
- Alcohol consumption (15 and over) in liters per capita, 2019: 9.2
23. Australia

- Alcohol consumption (15 and over) in liters per capita, 2011: 10.2
- Alcohol consumption (15 and over) in liters per capita, 2017: 9.5
22. Ireland
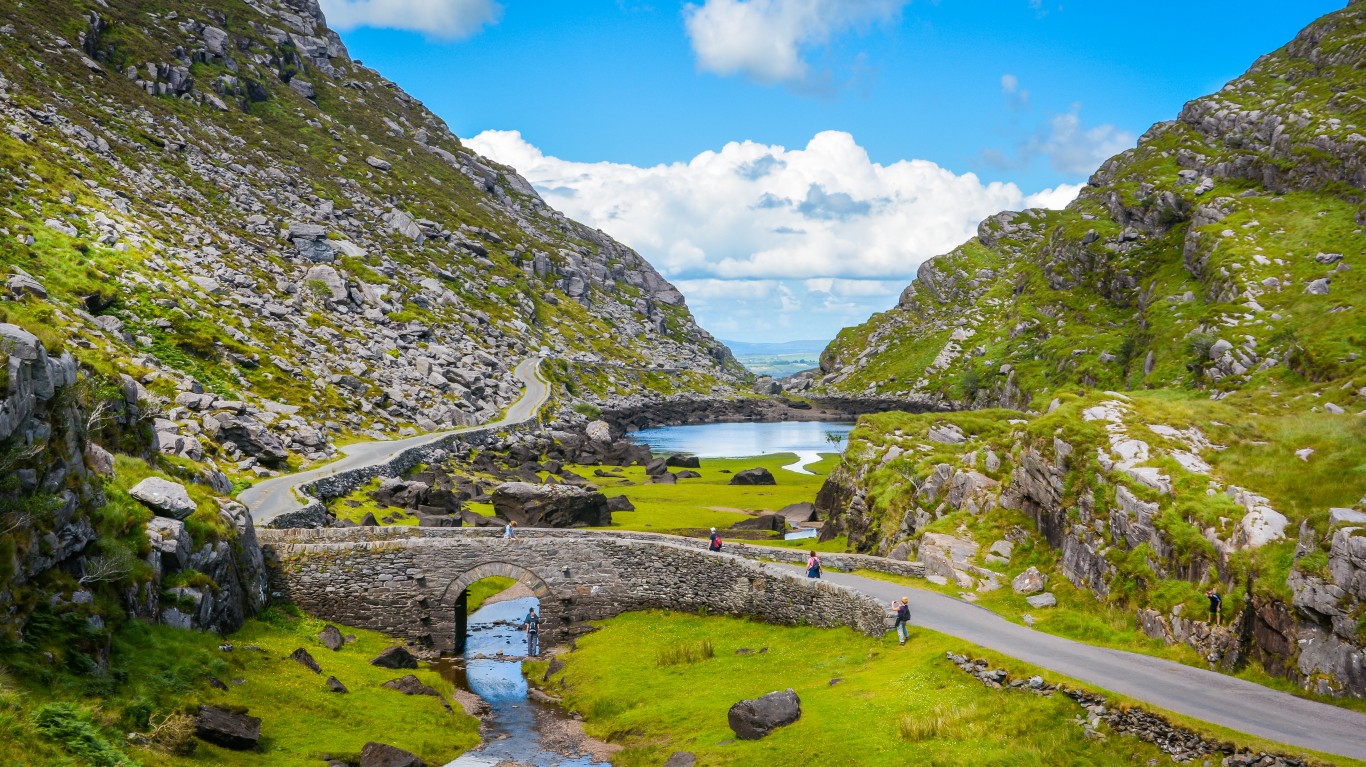
- Alcohol consumption (15 and over) in liters per capita, 2011: 11.7
- Alcohol consumption (15 and over) in liters per capita, 2021: 9.5
21. United States

- Alcohol consumption (15 and over) in liters per capita, 2011: 8.7
- Alcohol consumption (15 and over) in liters per capita, 2021: 9.5
20. Slovak Republic
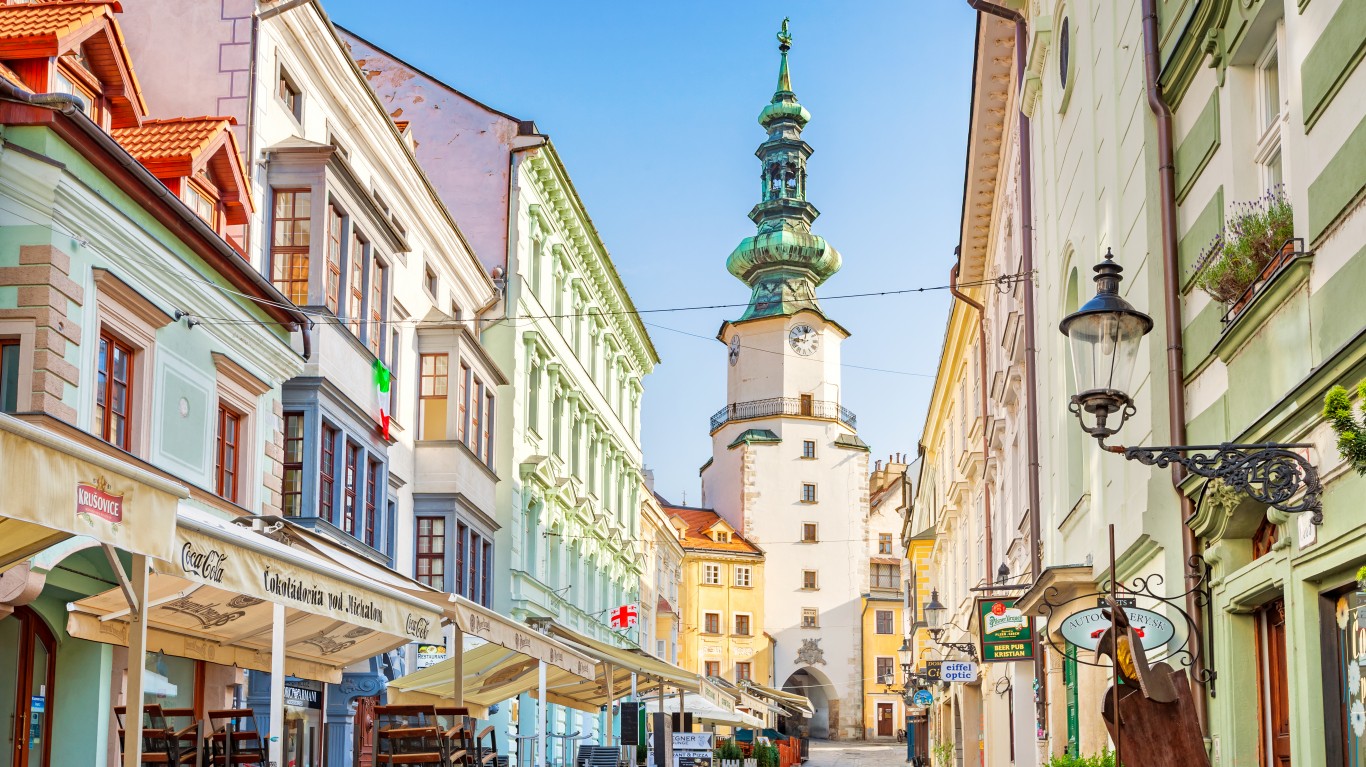
- Alcohol consumption (15 and over) in liters per capita, 2011: 10.2
- Alcohol consumption (15 and over) in liters per capita, 2021: 9.6
19. Croatia
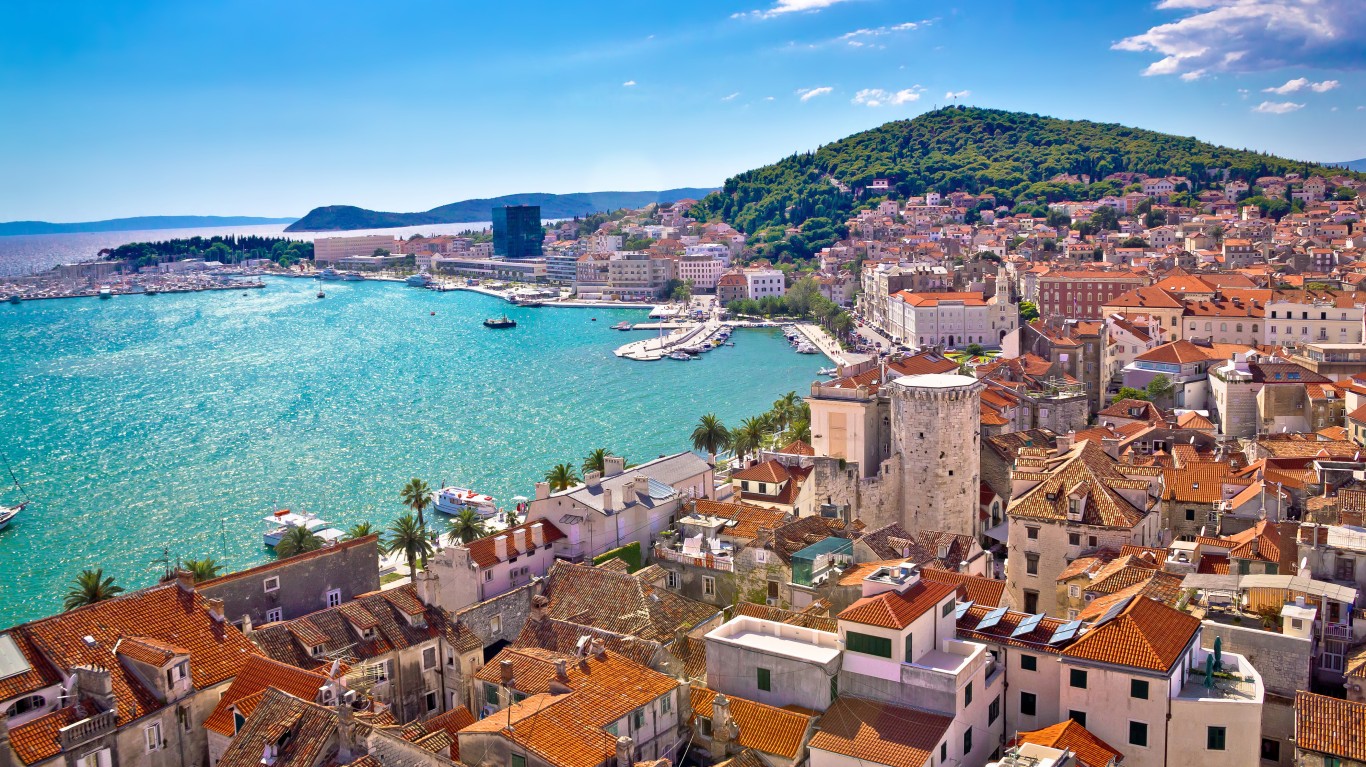
- Alcohol consumption (15 and over) in liters per capita, 2011: 11
- Alcohol consumption (15 and over) in liters per capita, 2019: 9.6
18. Brazil
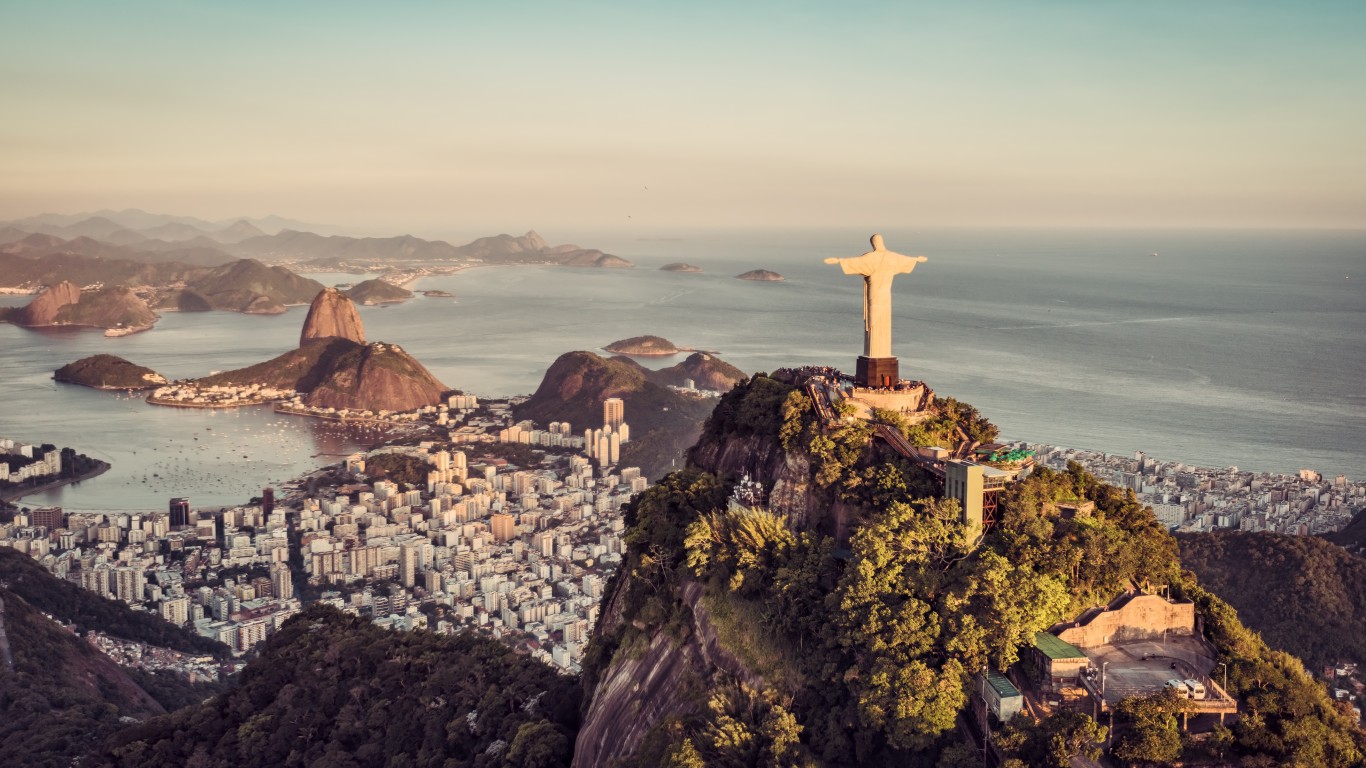
- Alcohol consumption (15 and over) in liters per capita, 2011: 9.2
- Alcohol consumption (15 and over) in liters per capita, 2021: 9.8
17. United Kingdom
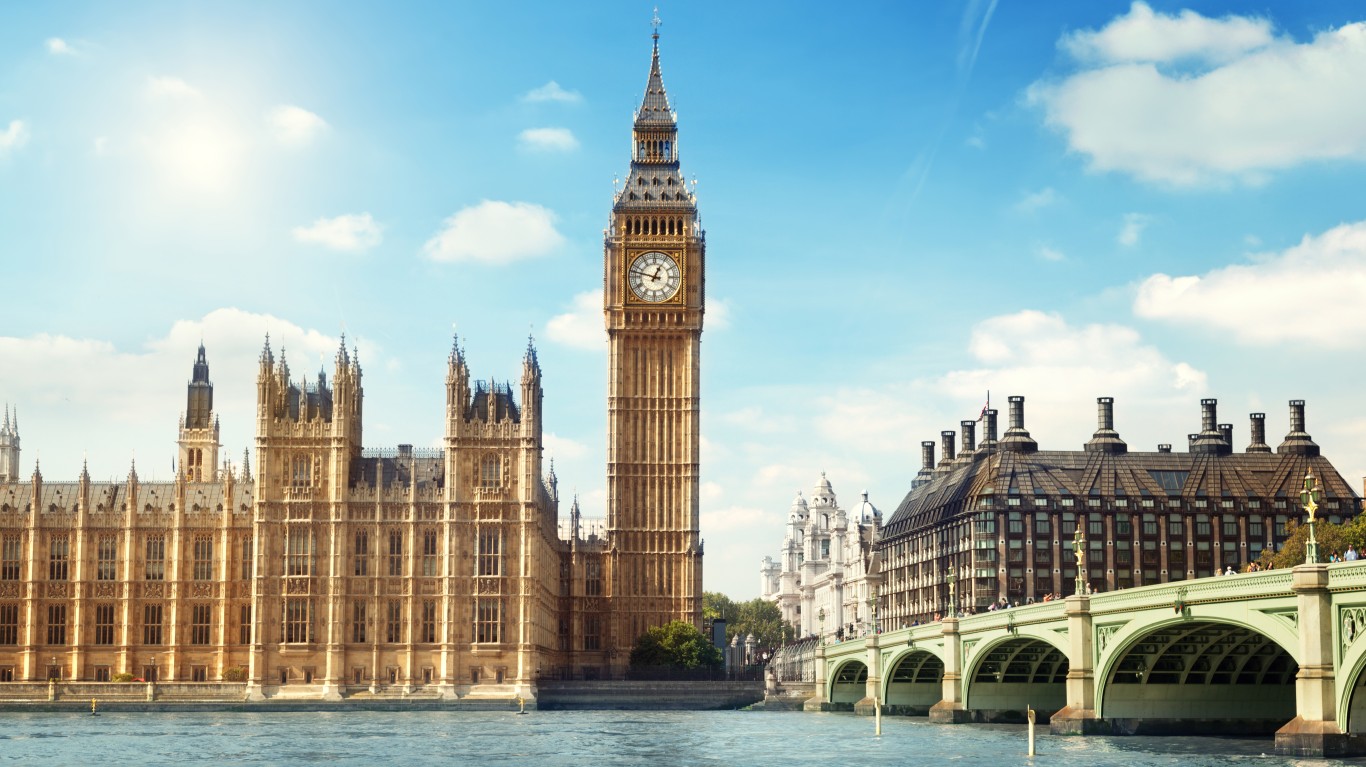
- Alcohol consumption (15 and over) in liters per capita, 2011: 9.9
- Alcohol consumption (15 and over) in liters per capita, 2021: 10
16. Denmark
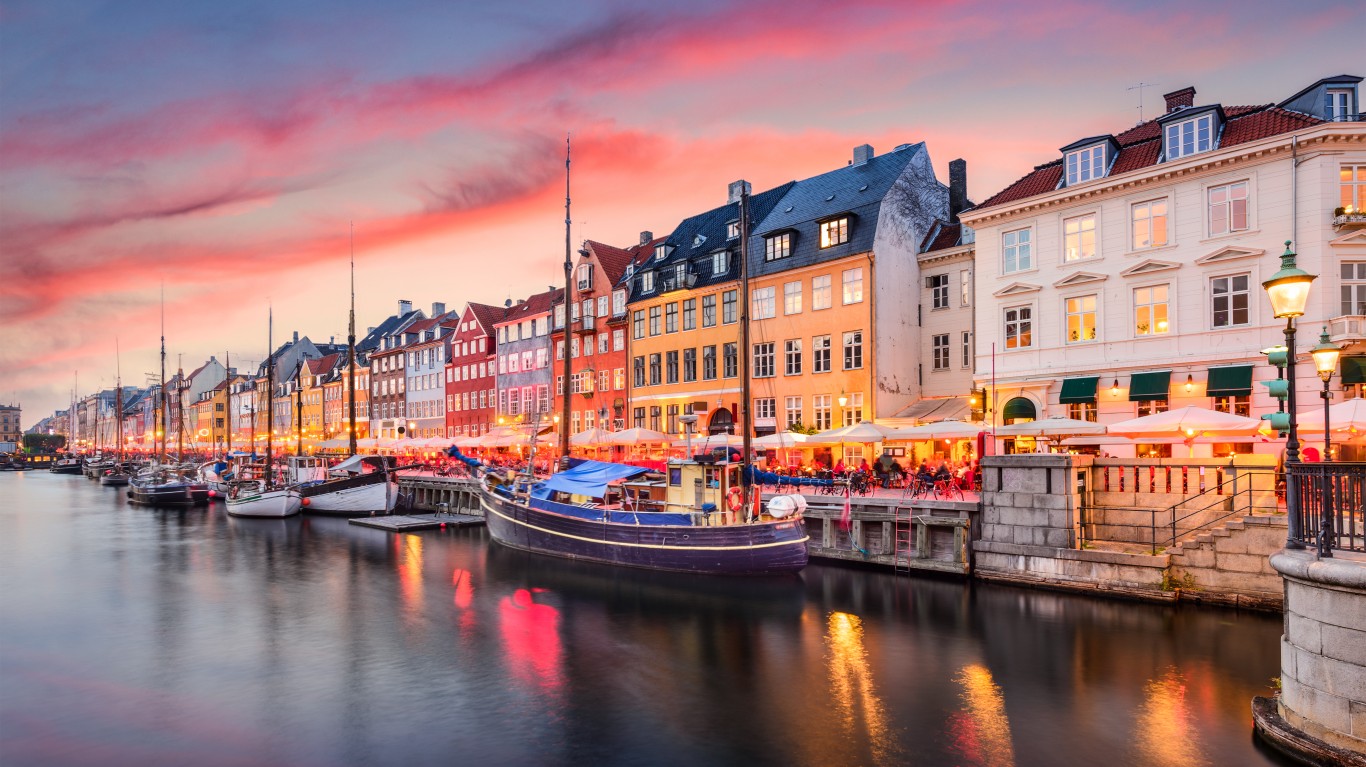
- Alcohol consumption (15 and over) in liters per capita, 2011: 11
- Alcohol consumption (15 and over) in liters per capita, 2021: 10.4
15. Hungary
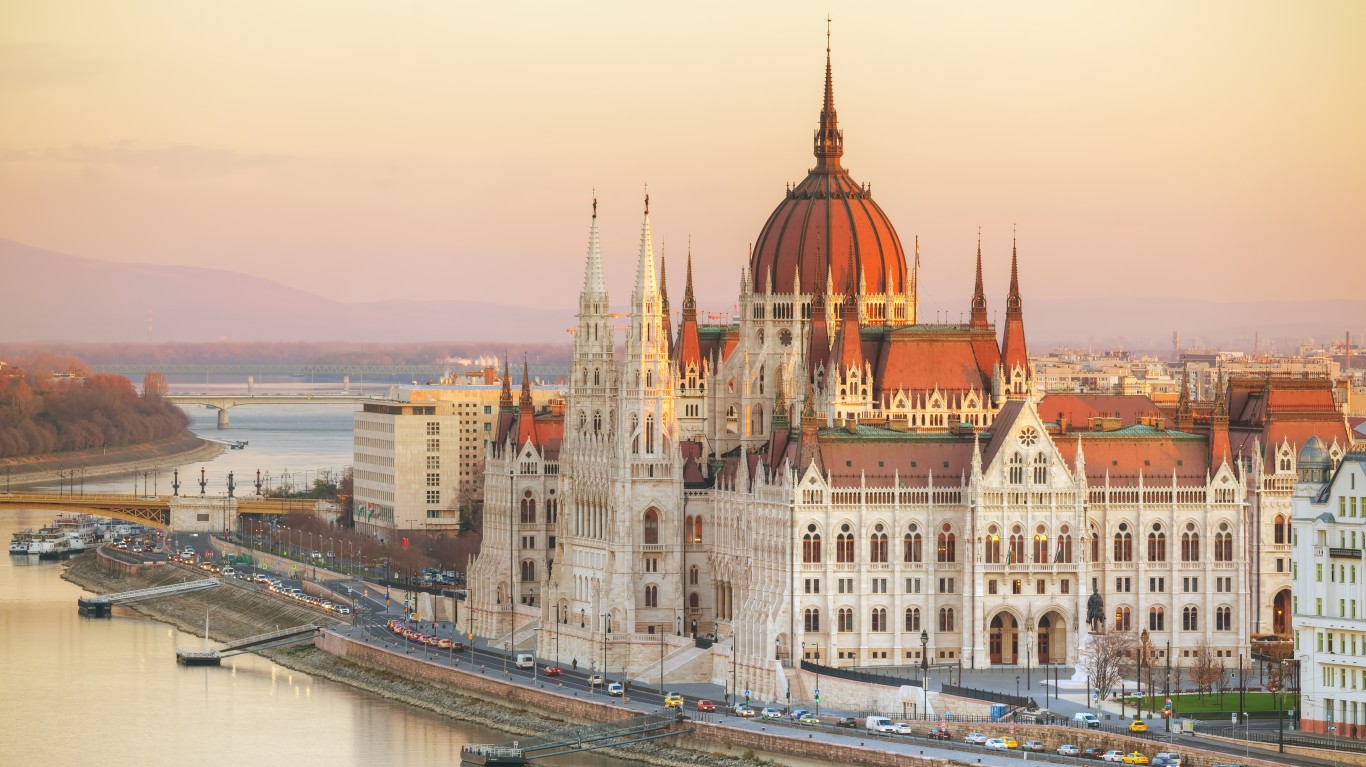
- Alcohol consumption (15 and over) in liters per capita, 2011: 11.4
- Alcohol consumption (15 and over) in liters per capita, 2021: 10.4
14. Portugal
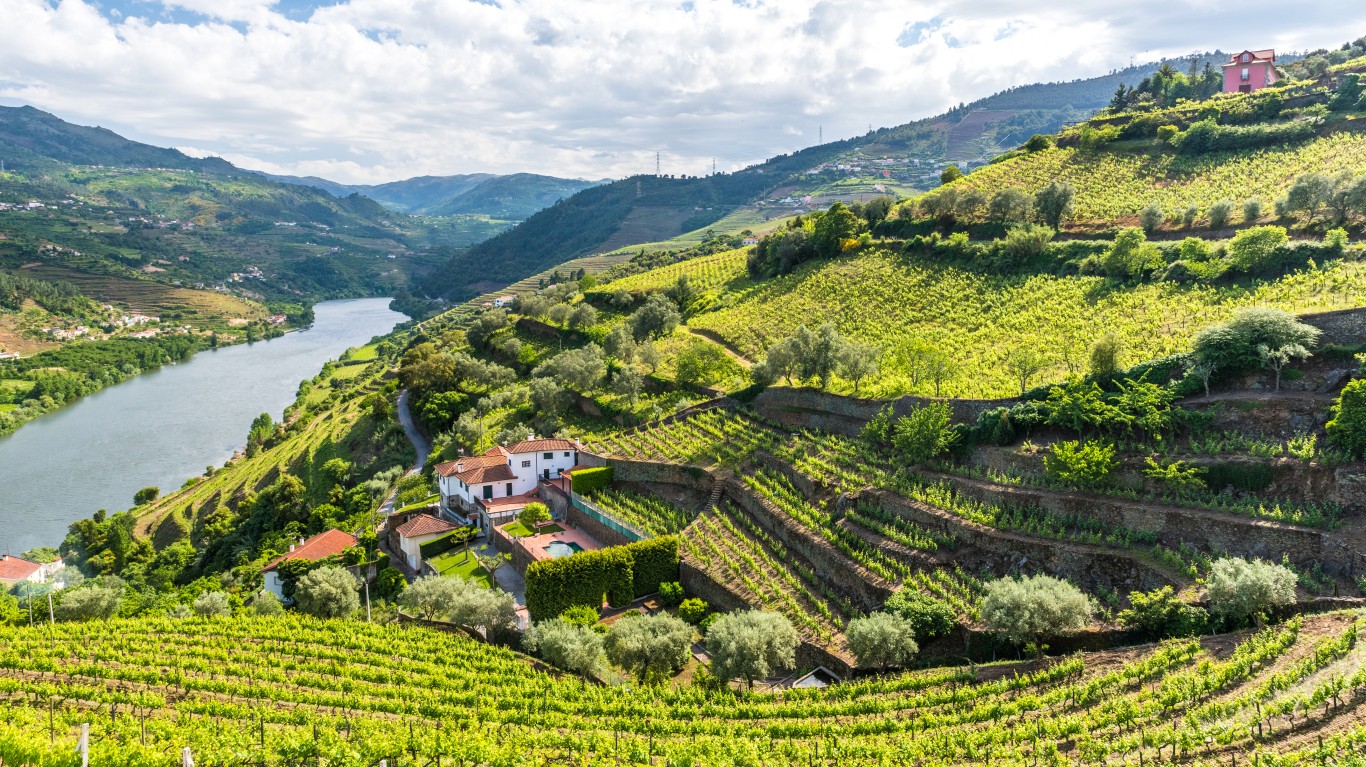
- Alcohol consumption (15 and over) in liters per capita, 2011: 10.9
- Alcohol consumption (15 and over) in liters per capita, 2019: 10.4
13. France

- Alcohol consumption (15 and over) in liters per capita, 2011: 12.4
- Alcohol consumption (15 and over) in liters per capita, 2021: 10.5
12. Spain

- Alcohol consumption (15 and over) in liters per capita, 2011: 9.6
- Alcohol consumption (15 and over) in liters per capita, 2021: 10.5
11. Germany
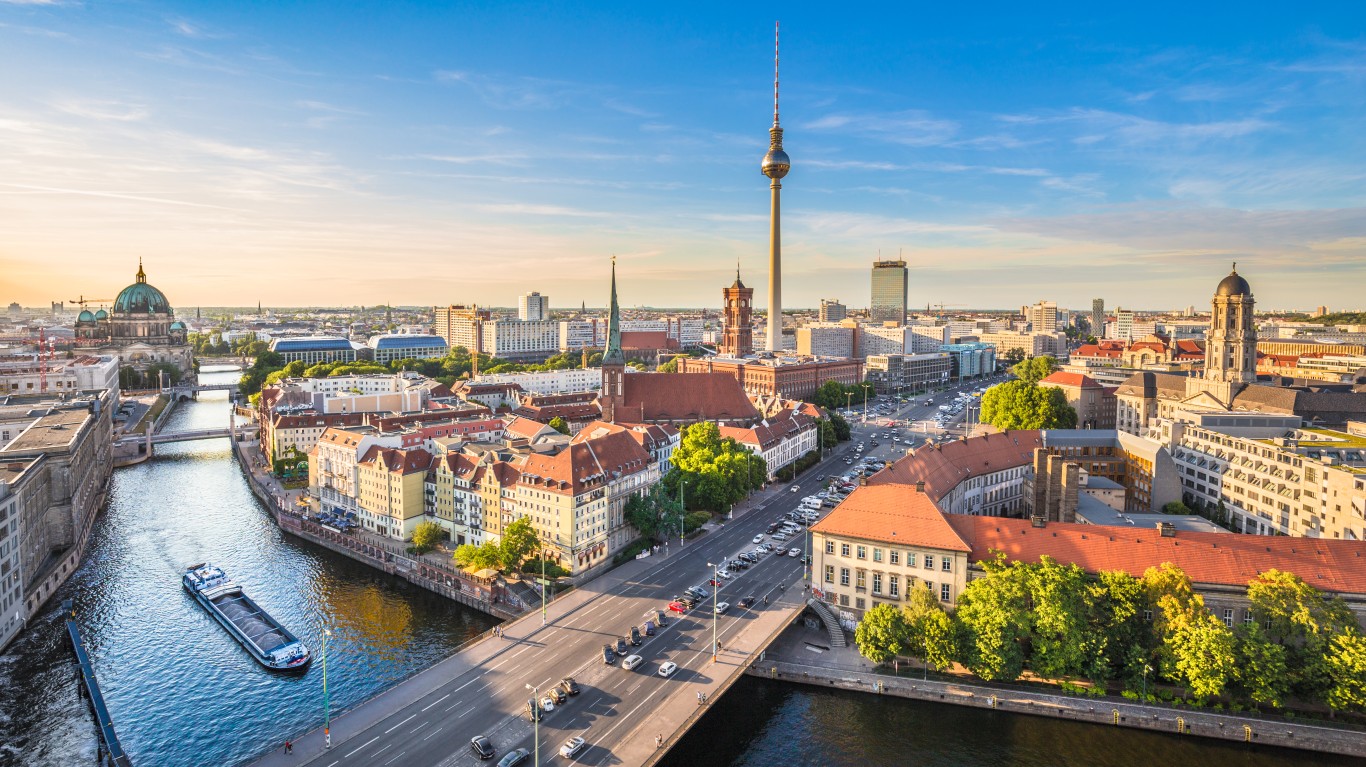
- Alcohol consumption (15 and over) in liters per capita, 2011: 11.3
- Alcohol consumption (15 and over) in liters per capita, 2019: 10.6
10. Slovenia
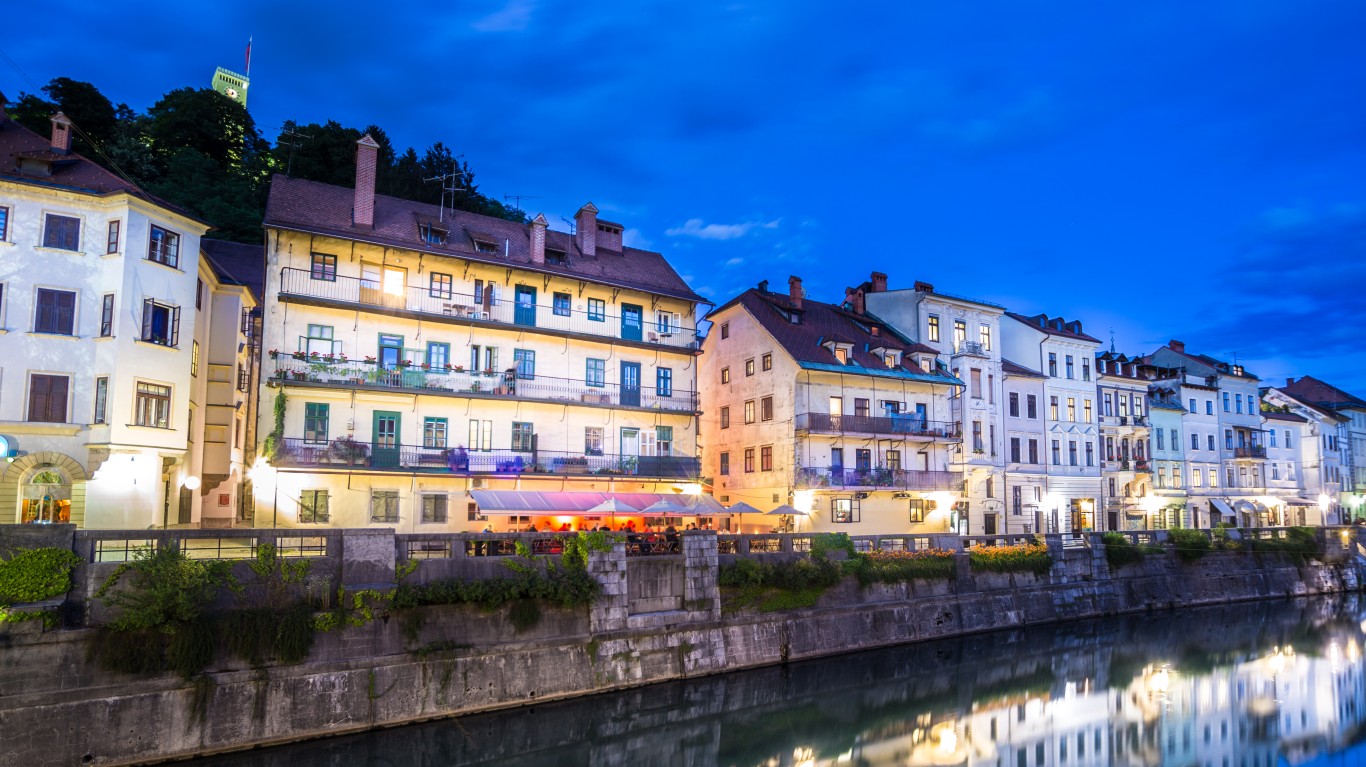
- Alcohol consumption (15 and over) in liters per capita, 2011: 10.6
- Alcohol consumption (15 and over) in liters per capita, 2021: 10.6
9. Luxembourg

- Alcohol consumption (15 and over) in liters per capita, 2011: 11.8
- Alcohol consumption (15 and over) in liters per capita, 2019: 11
8. Poland
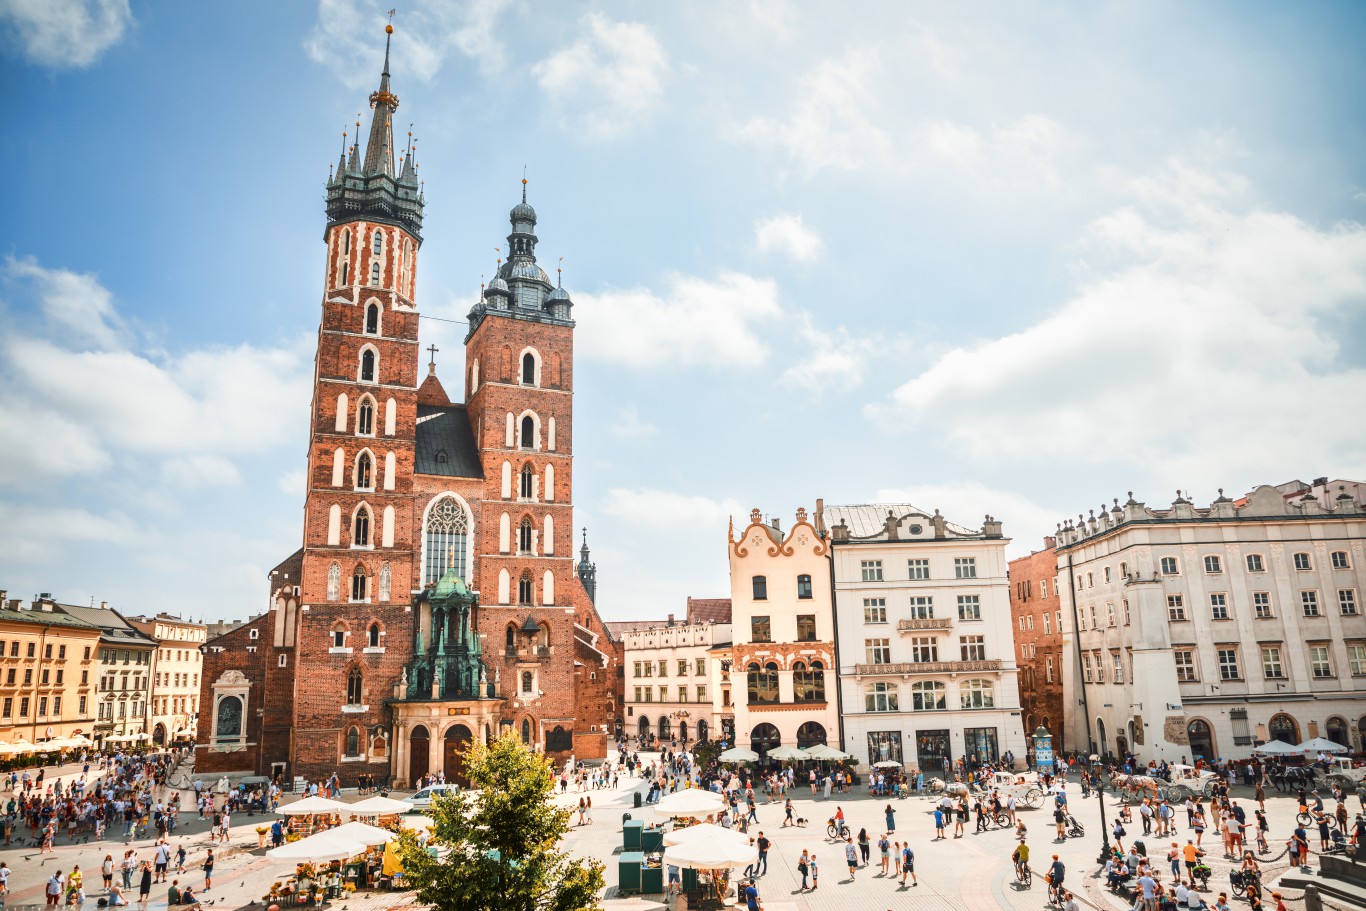
- Alcohol consumption (15 and over) in liters per capita, 2011: 10.3
- Alcohol consumption (15 and over) in liters per capita, 2021: 11
7. Romania
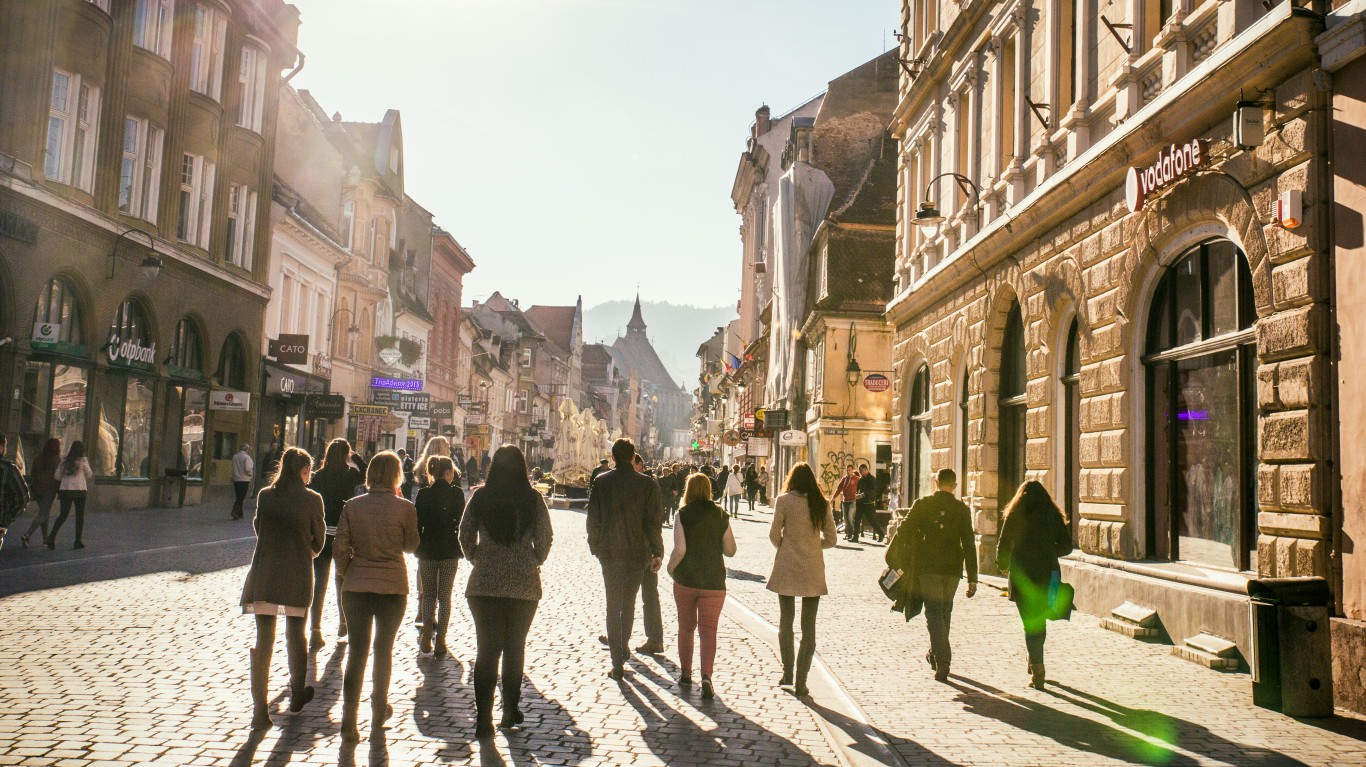
- Alcohol consumption (15 and over) in liters per capita, 2011: 9.6
- Alcohol consumption (15 and over) in liters per capita, 2019: 11
6. Austria
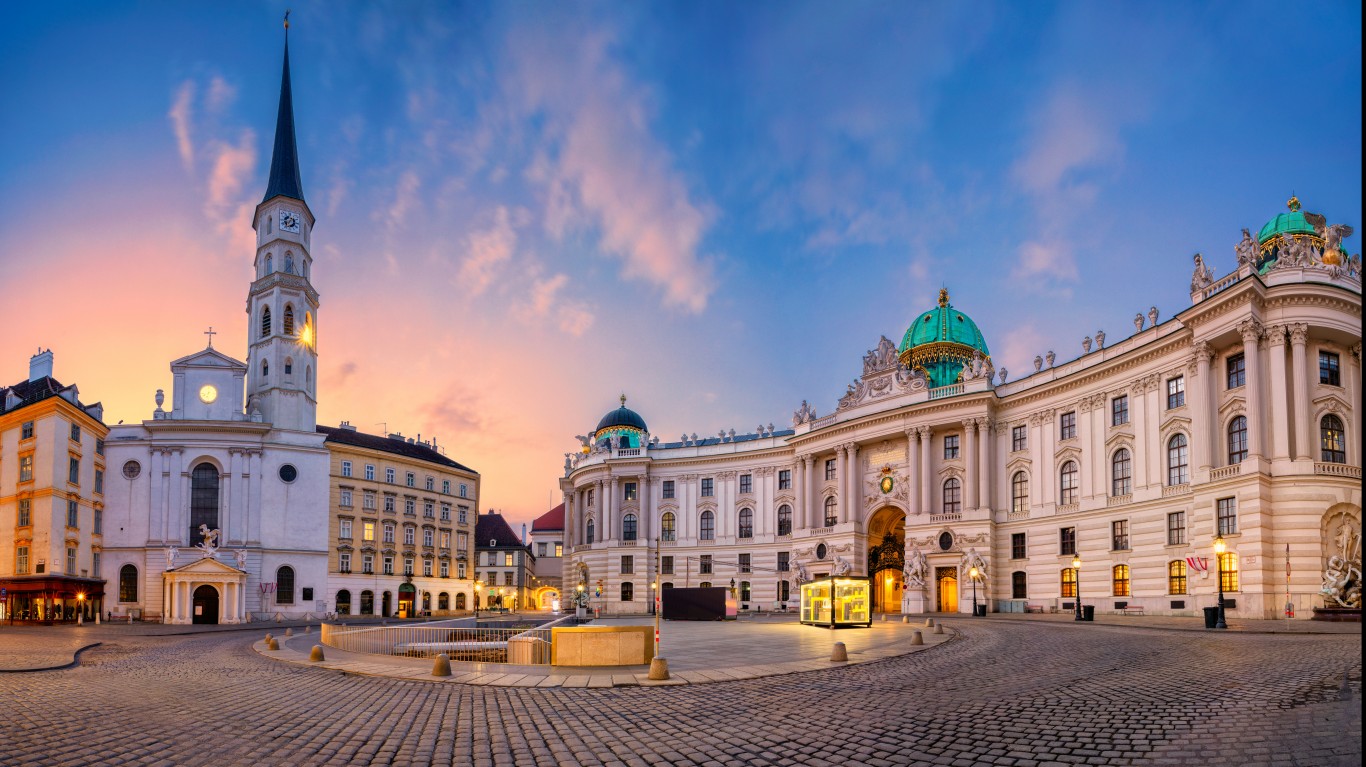
- Alcohol consumption (15 and over) in liters per capita, 2011: 11.9
- Alcohol consumption (15 and over) in liters per capita, 2021: 11.1
5. Estonia
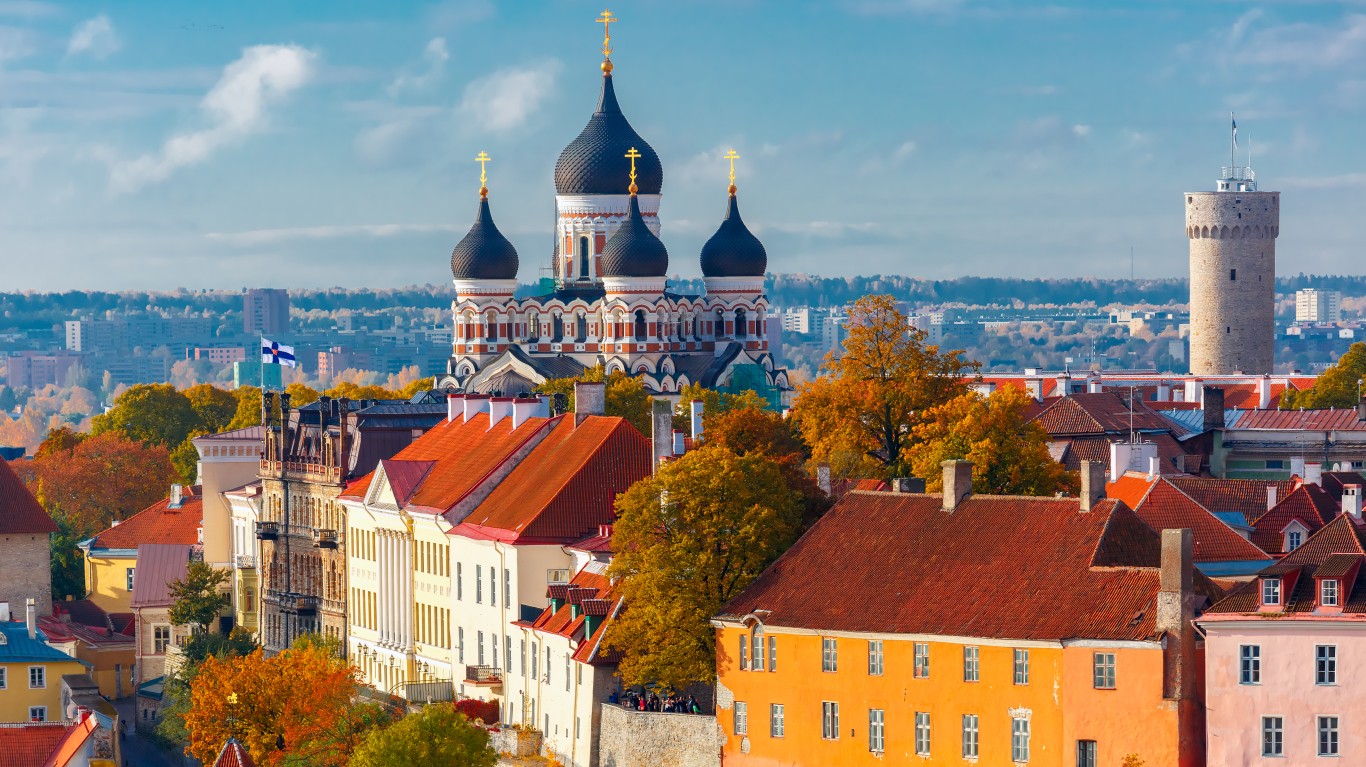
- Alcohol consumption (15 and over) in liters per capita, 2011: 12
- Alcohol consumption (15 and over) in liters per capita, 2021: 11.1
4. Bulgaria

- Alcohol consumption (15 and over) in liters per capita, 2011: 9.9
- Alcohol consumption (15 and over) in liters per capita, 2019: 11.2
3. Czech Republic
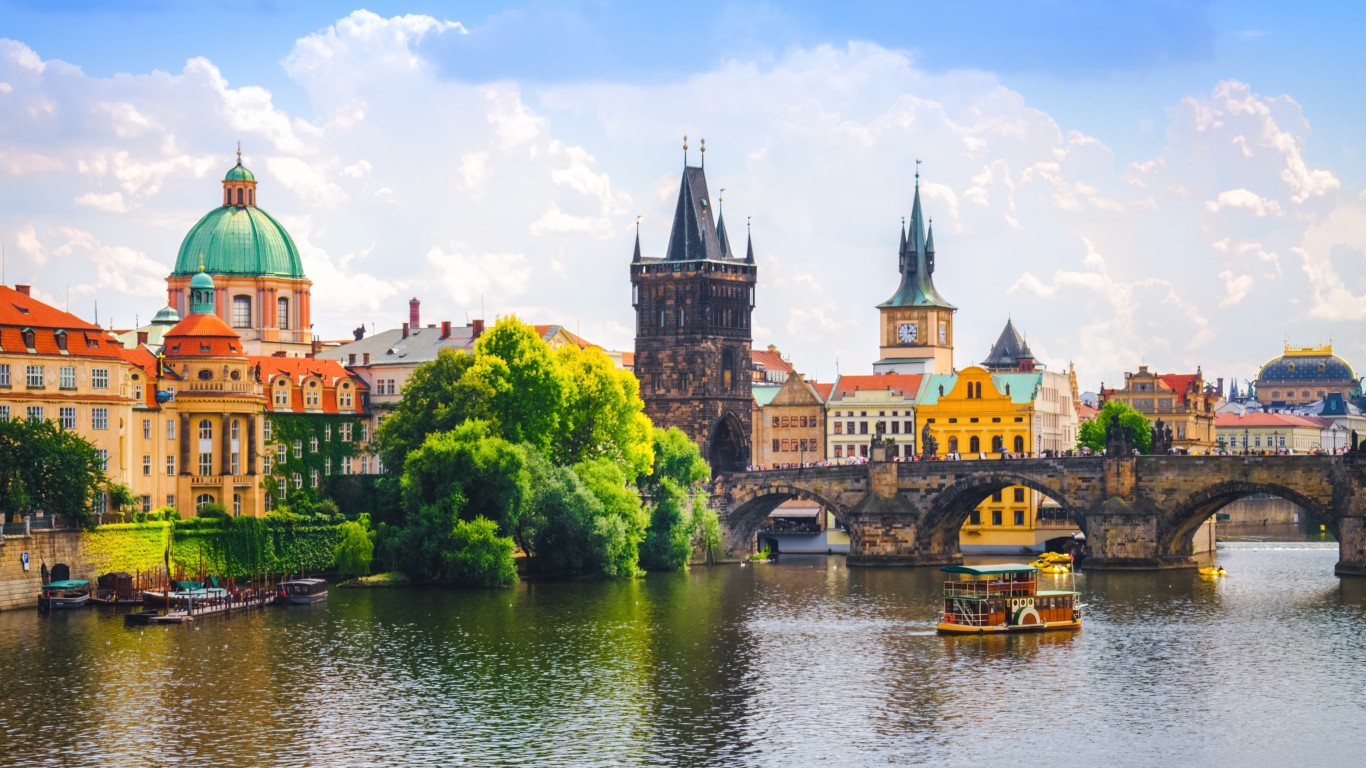
- Alcohol consumption (15 and over) in liters per capita, 2011: 11.5
- Alcohol consumption (15 and over) in liters per capita, 2021: 11.6
2. Lithuania
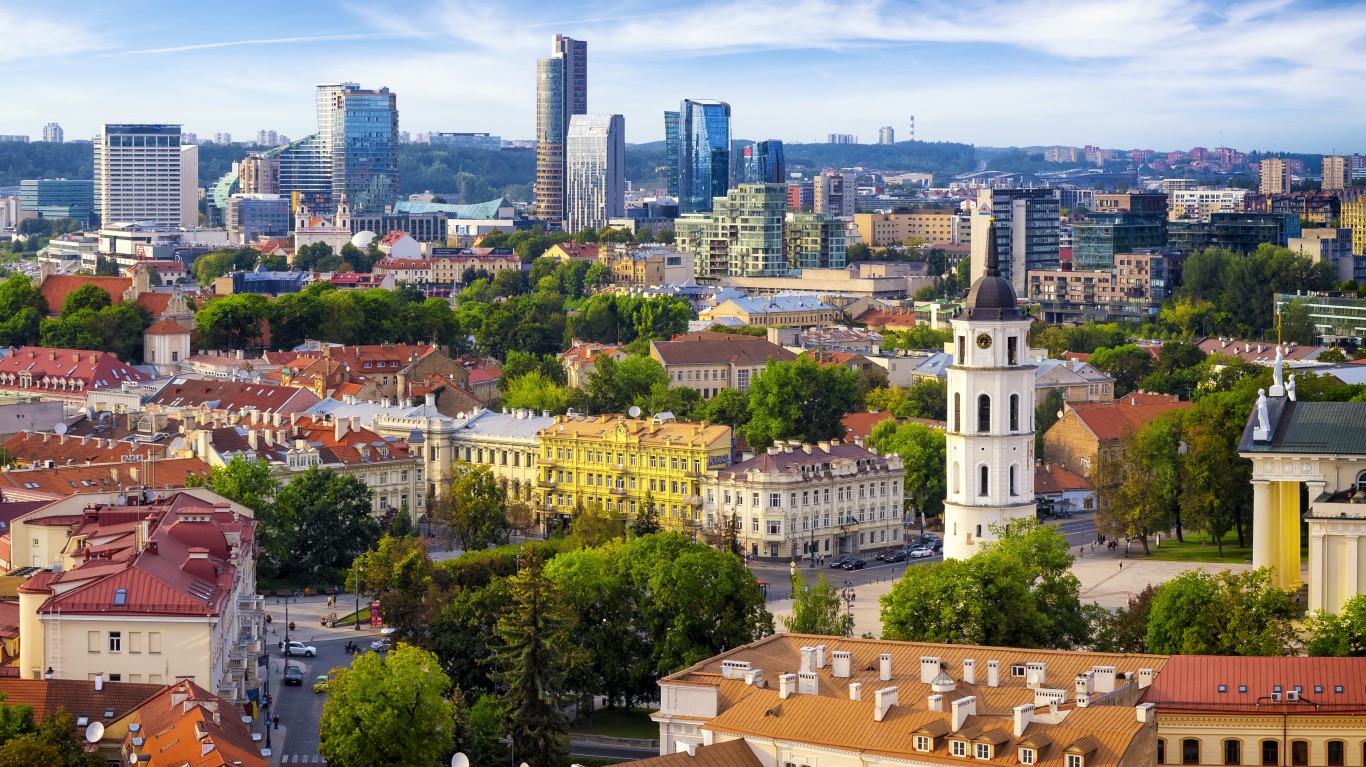
- Alcohol consumption (15 and over) in liters per capita, 2011: 14.7
- Alcohol consumption (15 and over) in liters per capita, 2021: 12.1
1. Latvia
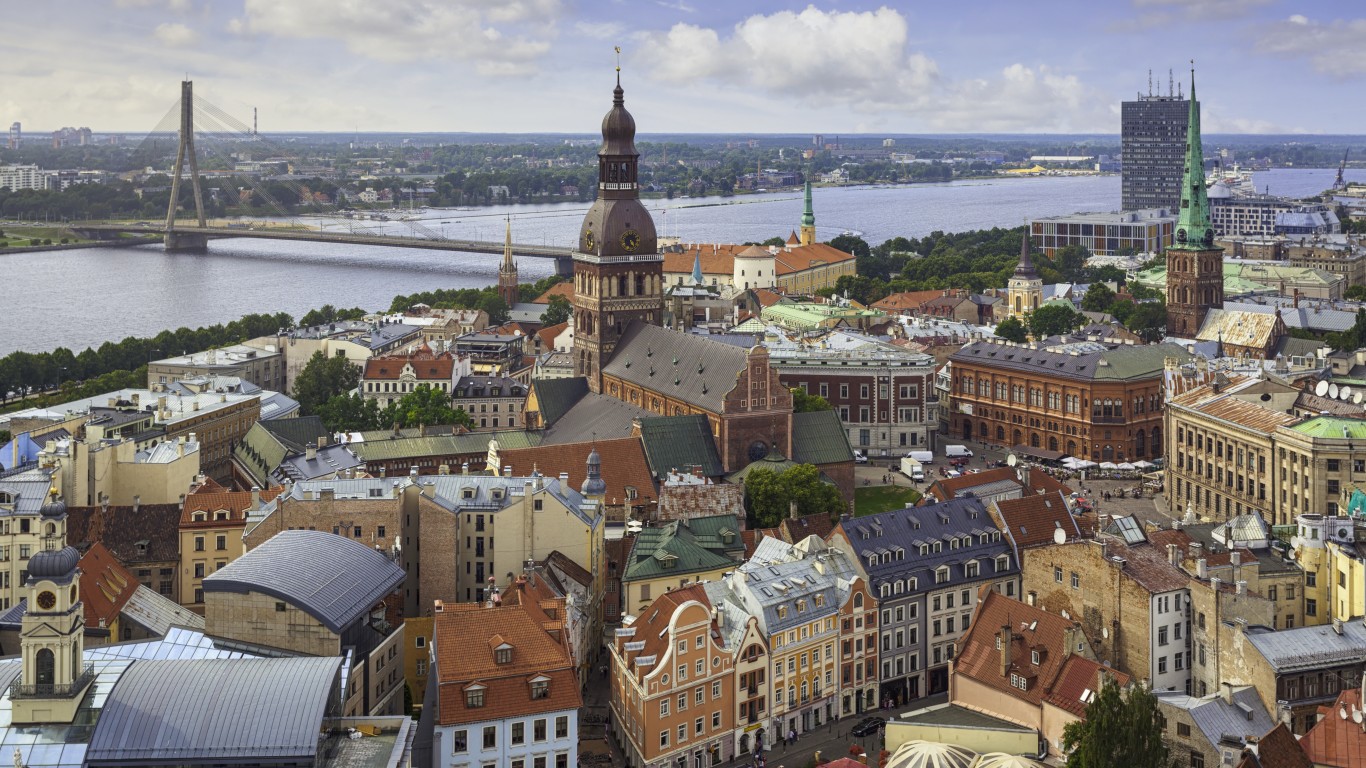
- Alcohol consumption (15 and over) in liters per capita, 2011: 10.1
- Alcohol consumption (15 and over) in liters per capita, 2021: 12.2
It’s Your Money, Your Future—Own It (sponsor)
Retirement can be daunting, but it doesn’t need to be.
Imagine having an expert in your corner to help you with your financial goals. Someone to help you determine if you’re ahead, behind, or right on track. With SmartAsset, that’s not just a dream—it’s reality. This free tool connects you with pre-screened financial advisors who work in your best interests. It’s quick, it’s easy, so take the leap today and start planning smarter!
Don’t waste another minute; get started right here and help your retirement dreams become a retirement reality.
Thank you for reading! Have some feedback for us?
Contact the 24/7 Wall St. editorial team.
Latest from 24/7


Our expert who first called NVIDIA in 2009 is predicting 2025 will see a historic AI breakthrough.
You can follow him investing $500,000 of his own money on our top AI stocks for free.