The trend of each decade being warmer than the previous one is something that has been occurring since the 1980s and shows no sign of changing. The hottest years on record have all occurred within the last 13 years. According to NASA, 2022 was the fifth warmest year on record and marked the ninth year straight that has collectively been the warmest year ever measured. Meanwhile, the ocean’s heat content – a measure of the amount of heat stored in the upper levels of oceans – broke another record high in 2022, surpassing the record high set in the previous year.
Average sea levels have risen over 8 inches since 1880, with about 3 inches over the past 25 years, according to the U.S. Global Change Research Program. This acceleration is expected to continue in the foreseeable future, and the NOAA predicts average sea levels to rise 10-12 inches along the U.S. coastline by 2050. At those levels, infrastructure along even the most developed coastlines would be overwhelmed, increasing the frequency of devastating flooding in the same manner as we have already begun to witness in many parts of the world. Indeed, the problem is global.
24/7 Wall St. reviewed a study, 2050 Climate Change City Index, published in Nestpick, a platform for furnished rental apartments to find which cities in the world will be most impacted by climate change in the next 20-30 years. The study includes 85 cities that are top destinations and that had data in research papers used for this report. Each city was rated across three categories: sea level, climate, and water shortage. Cities are ranked by their total score (out of 100). A score of 100 indicates the most extreme changes in climate over the next three decades.
These cities are popular global destinations including rich cities like New York and London as well as poorer ones like Manila in the Philippines and Nairobi in Kenya. The cities with the greatest exposure to the effects of global warming, including rising sea levels and water shortage, have an overall risk score of between 28.6 for Oslo, Norway, to 100 for Bangkok, Thailand. (Here are countries where climate change is most evident.)
Six of these 25 cities on this list are located in East Asia or Southeast Asia, including Manila, Bangkok, Hong Kong, and Seoul, South Korea. Five of these cities are located in the United States, due to the number of its popular cities located adjacent to bodies of water. Though most of these cities have large populations, three are home to fewer than a million people: the metropolitan area of New Orleans, Cardiff, U.K., and Marrakesh, Morocco. (Some of these popular cities are home to human-made landmarks climate change is destroying.)
Here are the most popular cities in the world most impacted by climate change.
Here is our detailed methodology.
25. Oslo, Norway

- Overall score (0-100): 28.6
- Potential sea-level rise impact 2050 (0-100): 1.1 (43rd largest impact)
- Avg. annual temperature, 1970-2000: 43.9°F
- Avg. annual temperature, 2050: 48.0°F (32nd largest increase)
- Population, 2018: 1,012,000
24. New York, US

- Overall score (0-100): 29.0
- Potential sea-level rise impact 2050 (0-100): 16.1 (14th largest impact)
- Avg. annual temperature, 1970-2000: 53.6°F
- Avg. annual temperature, 2050: 58.9°F (15th largest increase)
- Population, 2018: 18,819,000
23. Philadelphia, US

- Overall score (0-100): 32.9
- Potential sea-level rise impact 2050 (0-100): 18.3 (12th largest impact)
- Avg. annual temperature, 1970-2000: 53.9°F
- Avg. annual temperature, 2050: 59.7°F (5th largest increase)
- Population, 2018: 5,695,000
22. London, UK

- Overall score (0-100): 33.6
- Potential sea-level rise impact 2050 (0-100): 28.5 (7th largest impact)
- Avg. annual temperature, 1970-2000: 52.0°F
- Avg. annual temperature, 2050: 55.8°F (41st largest increase)
- Population, 2018: 9,046,000
21. St. Petersburg, Russia

- Overall score (0-100): 33.7
- Potential sea-level rise impact 2050 (0-100): 1.2 (41st largest impact)
- Avg. annual temperature, 1970-2000: 41.7°F
- Avg. annual temperature, 2050: 46.8°F (17th largest increase)
- Population, 2018: 5,383,000
20. Helsinki, Finland

- Overall score (0-100): 34.5
- Potential sea-level rise impact 2050 (0-100): 1.0 (44th largest impact)
- Avg. annual temperature, 1970-2000: 41.7°F
- Avg. annual temperature, 2050: 46.8°F (18th largest increase)
- Population, 2018: 1,279,000
19. New Orleans, US

- Overall score (0-100): 36.1
- Potential sea-level rise impact 2050 (0-100): 37.4 (5th largest impact)
- Avg. annual temperature, 1970-2000: 69.5°F
- Avg. annual temperature, 2050: 72.9°F (49th largest increase)
- Population, 2018: 979,000
18. Santiago, Chile

- Overall score (0-100): 38.0
- Potential sea-level rise impact 2050 (0-100): 1.0 (44th largest impact)
- Avg. annual temperature, 1970-2000: 59.7°F
- Avg. annual temperature, 2050: 61.8°F (81st largest increase)
- Population, 2018: 6,680,000
17. Kiev, Ukraine

- Overall score (0-100): 38.0
- Potential sea-level rise impact 2050 (0-100): 1.0 (44th largest impact)
- Avg. annual temperature, 1970-2000: 46.3°F
- Avg. annual temperature, 2050: 51.7°F (14th largest increase)
- Population, 2018: 2,957,000
16. Beijing, China

- Overall score (0-100): 39.3
- Potential sea-level rise impact 2050 (0-100): 1.0 (44th largest impact)
- Avg. annual temperature, 1970-2000: 54.4°F
- Avg. annual temperature, 2050: 58.1°F (40th largest increase)
- Population, 2018: 19,618,000
15. Istanbul, Turkey

- Overall score (0-100): 39.3
- Potential sea-level rise impact 2050 (0-100): 2.4 (33rd largest impact)
- Avg. annual temperature, 1970-2000: 57.3°F
- Avg. annual temperature, 2050: 61.0°F (39th largest increase)
- Population, 2018: 14,751,000
14. Toronto, Canada

- Overall score (0-100): 39.3
- Potential sea-level rise impact 2050 (0-100): 1.0 (44th largest impact)
- Avg. annual temperature, 1970-2000: 47.1°F
- Avg. annual temperature, 2050: 52.6°F (12th largest increase)
- Population, 2018: 6,082,000
13. Hong Kong, Hong Kong

- Overall score (0-100): 40.7
- Potential sea-level rise impact 2050 (0-100): 15.3 (16th largest impact)
- Avg. annual temperature, 1970-2000: 73.4°F
- Avg. annual temperature, 2050: 76.2°F (65th largest increase)
- Population, 2018: 7,429,000
12. Chicago, US

- Overall score (0-100): 40.7
- Potential sea-level rise impact 2050 (0-100): 1.0 (44th largest impact)
- Avg. annual temperature, 1970-2000: 50.3°F
- Avg. annual temperature, 2050: 55.9°F (7th largest increase)
- Population, 2018: 8,864,000
11. Manila, Philippines
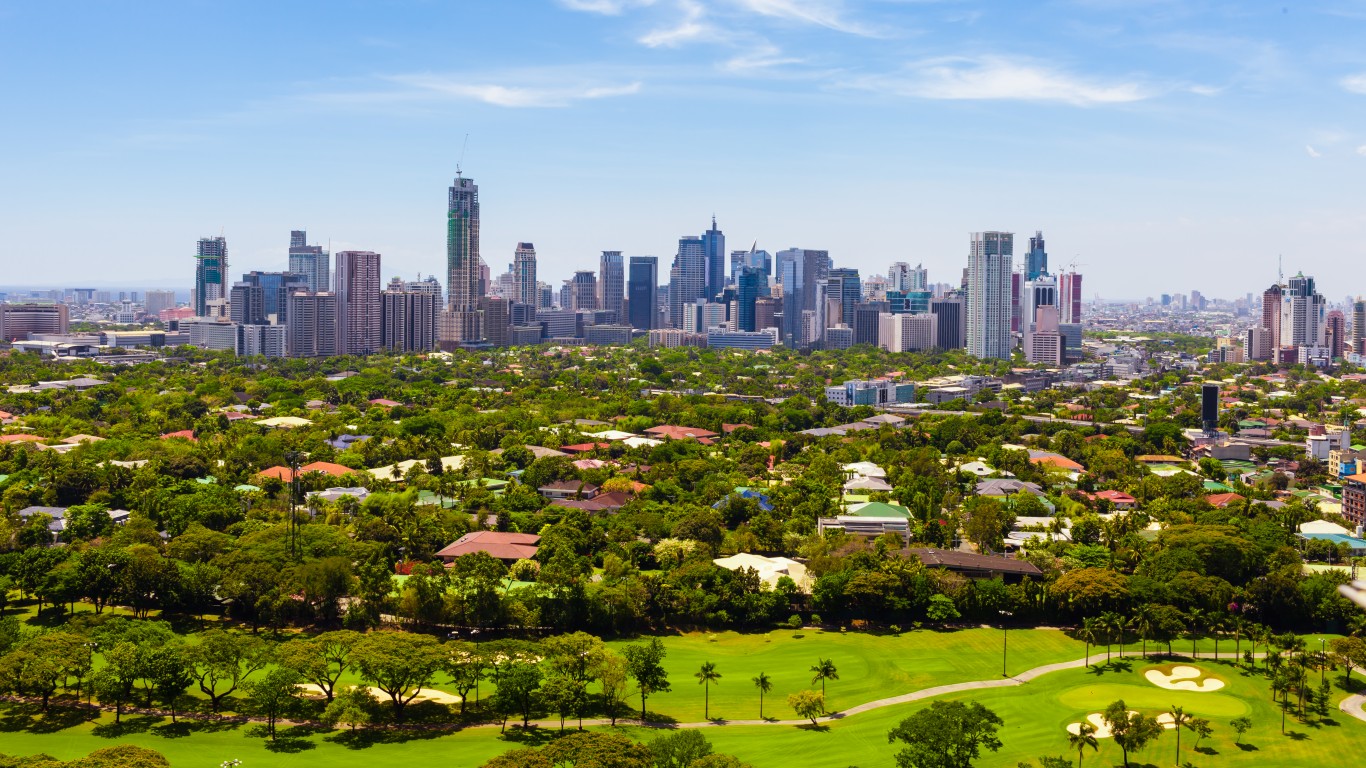
- Overall score (0-100): 40.8
- Potential sea-level rise impact 2050 (0-100): 37.0 (6th largest impact)
- Avg. annual temperature, 1970-2000: 81.3°F
- Avg. annual temperature, 2050: 84.0°F (66th largest increase)
- Population, 2018: 13,482,000
10. Marrakesh, Morocco

- Overall score (0-100): 44.6
- Potential sea-level rise impact 2050 (0-100): 1.0 (44th largest impact)
- Avg. annual temperature, 1970-2000: 66.8°F
- Avg. annual temperature, 2050: 72.0°F (16th largest increase)
- Population, 2018: 976,000
9. Nairobi, Kenya
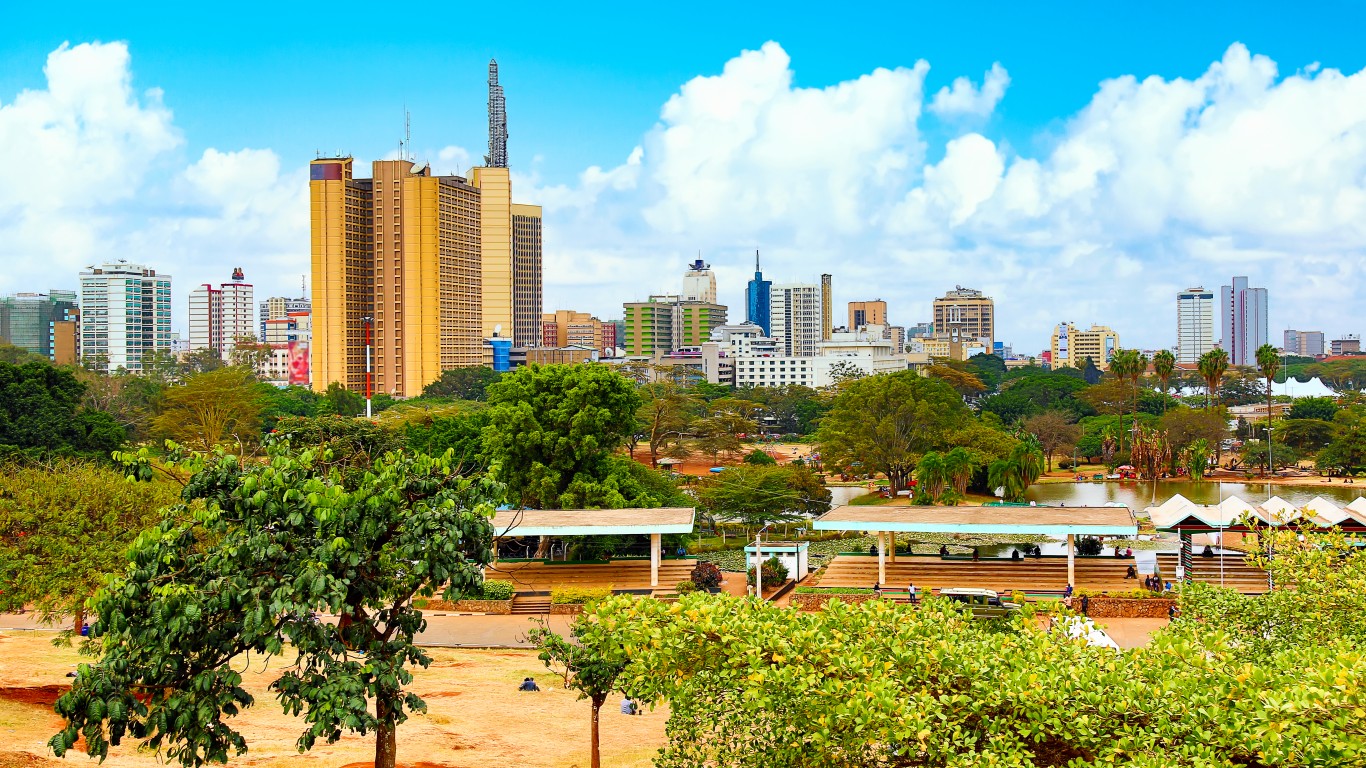
- Overall score (0-100): 44.8
- Potential sea-level rise impact 2050 (0-100): 1.0 (44th largest impact)
- Avg. annual temperature, 1970-2000: 65.5°F
- Avg. annual temperature, 2050: 69.7°F (30th largest increase)
- Population, 2018: 4,386,000
8. Boston, US

- Overall score (0-100): 44.8
- Potential sea-level rise impact 2050 (0-100): 8.2 (21st largest impact)
- Avg. annual temperature, 1970-2000: 50.5°F
- Avg. annual temperature, 2050: 55.2°F (19th largest increase)
- Population, 2018: 4,308,000
7. Seoul, South Korea
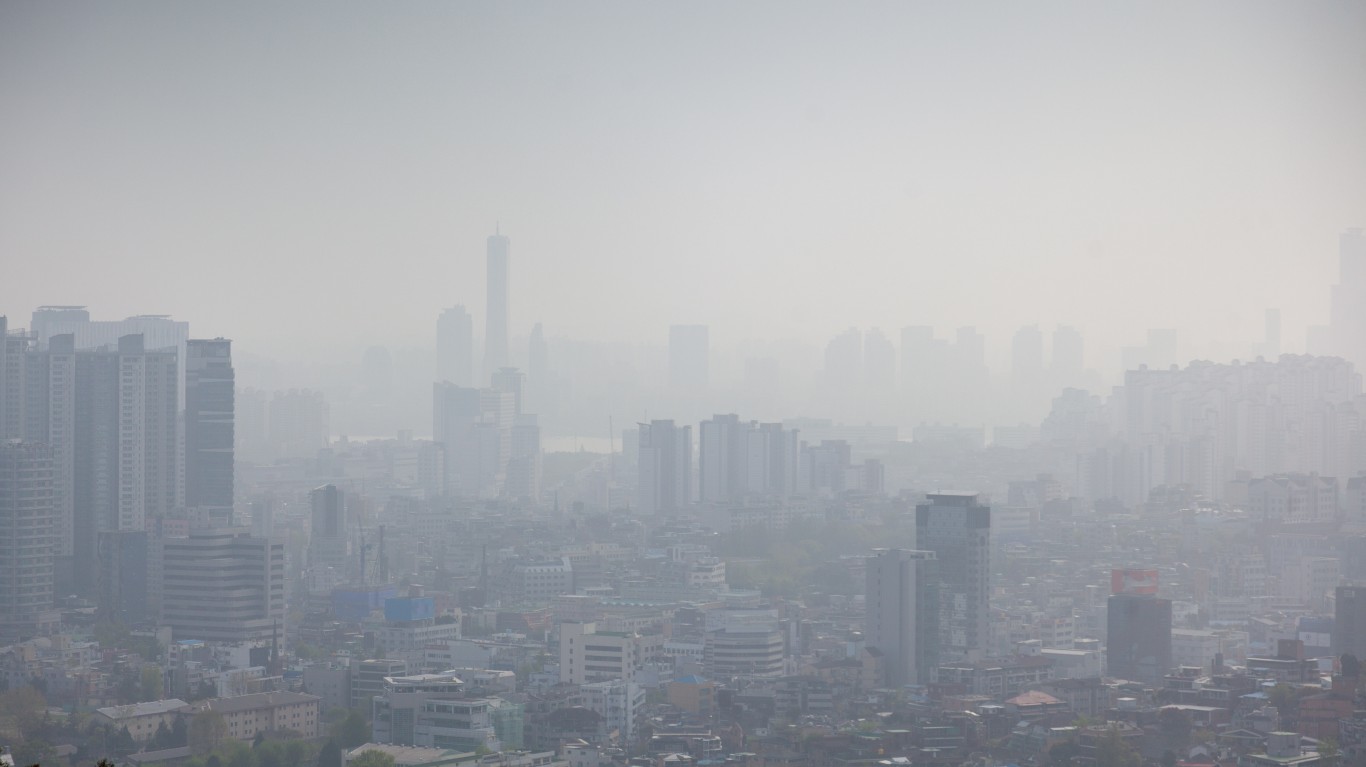
- Overall score (0-100): 45.8
- Potential sea-level rise impact 2050 (0-100): 6.3 (22nd largest impact)
- Avg. annual temperature, 1970-2000: 54.0°F
- Avg. annual temperature, 2050: 57.8°F (38th largest increase)
- Population, 2018: 9,963,000
6. Cardiff, UK
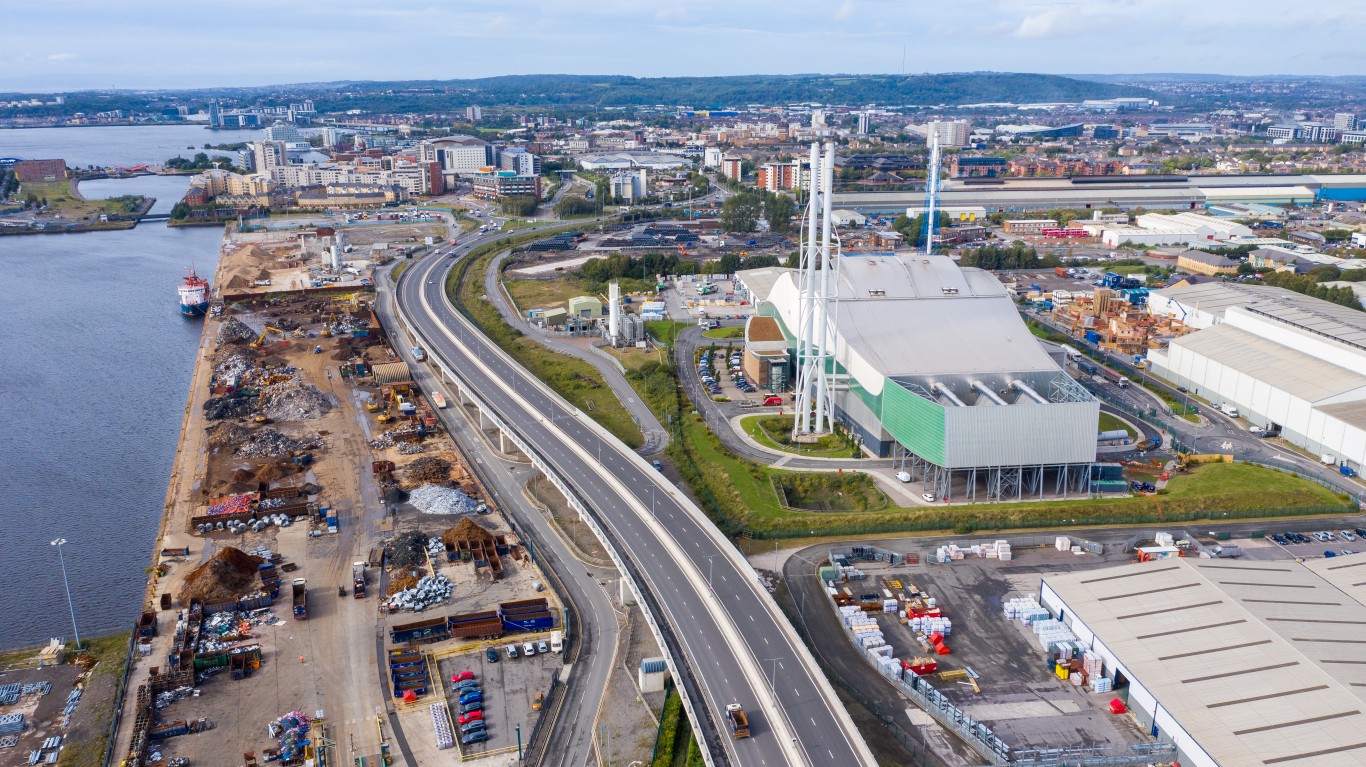
- Overall score (0-100): 47.0
- Potential sea-level rise impact 2050 (0-100): 45.9 (4th largest impact)
- Avg. annual temperature, 1970-2000: 50.9°F
- Avg. annual temperature, 2050: 54.0°F (57th largest increase)
- Population, 2018: 471,000
5. Melbourne, Australia
- Overall score (0-100): 49.5
- Potential sea-level rise impact 2050 (0-100): 2.2 (34th largest impact)
- Avg. annual temperature, 1970-2000: 59.6°F
- Avg. annual temperature, 2050: 62.1°F (70th largest increase)
- Population, 2018: 4,771,000
4. Shenzhen, China

- Overall score (0-100): 62.2
- Potential sea-level rise impact 2050 (0-100): 28.1 (8th largest impact)
- Avg. annual temperature, 1970-2000: 73.1°F
- Avg. annual temperature, 2050: 76.5°F (50th largest increase)
- Population, 2018: 11,908,000
3. Amsterdam, Netherlands

- Overall score (0-100): 84.3
- Potential sea-level rise impact 2050 (0-100): 89.6 (2nd largest impact)
- Avg. annual temperature, 1970-2000: 50.1°F
- Avg. annual temperature, 2050: 52.3°F (76th largest increase)
- Population, 2018: 1,132,000
2. Ho Chi Minh City, Vietnam
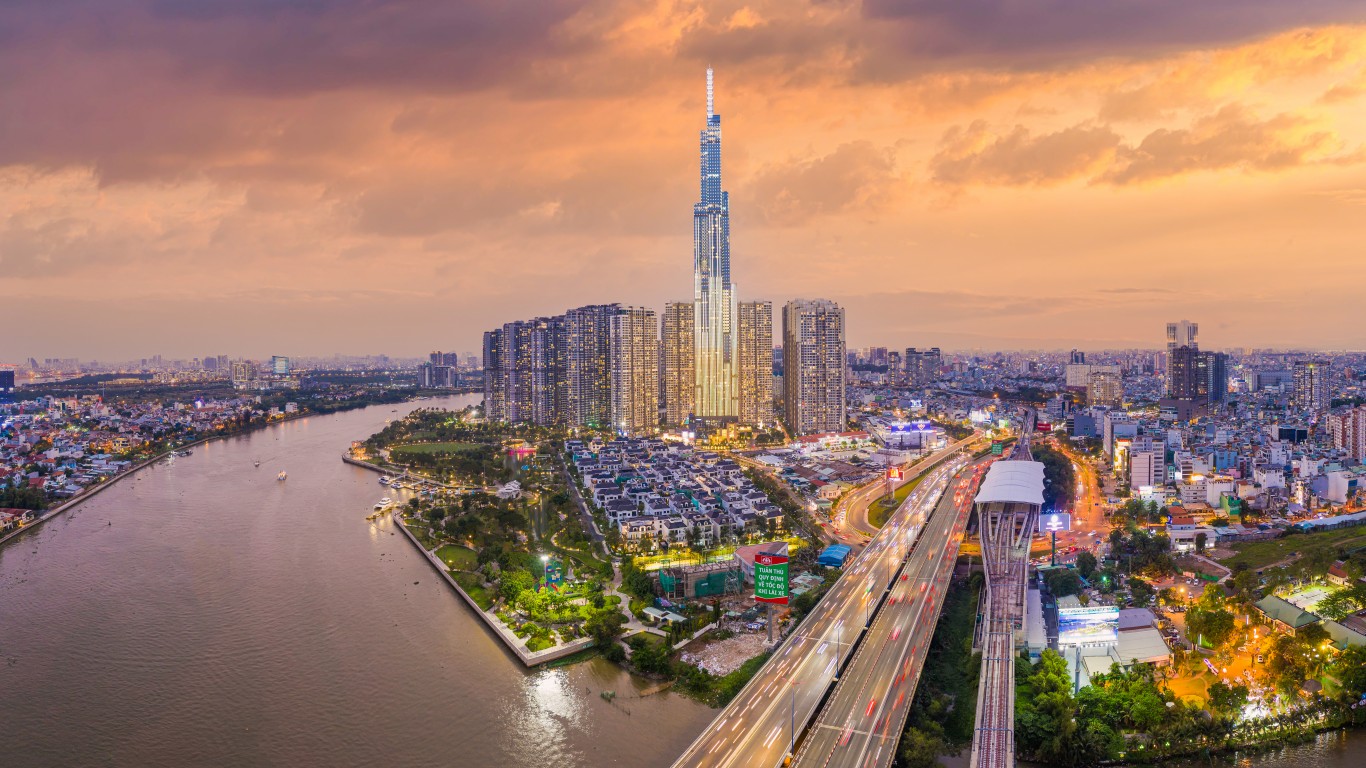
- Overall score (0-100): 85.3
- Potential sea-level rise impact 2050 (0-100): 88.7 (3rd largest impact)
- Avg. annual temperature, 1970-2000: 81.5°F
- Avg. annual temperature, 2050: 84.5°F (58th largest increase)
- Population, 2018: 8,145,000
1. Bangkok, Thailand
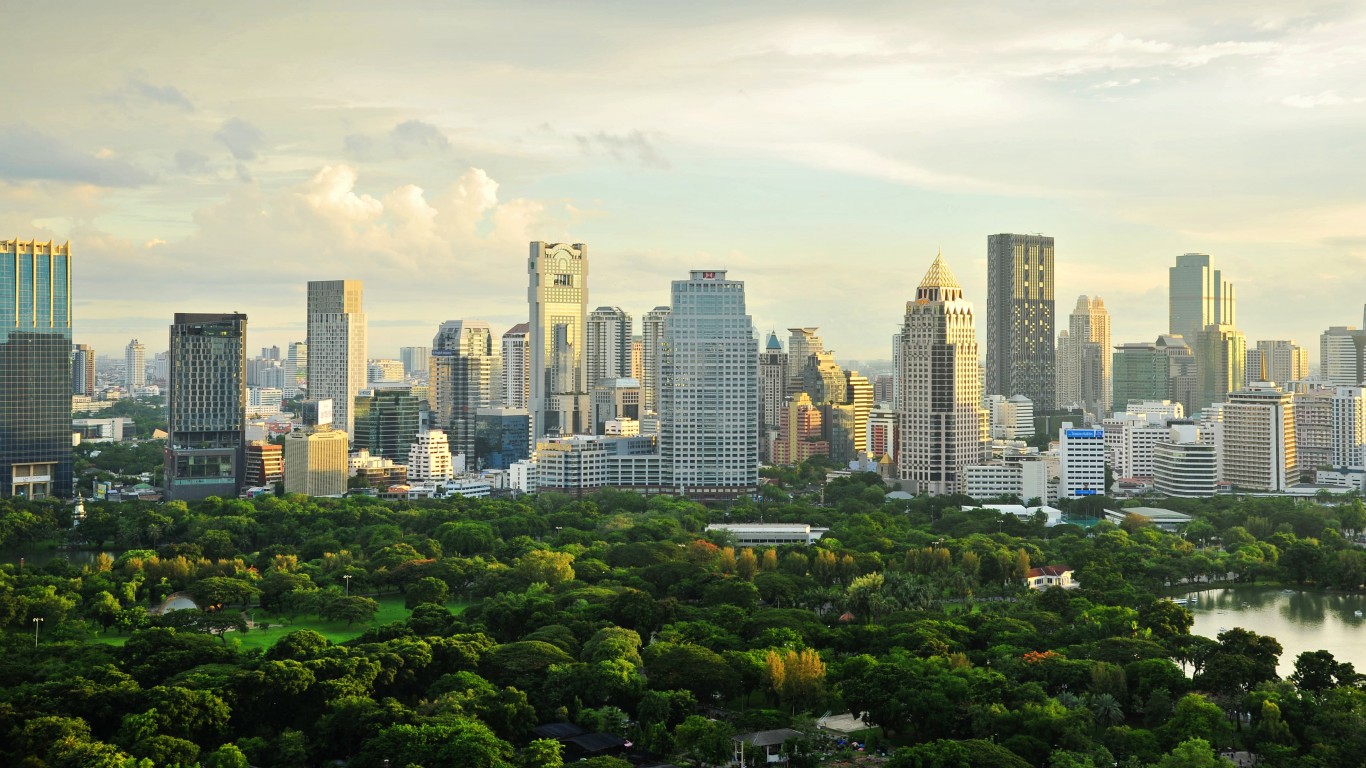
- Overall score (0-100): 100.0
- Potential sea-level rise impact 2050 (0-100): 100.0 (the largest impact)
- Avg. annual temperature, 1970-2000: 83.1°F
- Avg. annual temperature, 2050: 86.1°F (58th largest increase)
- Population, 2018: 10,156,000