America’s creative class has long been a key driver of innovation, economic growth, and culture. Creative class occupations – defined as those that typically require high levels of creative thinking – span multiple industries, including architecture, the arts, engineering, technology, and business. These types of jobs usually require at least a bachelor’s degree and tend to be well paying. (These 25 American industries are booming.)
While creative class jobs can be found in communities across the country, historically, they have been especially concentrated in large, so-called “superstar” cities, that regularly draw in large numbers of young, college-educated, and upwardly mobile professionals. These cities include Boston, Los Angeles, New York, and San Francisco.
This may be beginning to change, however. Now that remote work has become the new normal for millions of Americans and more companies are looking outside of Manhattan and Silicon Valley, other U.S. cities are reporting a boom in creative-class workers.
Using data from the Bureau of Labor Statistics, 24/7 Wall St. identified the cities with the fastest-growing creative classes. We ranked metro areas on the change in creative class occupations as a share of all jobs from 2018 to 2022.
Among the 40 metro areas on this list, the share of all jobs considered to be in creative occupations has increased by anywhere from 4.9 percentage points to more than 16 percentage points in the last five years.
This list includes several metro areas that are strongly associated with technology and innovation, including Boulder, Colorado, San Francisco, San Jose, California, and Washington D.C. The creative class in each of these places now accounts for over 25% of all workers, and has accounted for over 15% since 2018. In other cities on this list, like Morgantown, West Virginia, and Rochester, Minnesota, the creative occupations still account for less than 14% of all jobs.
These cities span the country, with four in the Northeast, nine in the West, 11 in the Midwest, and 16 in the South. Though geographically diverse, many of these places are similar in that they are home to at least one major college or university. Many college towns are already hubs of research and innovation and are attractive places for employers seeking a skilled workforce. This list includes many of the largest college towns in the U.S., such as Blacksburg, Virginia; Bloomington, Indiana; State College, Pennsylvania; and the Raleigh and Durham-Chapel hill metro areas in North Carolina. (These are the 50 best college towns in America.)
Here are the cities with the fastest-growing creative classes.
40. Springfield, IL
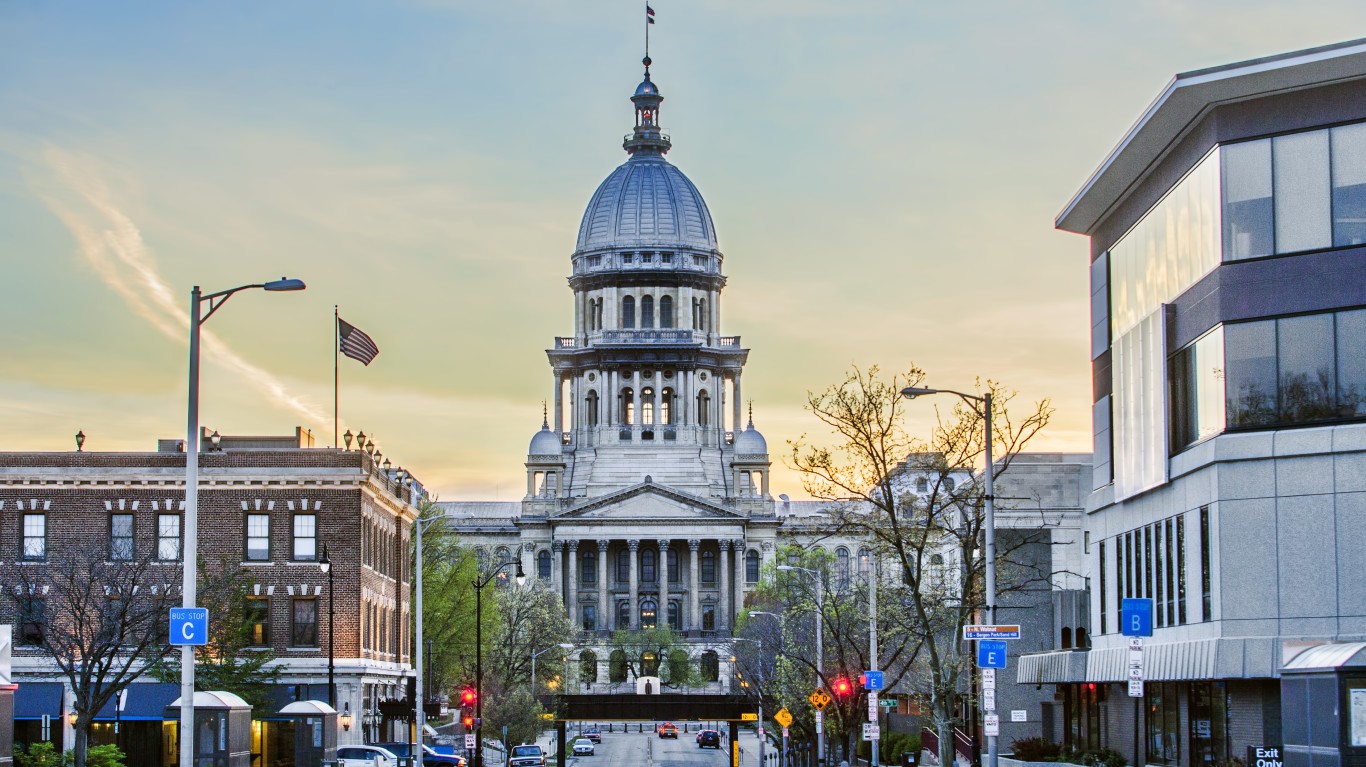
- > “Creative class” as share of all jobs, 2022: 14.8% (+4.9 ppts. from 2018)
- > Avg. annual “creative class” wage, 2022: $97,268 (+12.3% from 2018)
- > Most concentrated “creative class” jobs: Producers and directors; audio and video technicians; computer systems analysts
39. San Diego-Carlsbad, CA
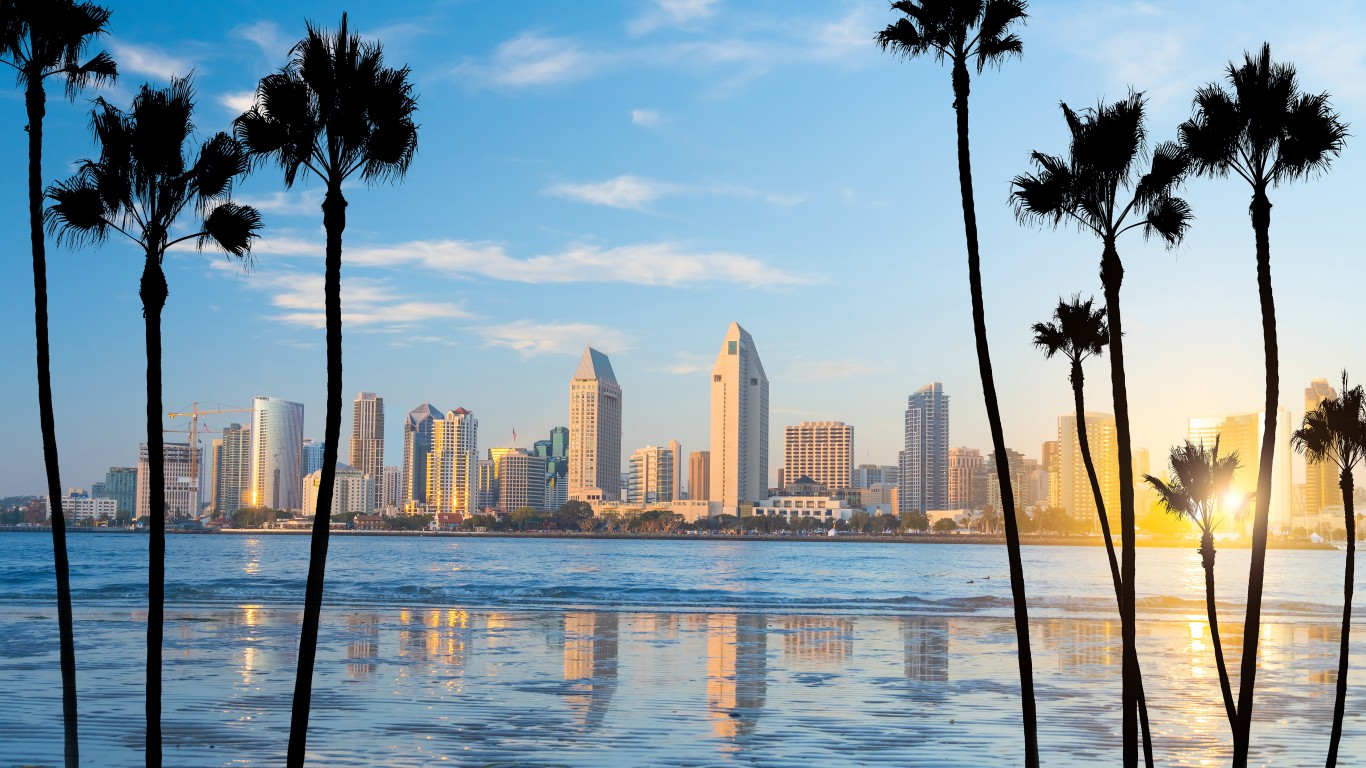
- > “Creative class” as share of all jobs, 2022: 19.2% (+4.9 ppts. from 2018)
- > Avg. annual “creative class” wage, 2022: $121,209 (+14.8% from 2018)
- > Most concentrated “creative class” jobs: Biological scientists; computer hardware engineers; biochemists and biophysicists
38. Burlington-South Burlington, VT
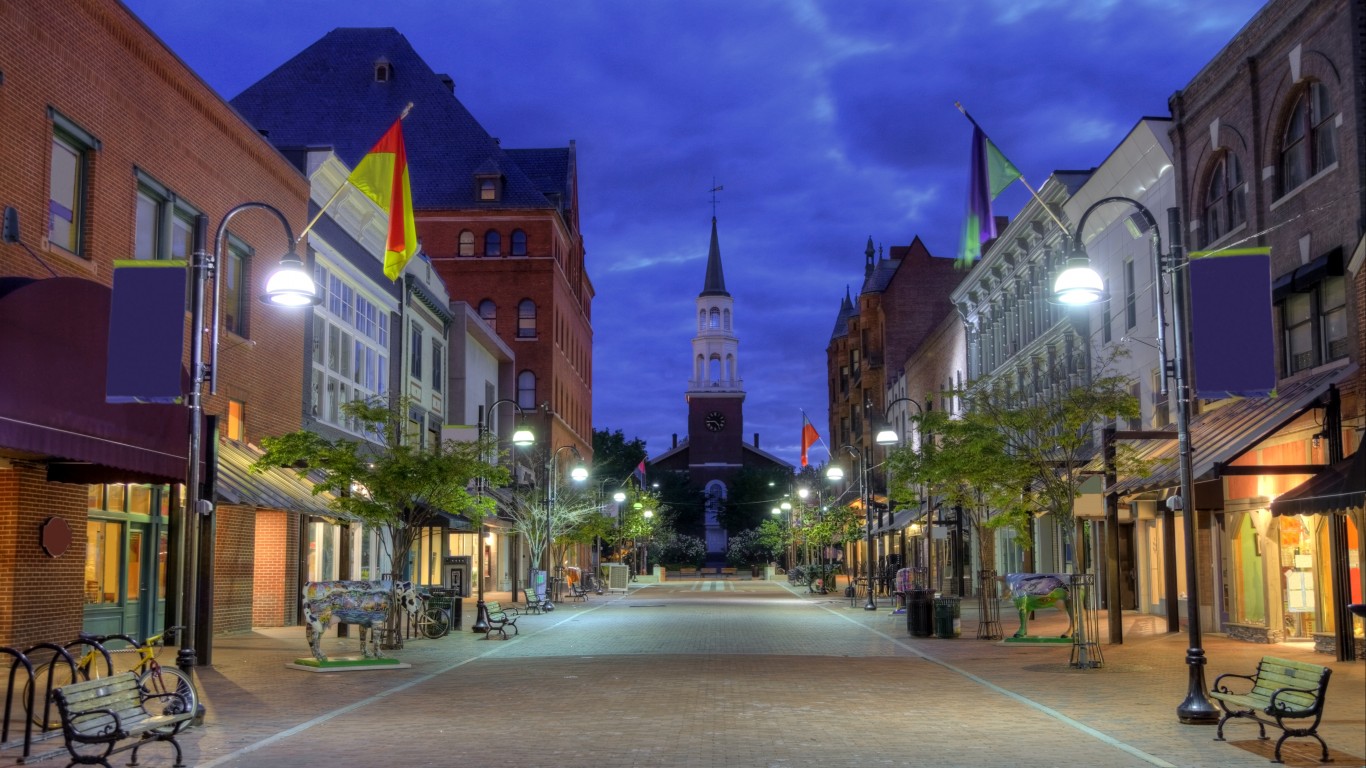
- > “Creative class” as share of all jobs, 2022: 16.9% (+5.0 ppts. from 2018)
- > Avg. annual “creative class” wage, 2022: $97,105 (+13.6% from 2018)
- > Most concentrated “creative class” jobs: Hydrologists; commercial and industrial designers; education and childcare administrators, preschool and daycare
37. Richmond, VA
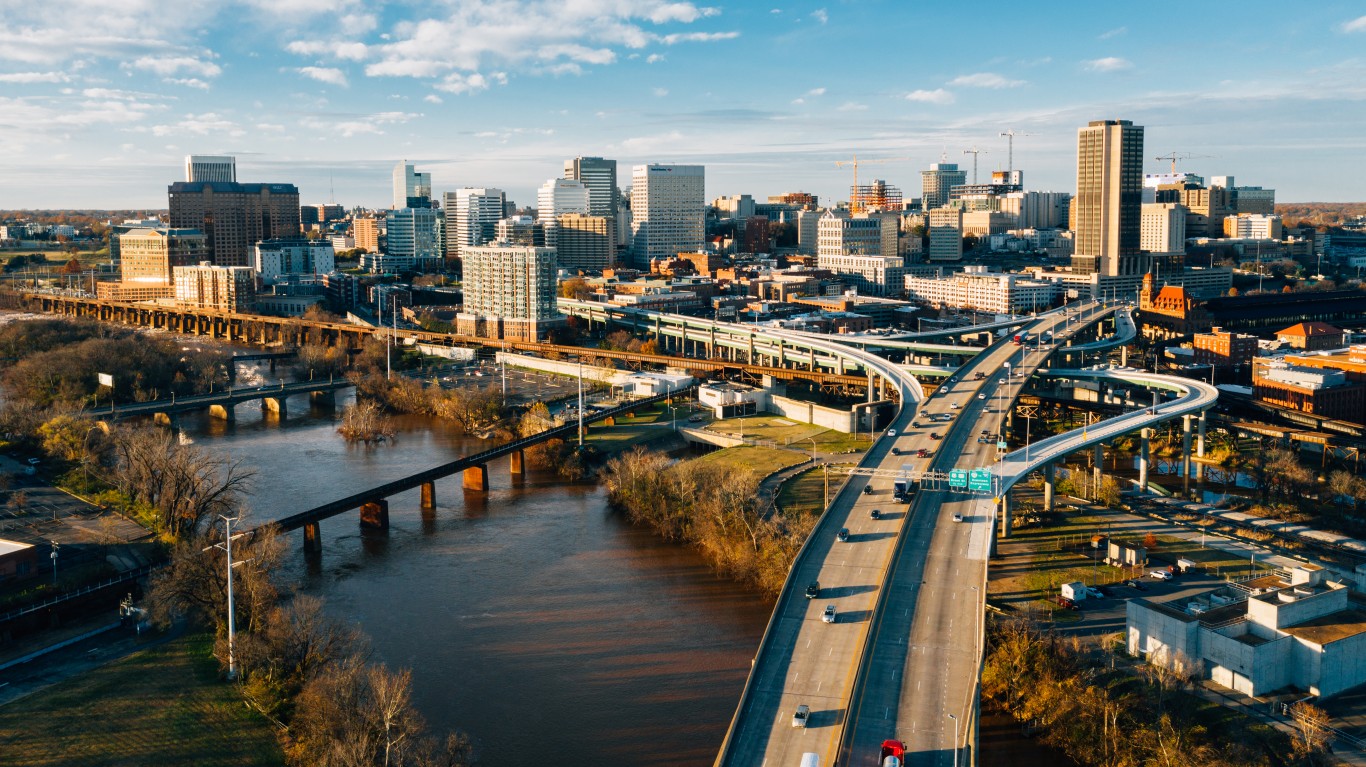
- > “Creative class” as share of all jobs, 2022: 16.2% (+5.0 ppts. from 2018)
- > Avg. annual “creative class” wage, 2022: $106,222 (+8.9% from 2018)
- > Most concentrated “creative class” jobs: Life scientists; postsecondary chemistry teachers; operations research analysts
36. Rochester, MN
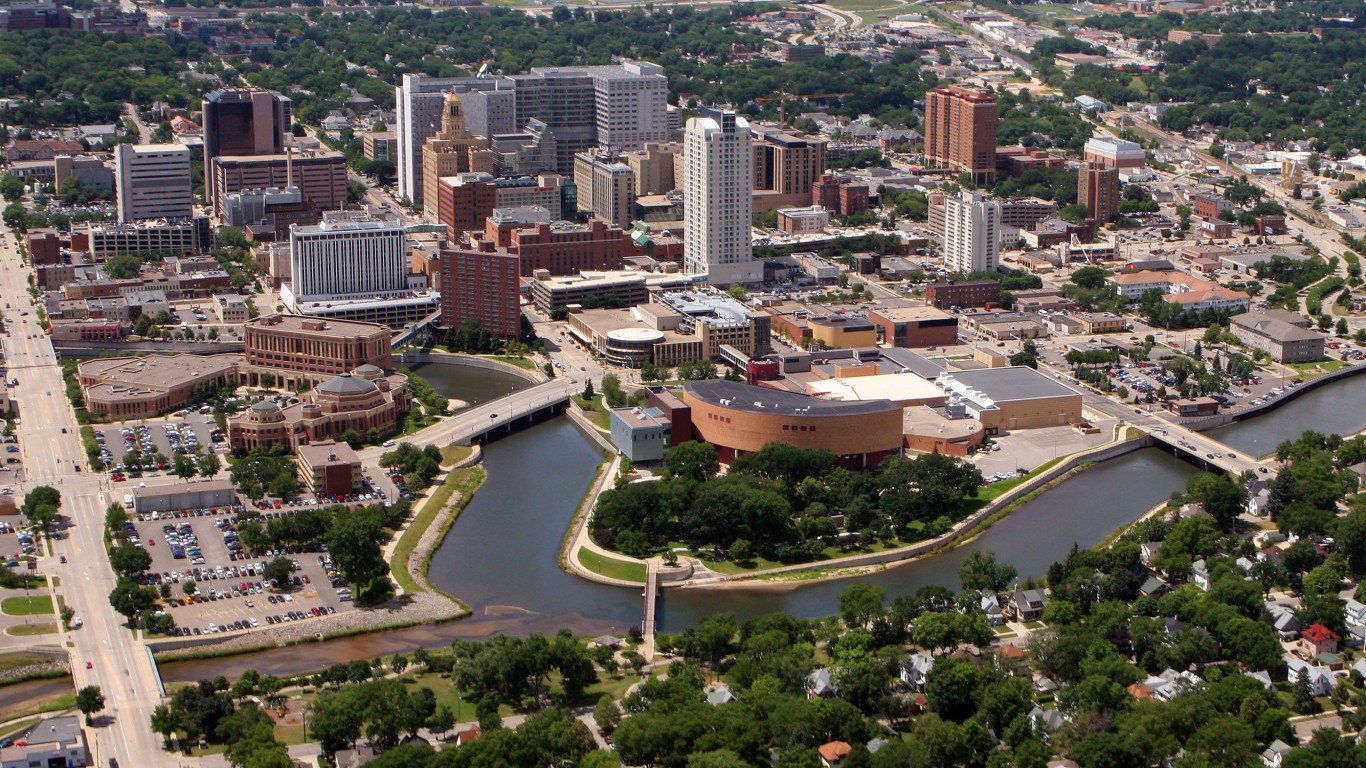
- > “Creative class” as share of all jobs, 2022: 10.4% (+5.1 ppts. from 2018)
- > Avg. annual “creative class” wage, 2022: $98,613 (+28.4% from 2018)
- > Most concentrated “creative class” jobs: Medical scientists, except epidemiologists; clinical and counseling psychologists; interpreters and translators
35. Charlotte-Concord-Gastonia, NC-SC
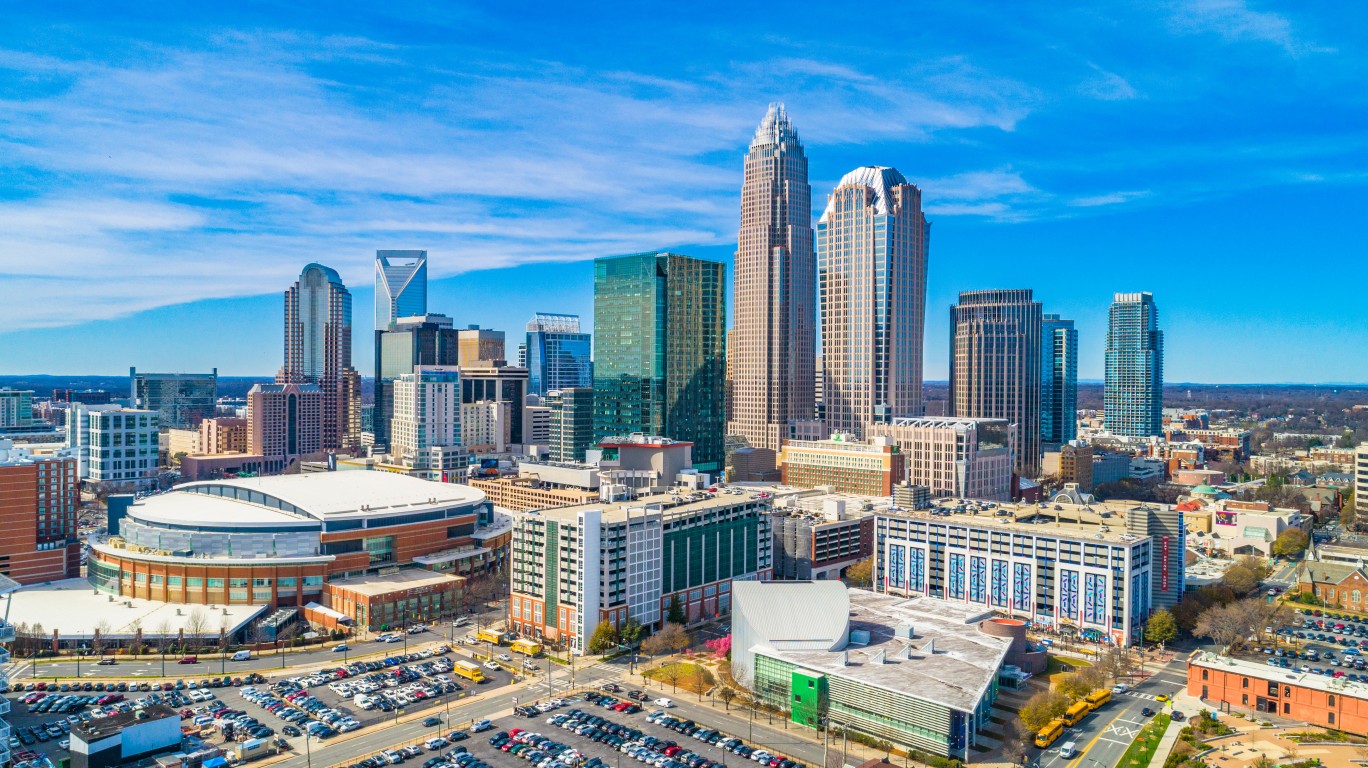
- > “Creative class” as share of all jobs, 2022: 17.1% (+5.1 ppts. from 2018)
- > Avg. annual “creative class” wage, 2022: $110,884 (+11.4% from 2018)
- > Most concentrated “creative class” jobs: Athletes and sports competitors; archivists; computer systems analysts
34. Columbia, MO
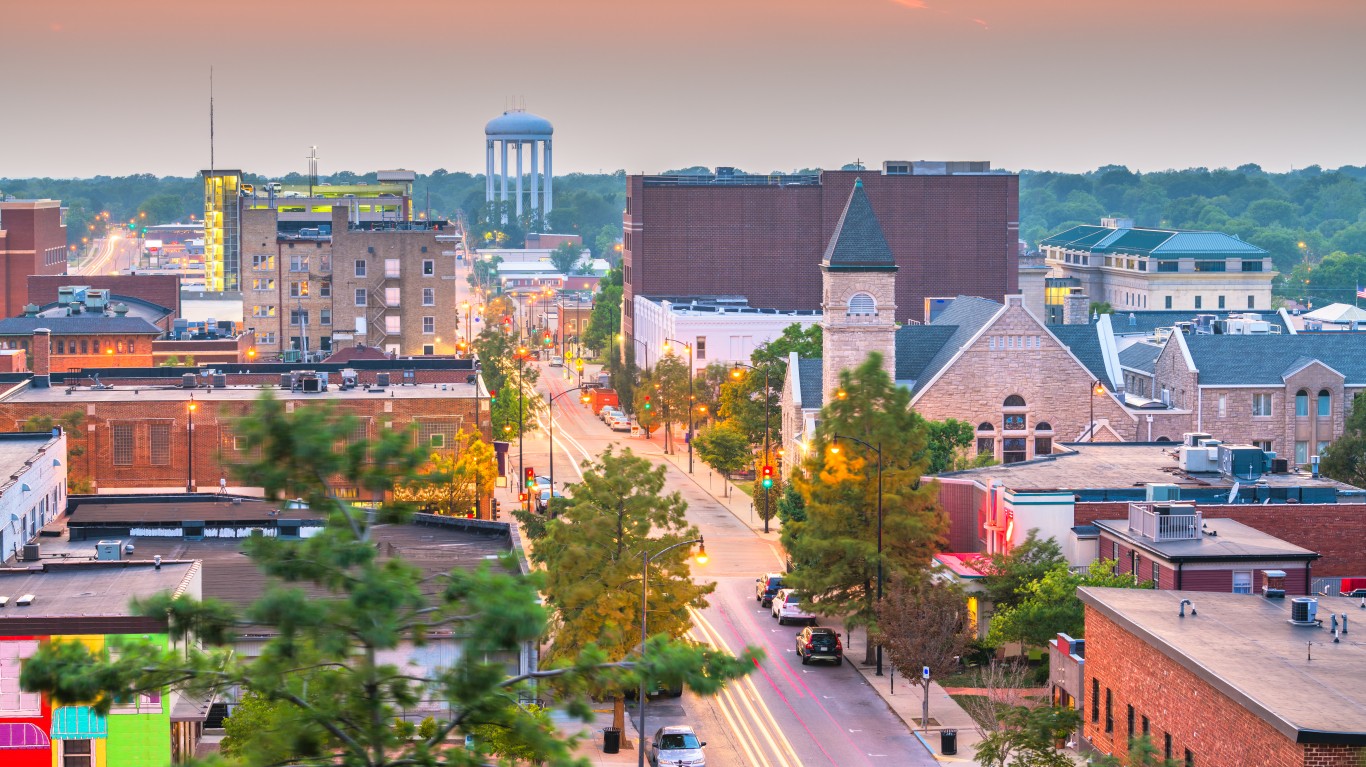
- > “Creative class” as share of all jobs, 2022: 13.6% (+5.1 ppts. from 2018)
- > Avg. annual “creative class” wage, 2022: $83,333 (+13.8% from 2018)
- > Most concentrated “creative class” jobs: Postsecondary psychology teachers; postsecondary biological science teachers; postsecondary computer science teachers
33. Des Moines-West Des Moines, IA
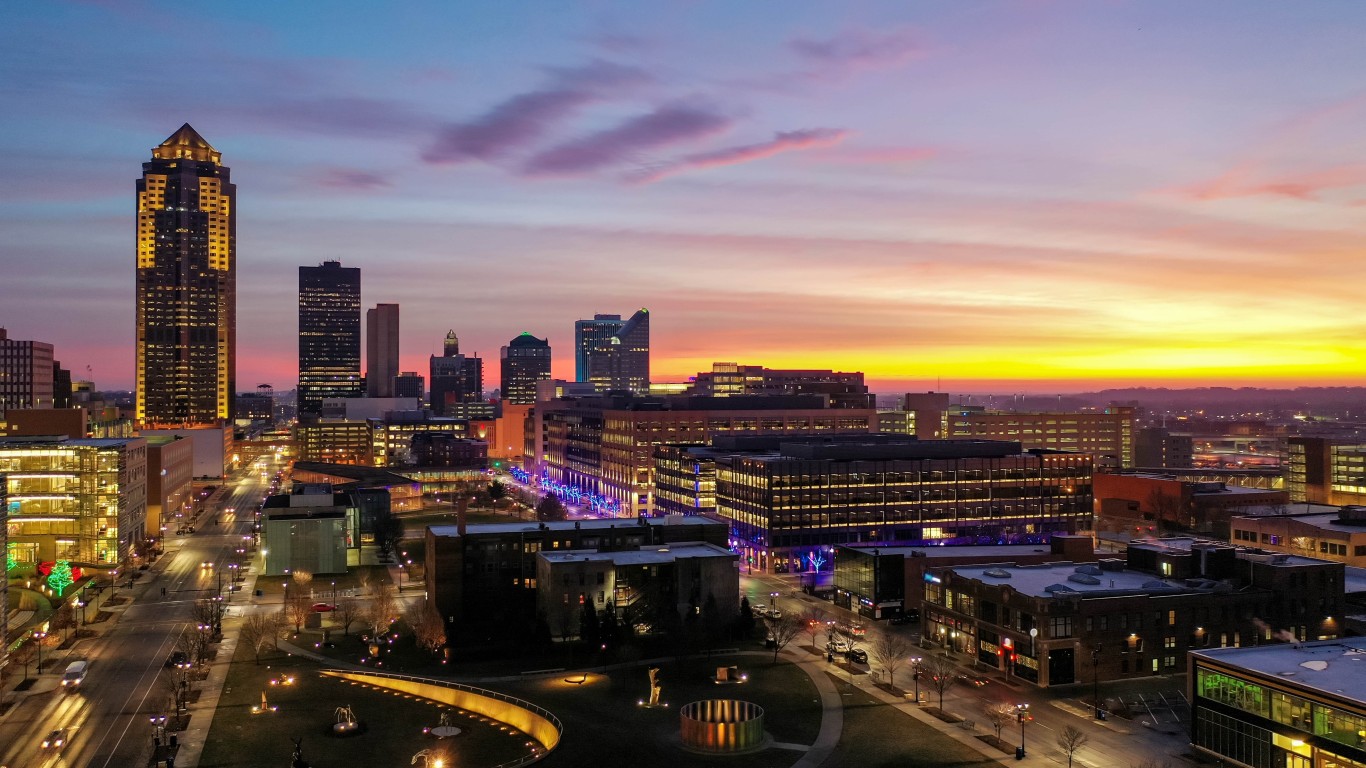
- > “Creative class” as share of all jobs, 2022: 17.8% (+5.2 ppts. from 2018)
- > Avg. annual “creative class” wage, 2022: $96,386 (+9.4% from 2018)
- > Most concentrated “creative class” jobs: Soil and plant scientists; actuaries; survey researchers
32. Colorado Springs, CO
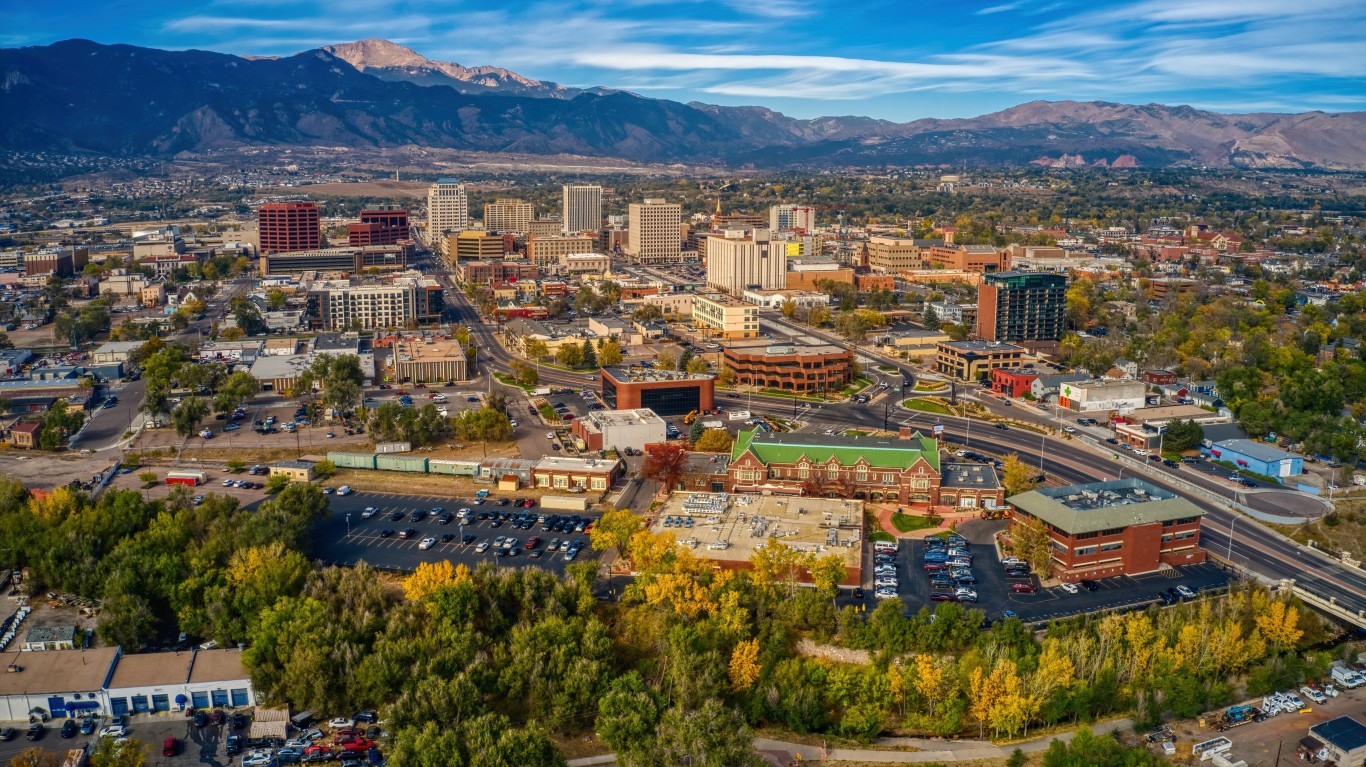
- > “Creative class” as share of all jobs, 2022: 16.2% (+5.3 ppts. from 2018)
- > Avg. annual “creative class” wage, 2022: $106,210 (+19.5% from 2018)
- > Most concentrated “creative class” jobs: Electronics engineers, except computer; computer network architects; computer hardware engineers
31. Blacksburg-Christiansburg-Radford, VA
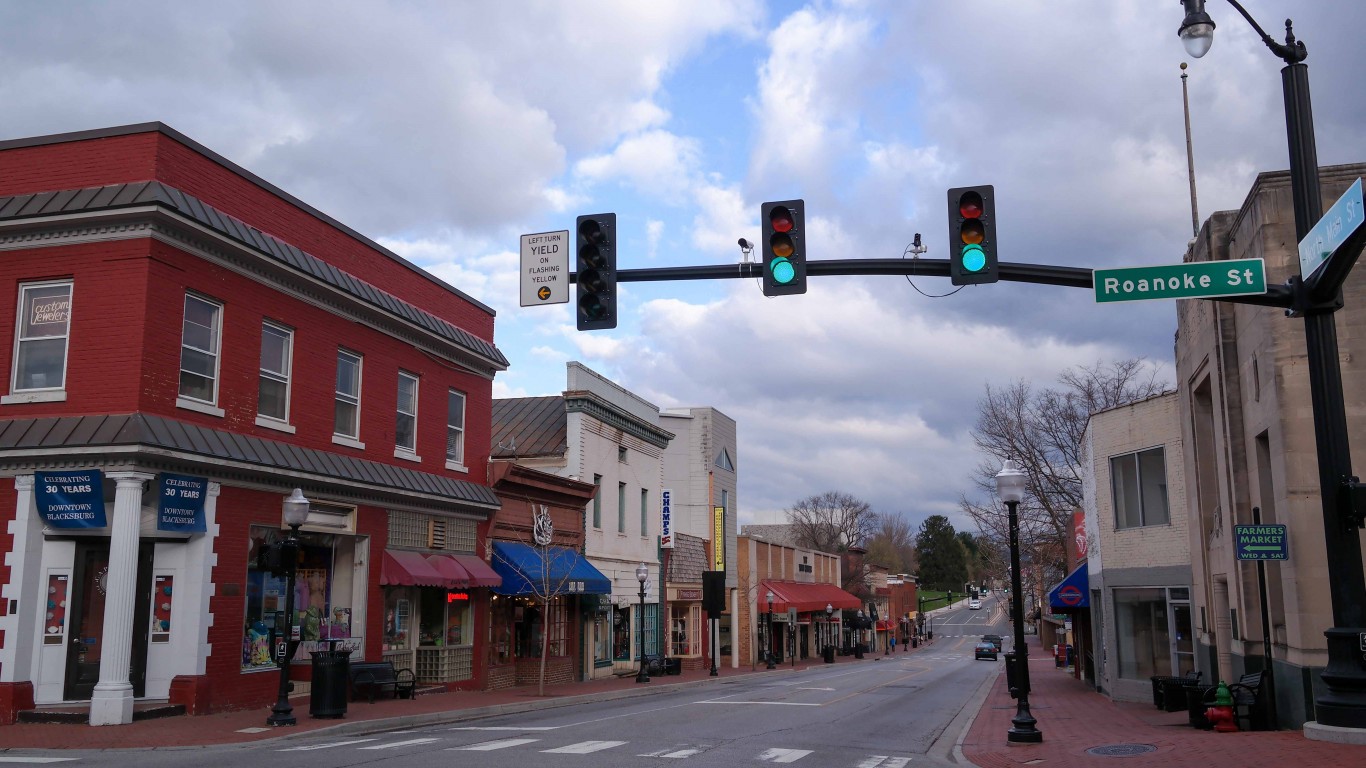
- > “Creative class” as share of all jobs, 2022: 12.5% (+5.3 ppts. from 2018)
- > Avg. annual “creative class” wage, 2022: $89,592 (+4.7% from 2018)
- > Most concentrated “creative class” jobs: Postsecondary computer science teachers; postsecondary geography teachers; postsecondary business teachers
30. Boston-Cambridge-Nashua, MA-NH
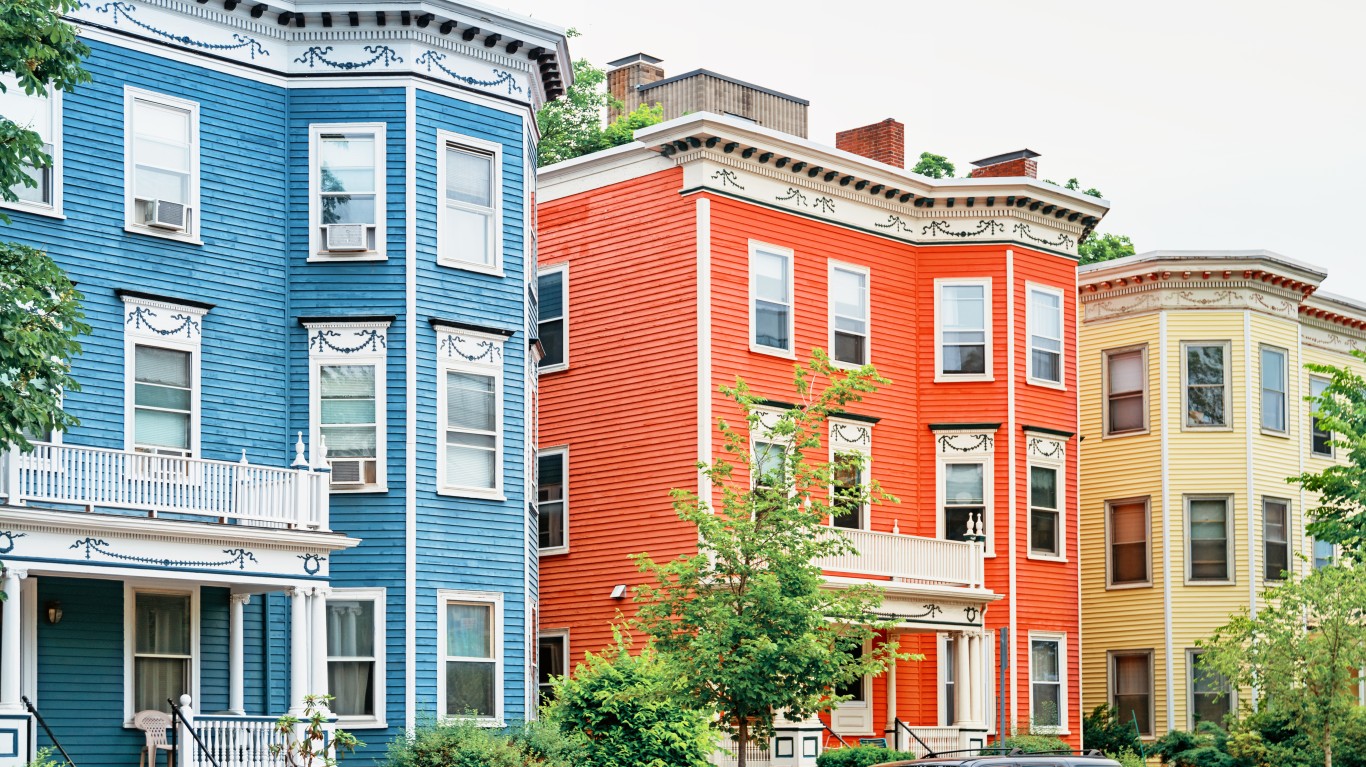
- > “Creative class” as share of all jobs, 2022: 23.4% (+5.4 ppts. from 2018)
- > Avg. annual “creative class” wage, 2022: $130,809 (+13.8% from 2018)
- > Most concentrated “creative class” jobs: Biochemists and biophysicists; microbiologists; medical scientists, except epidemiologists
29. Madison, WI
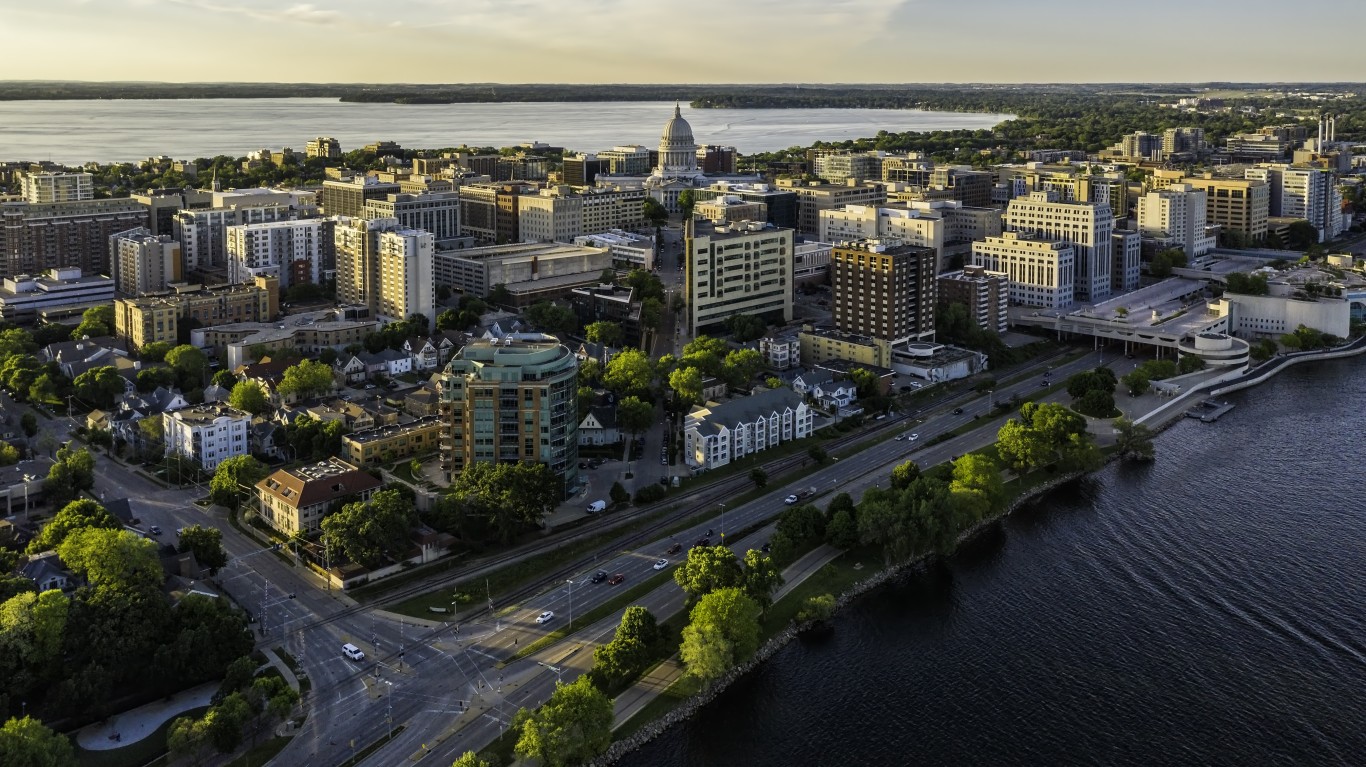
- > “Creative class” as share of all jobs, 2022: 19.1% (+5.4 ppts. from 2018)
- > Avg. annual “creative class” wage, 2022: $98,051 (+12.8% from 2018)
- > Most concentrated “creative class” jobs: Postsecondary agricultural sciences teachers; microbiologists; postsecondary health specialties teachers
28. Denver-Aurora-Lakewood, CO
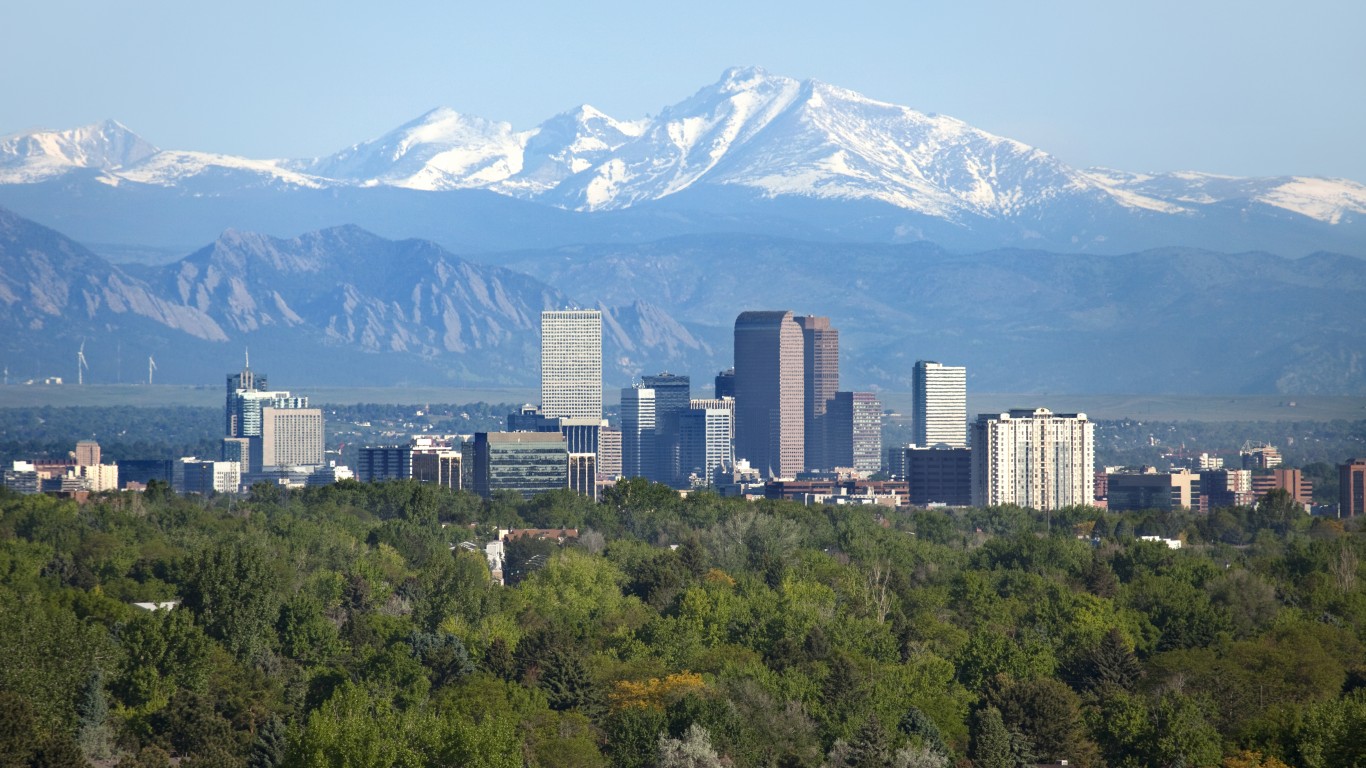
- > “Creative class” as share of all jobs, 2022: 20.0% (+5.4 ppts. from 2018)
- > Avg. annual “creative class” wage, 2022: $117,727 (+14.1% from 2018)
- > Most concentrated “creative class” jobs: Geoscientists, except hydrologists and geographers; cartographers and photogrammetrists; electronics engineers, except computer
27. Columbus, GA-AL

- > “Creative class” as share of all jobs, 2022: 13.8% (+5.5 ppts. from 2018)
- > Avg. annual “creative class” wage, 2022: $89,385 (+9.7% from 2018)
- > Most concentrated “creative class” jobs: Education administrators; psychologists; computer occupations
26. Palm Bay-Melbourne-Titusville, FL
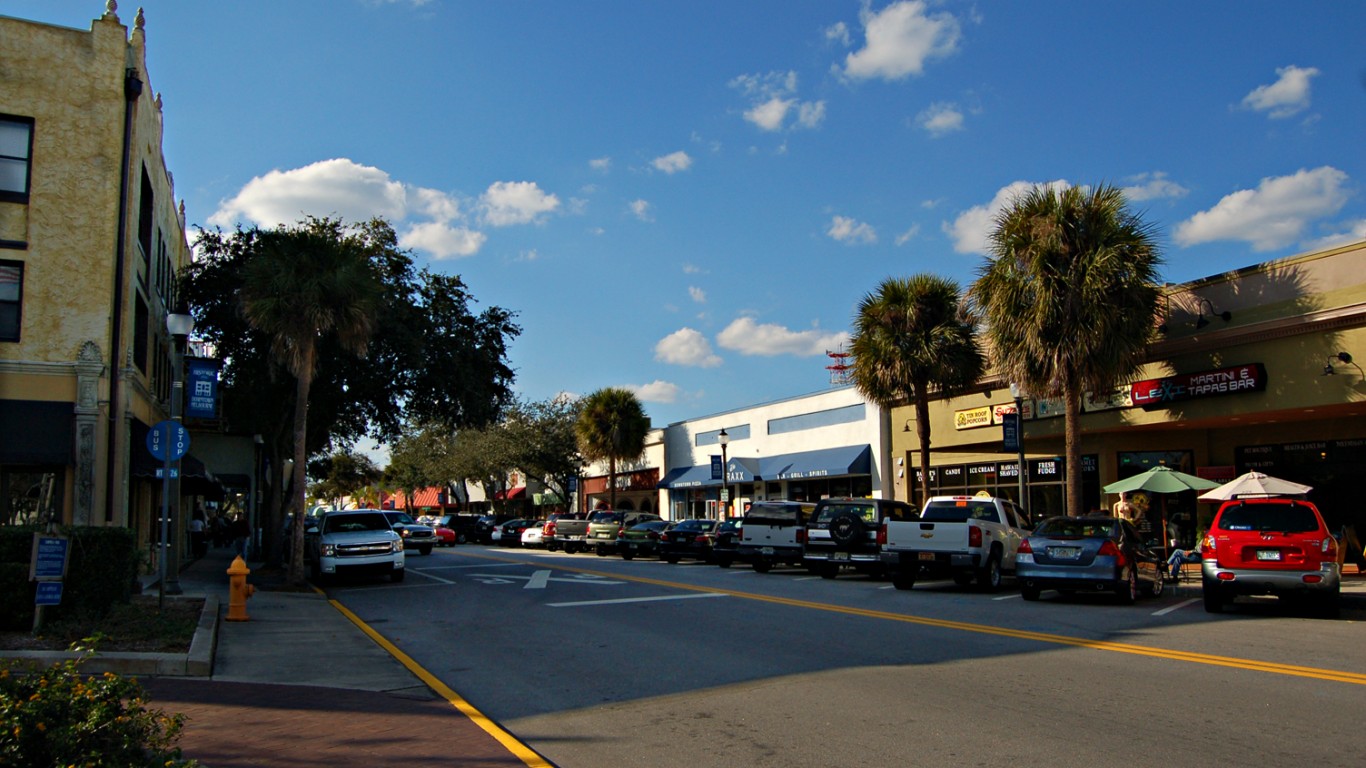
- > “Creative class” as share of all jobs, 2022: 17.4% (+5.6 ppts. from 2018)
- > Avg. annual “creative class” wage, 2022: $104,958 (+16.6% from 2018)
- > Most concentrated “creative class” jobs: Aerospace engineers; engineers; atmospheric and space scientists
25. Charlottesville, VA
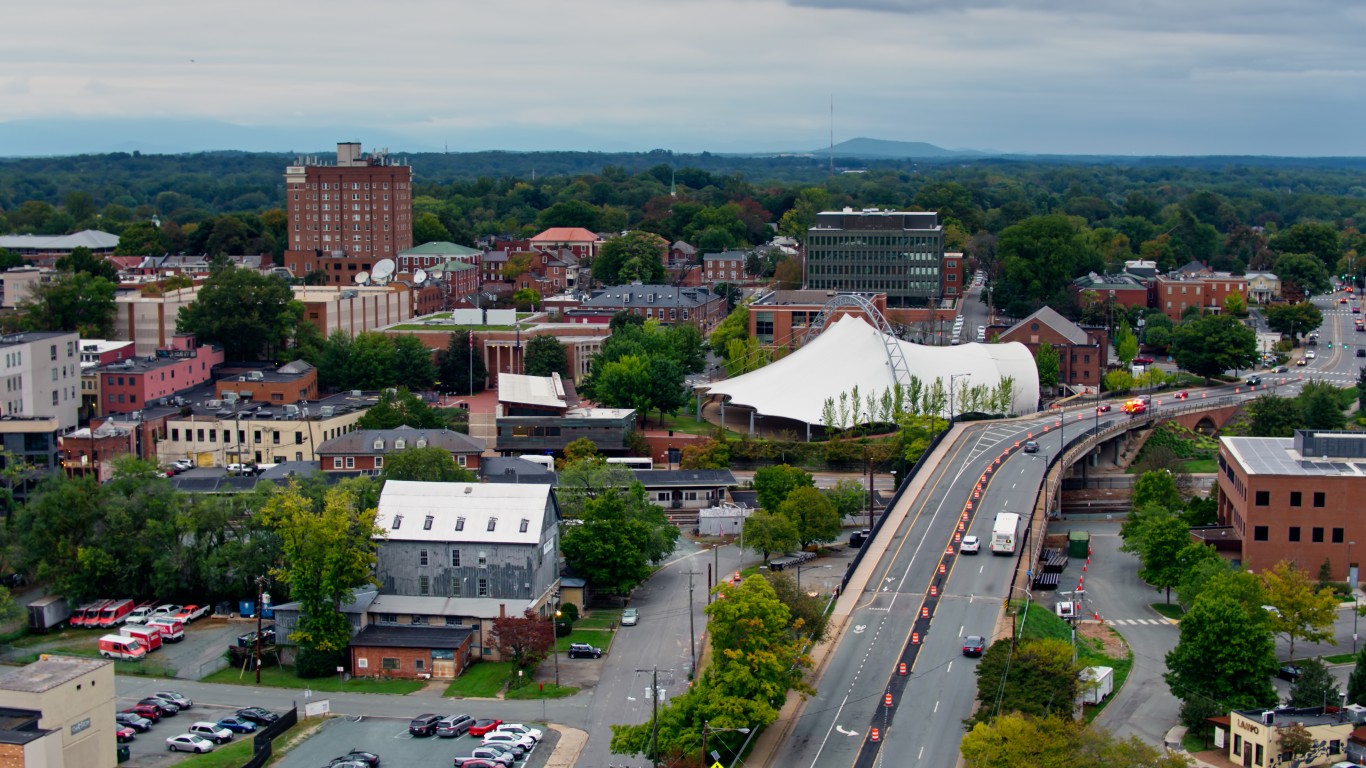
- > “Creative class” as share of all jobs, 2022: 15.7% (+5.6 ppts. from 2018)
- > Avg. annual “creative class” wage, 2022: $102,832 (+7.9% from 2018)
- > Most concentrated “creative class” jobs: Landscape architects; medical scientists, except epidemiologists; physical scientists
24. Lincoln, NE
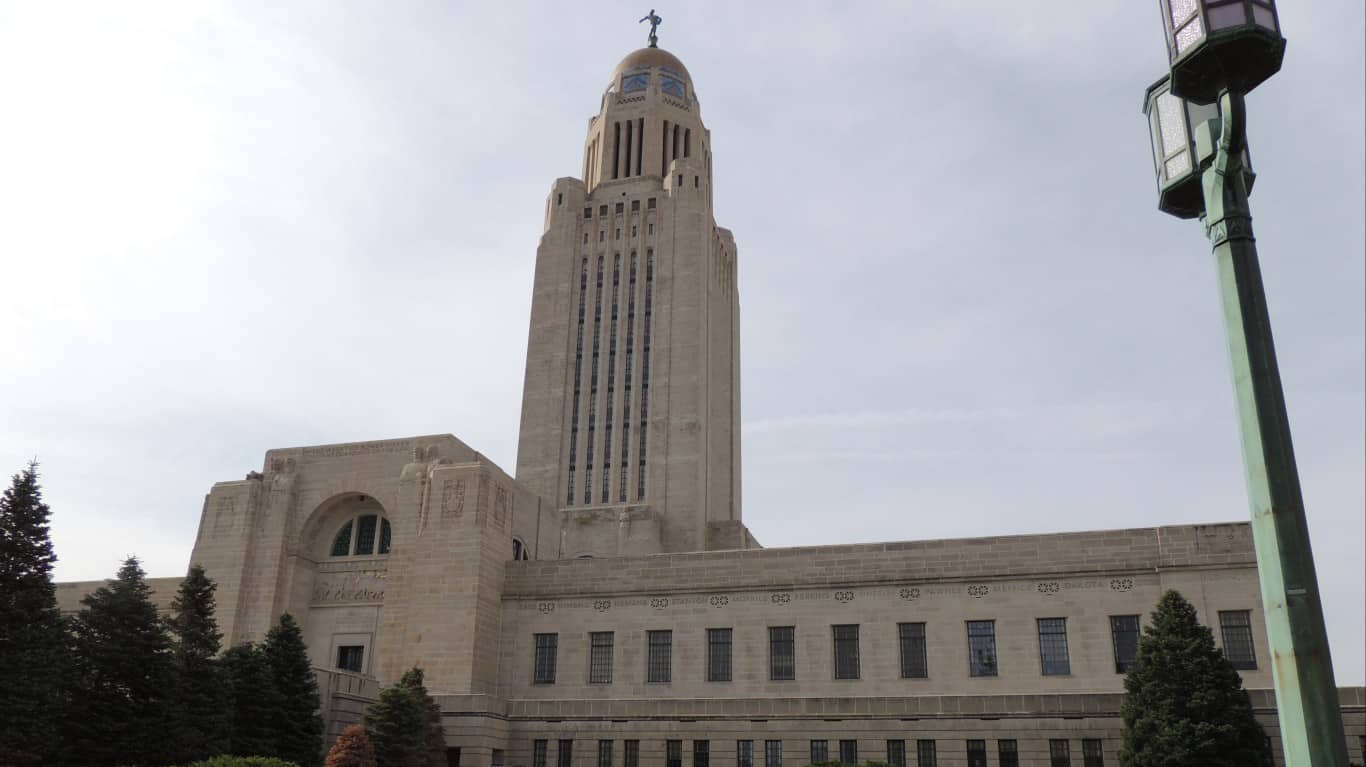
- > “Creative class” as share of all jobs, 2022: 17.6% (+5.6 ppts. from 2018)
- > Avg. annual “creative class” wage, 2022: $87,096 (+13.8% from 2018)
- > Most concentrated “creative class” jobs: Postsecondary agricultural sciences teachers; choreographers; soil and plant scientists
23. Provo-Orem, UT
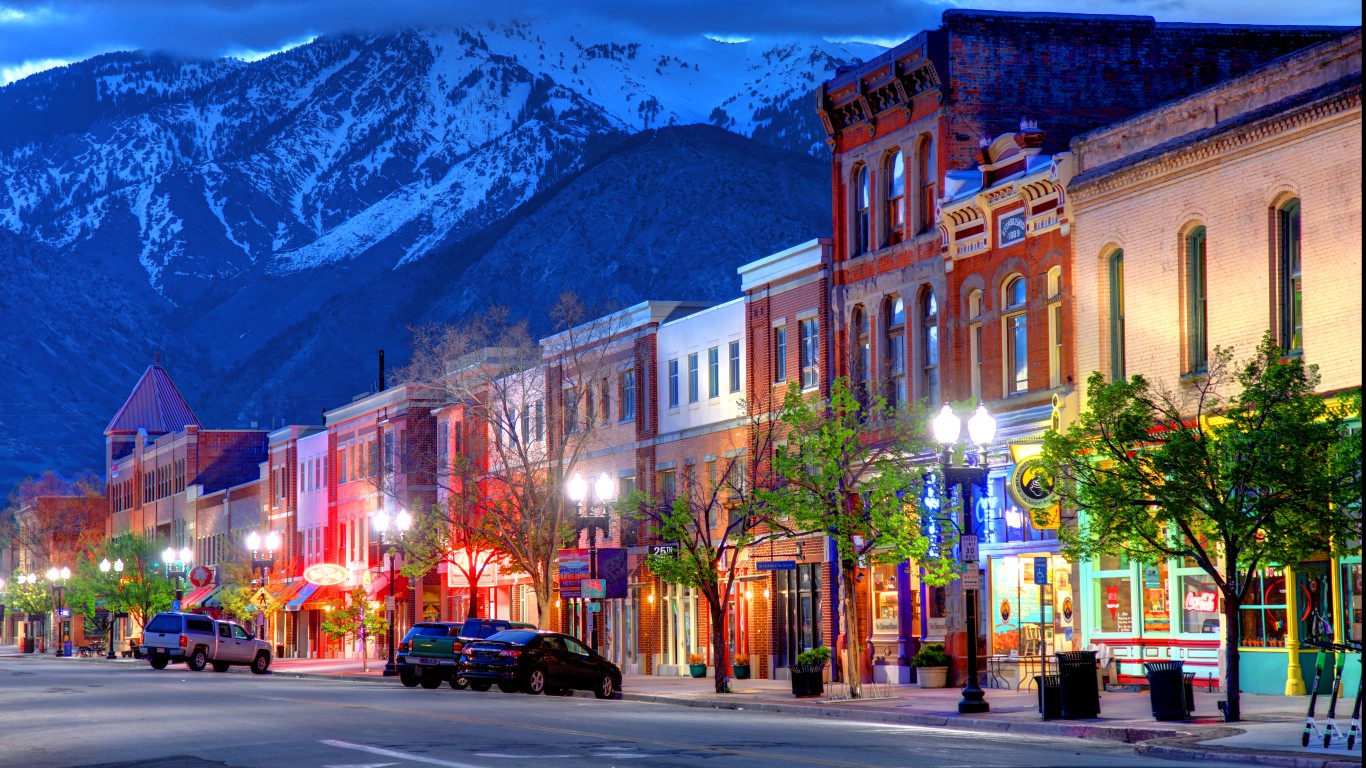
- > “Creative class” as share of all jobs, 2022: 19.1% (+5.6 ppts. from 2018)
- > Avg. annual “creative class” wage, 2022: $96,780 (+20.4% from 2018)
- > Most concentrated “creative class” jobs: Umpires, referees, and other sports officials; web developers; writers and authors
22. State College, PA
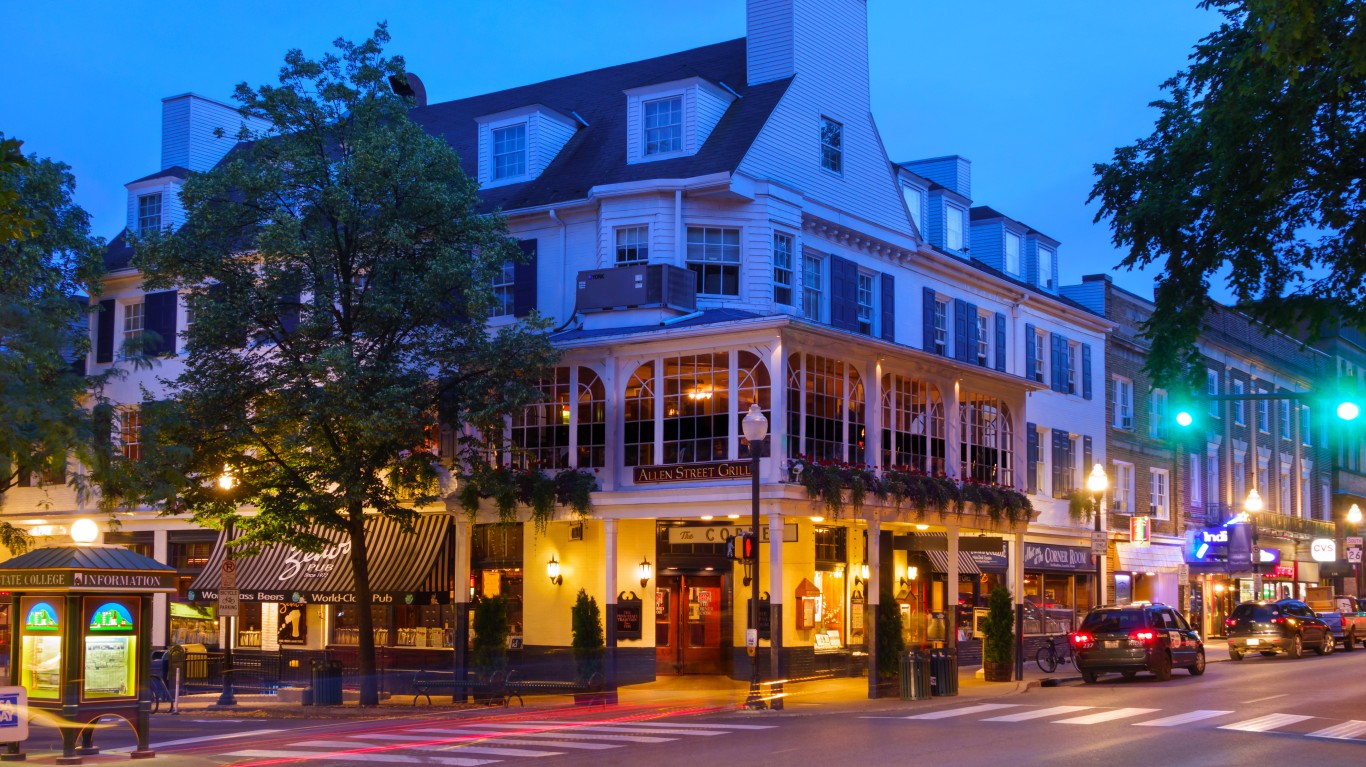
- > “Creative class” as share of all jobs, 2022: 14.2% (+5.7 ppts. from 2018)
- > Avg. annual “creative class” wage, 2022: $91,109 (+12.7% from 2018)
- > Most concentrated “creative class” jobs: Engineers; computer programmers; statisticians
21. Morgantown, WV
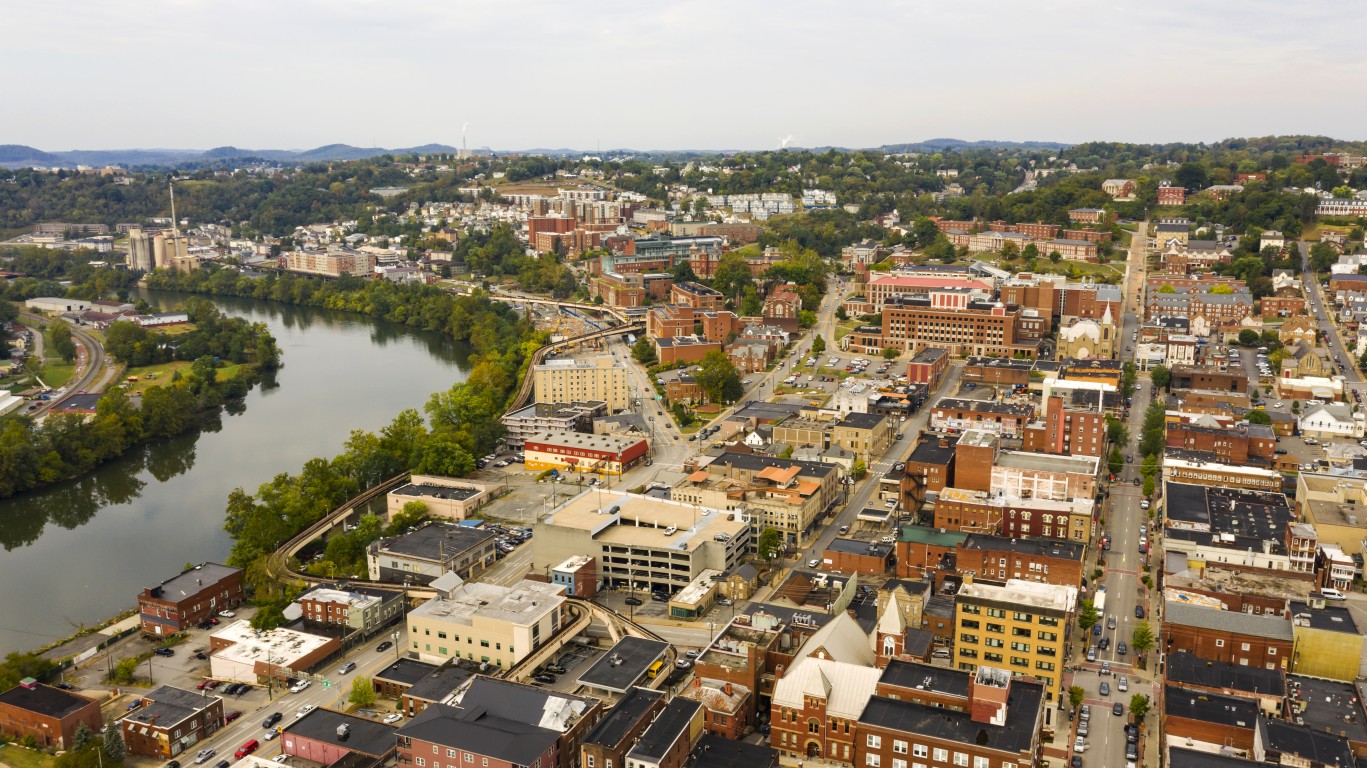
- > “Creative class” as share of all jobs, 2022: 13.6% (+5.7 ppts. from 2018)
- > Avg. annual “creative class” wage, 2022: $99,182 (+9.2% from 2018)
- > Most concentrated “creative class” jobs: Postsecondary health specialties teachers; postsecondary education administrators; web developers
20. Columbus, IN
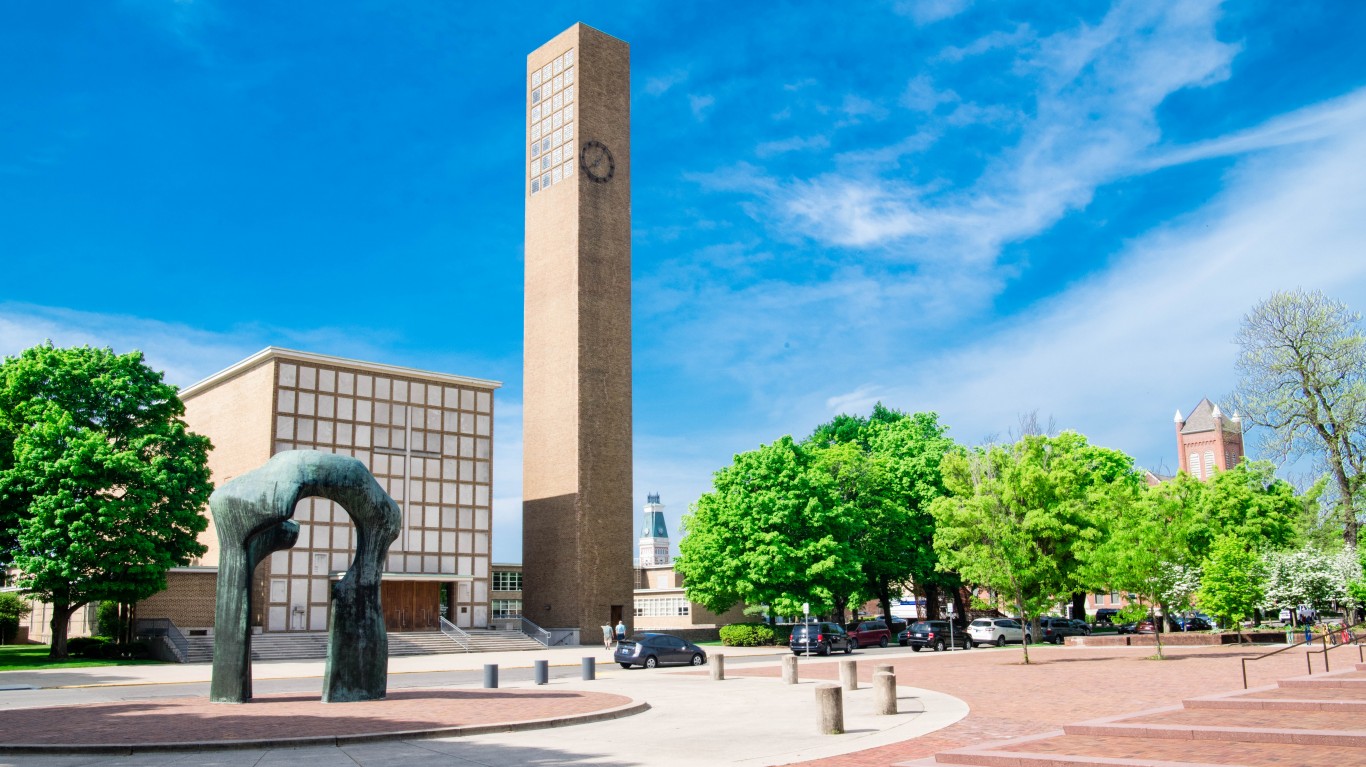
- > “Creative class” as share of all jobs, 2022: 12.1% (+5.8 ppts. from 2018)
- > Avg. annual “creative class” wage, 2022: $98,659 (+29.0% from 2018)
- > Most concentrated “creative class” jobs: Industrial engineers; mechanical engineers; industrial production managers
19. Bloomington, IN
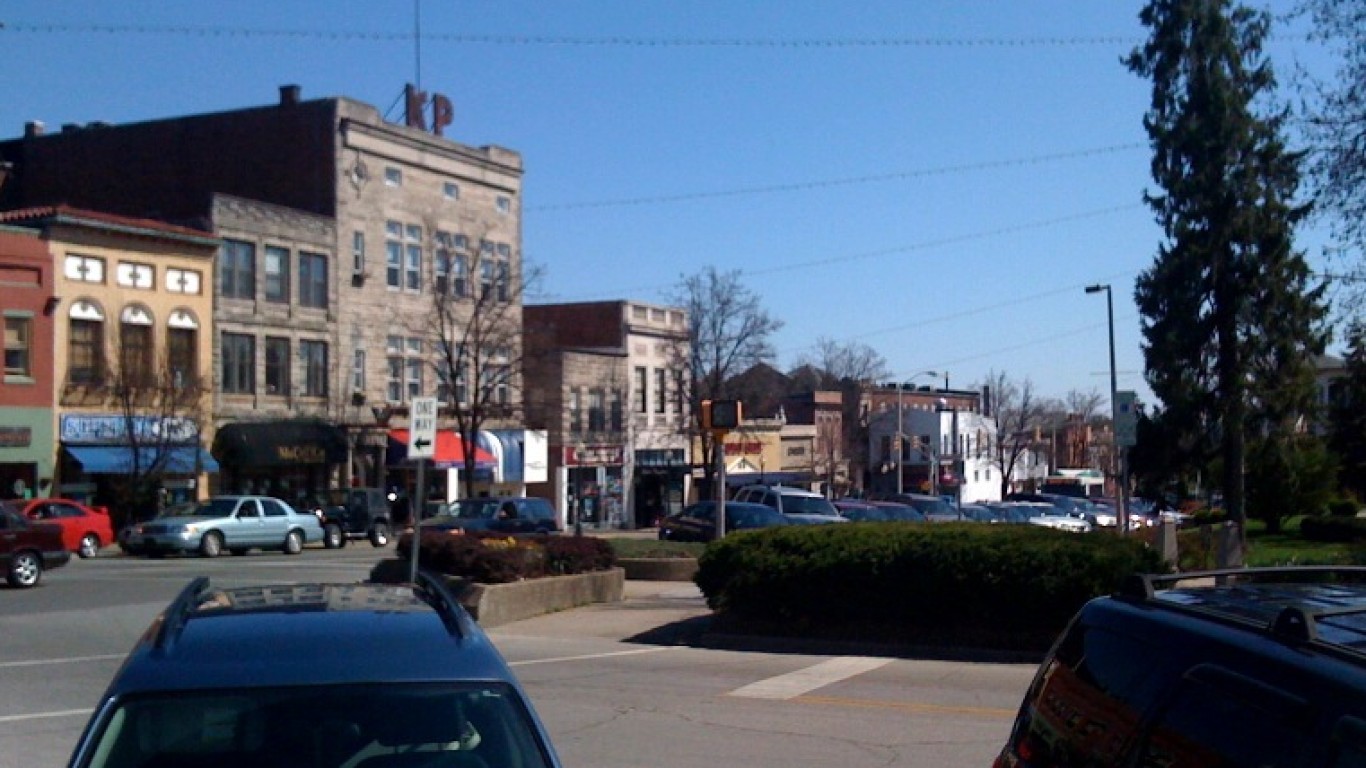
- > “Creative class” as share of all jobs, 2022: 13.2% (+5.8 ppts. from 2018)
- > Avg. annual “creative class” wage, 2022: $92,193 (+20.5% from 2018)
- > Most concentrated “creative class” jobs: Postsecondary environmental science teachers; curators; court reporters and simultaneous captioners
18. Omaha-Council Bluffs, NE-IA
- > “Creative class” as share of all jobs, 2022: 18.1% (+5.8 ppts. from 2018)
- > Avg. annual “creative class” wage, 2022: $95,416 (+16.5% from 2018)
- > Most concentrated “creative class” jobs: Food scientists and technologists; personal service managers; soil and plant scientists
17. Tallahassee, FL
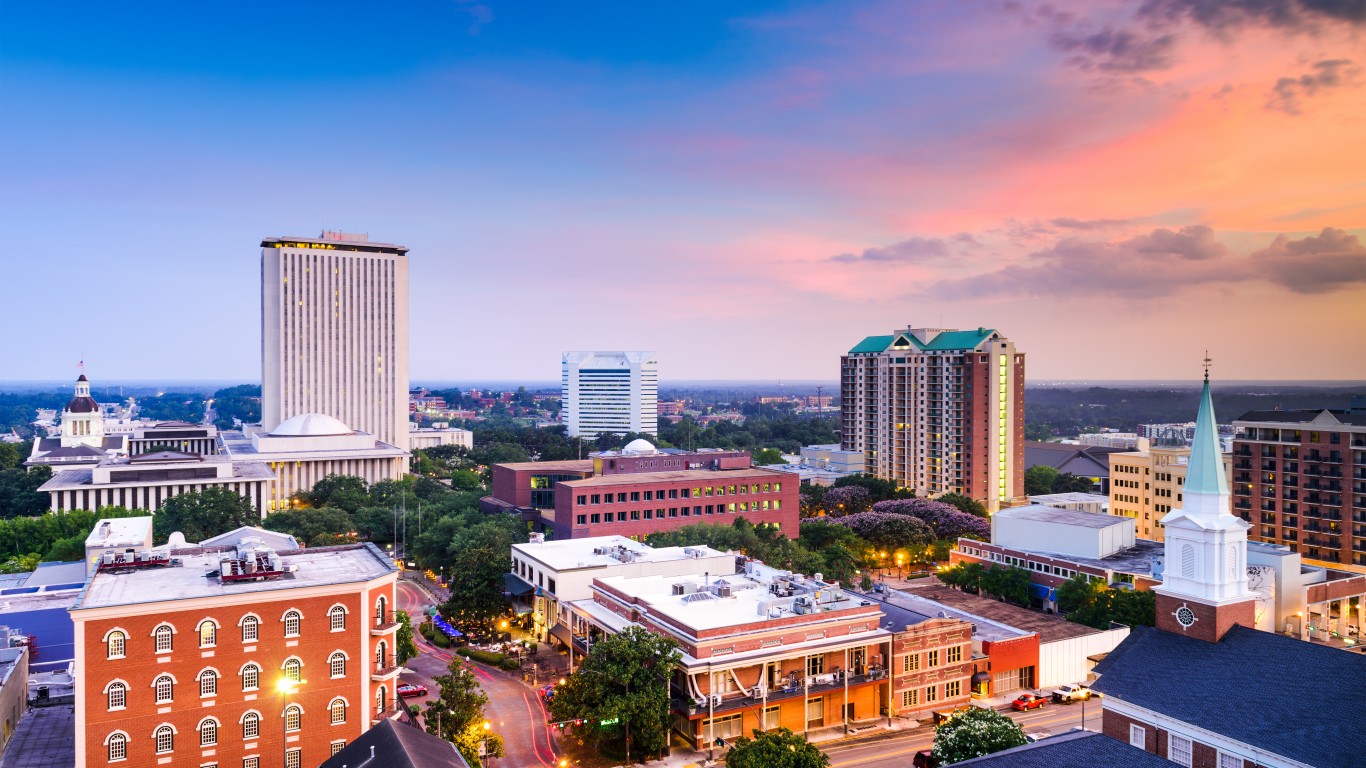
- > “Creative class” as share of all jobs, 2022: 16.5% (+5.8 ppts. from 2018)
- > Avg. annual “creative class” wage, 2022: $81,123 (+9.7% from 2018)
- > Most concentrated “creative class” jobs: Environmental scientists and specialists, including health; zoologists and wildlife biologists; anthropologists and archeologists
16. Durham-Chapel Hill, NC
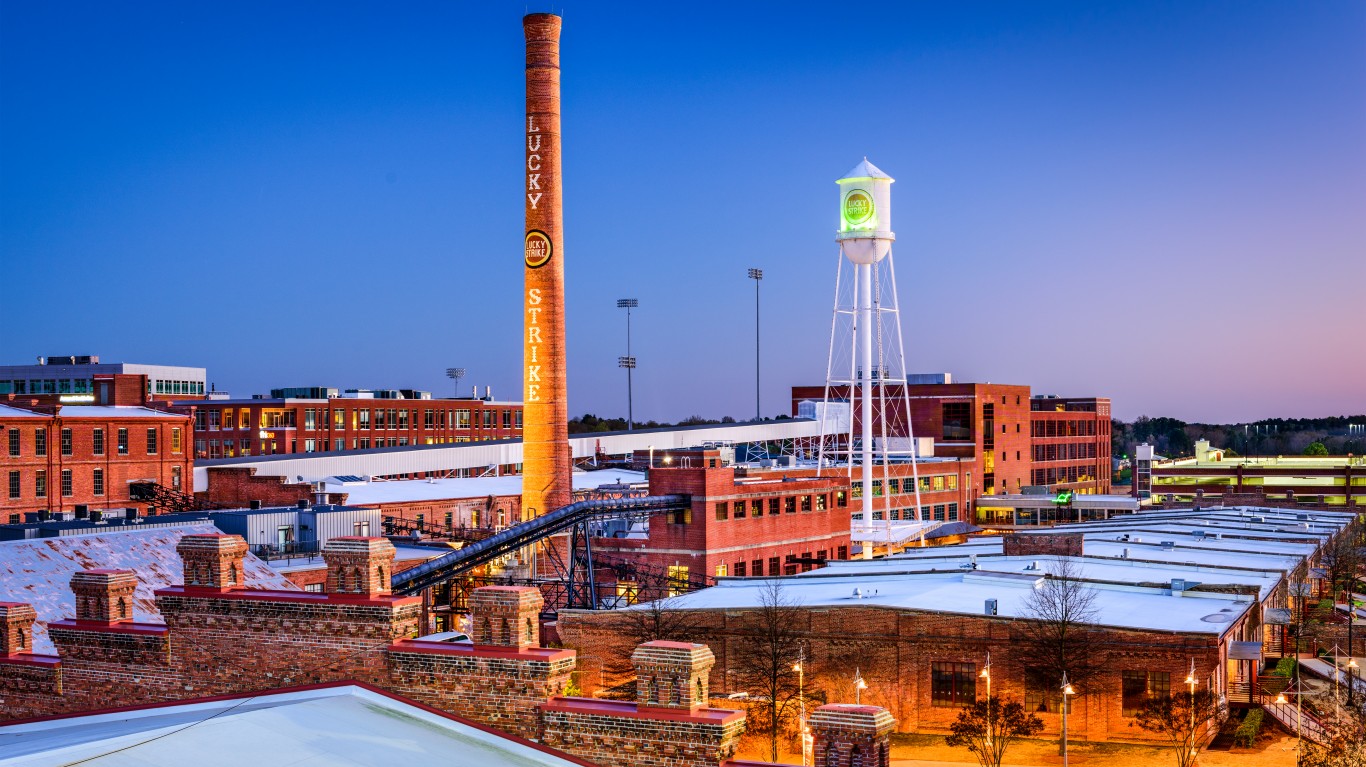
- > “Creative class” as share of all jobs, 2022: 22.1% (+6.0 ppts. from 2018)
- > Avg. annual “creative class” wage, 2022: $118,789 (+6.9% from 2018)
- > Most concentrated “creative class” jobs: Sociologists; life scientists; statisticians
15. Corvallis, OR
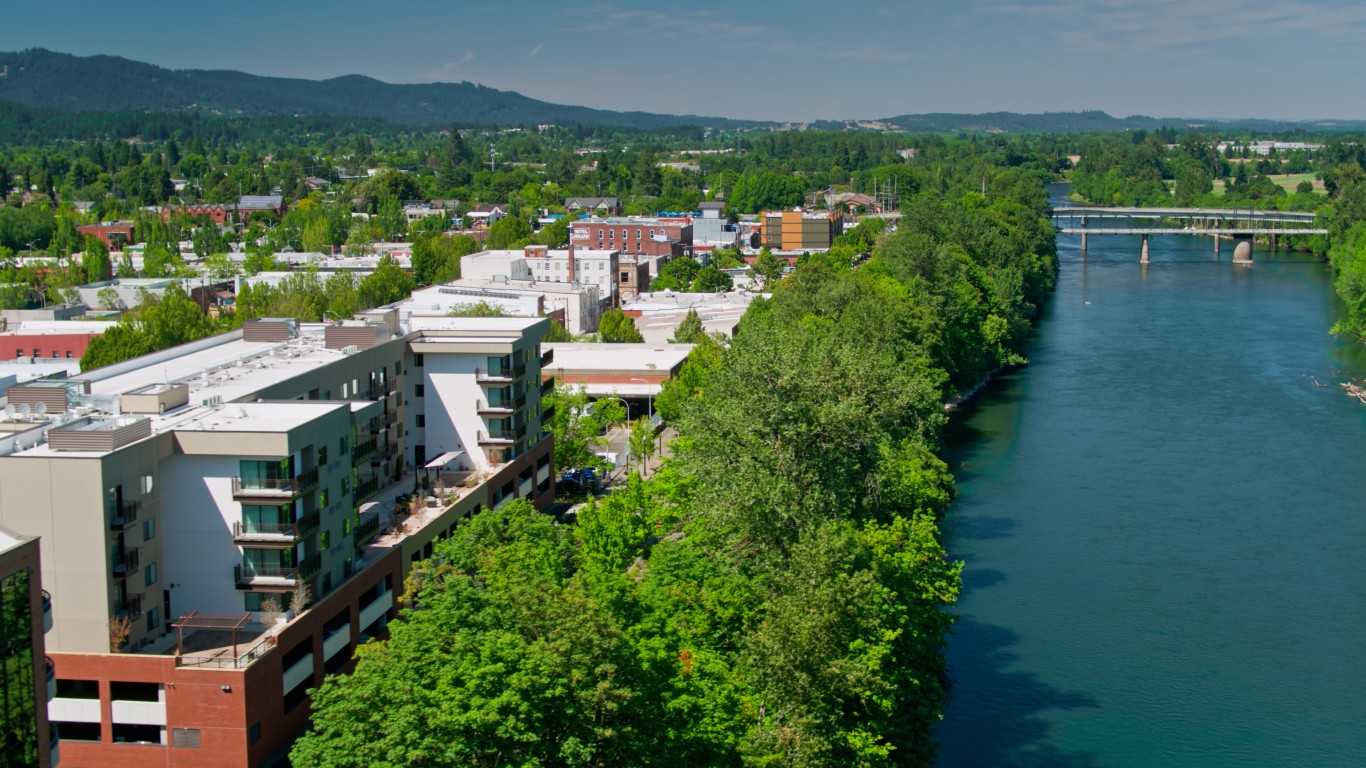
- > “Creative class” as share of all jobs, 2022: 15.1% (+6.0 ppts. from 2018)
- > Avg. annual “creative class” wage, 2022: $99,580 (+29.2% from 2018)
- > Most concentrated “creative class” jobs: Zoologists and wildlife biologists; cartographers and photogrammetrists; soil and plant scientists
14. Waterloo-Cedar Falls, IA
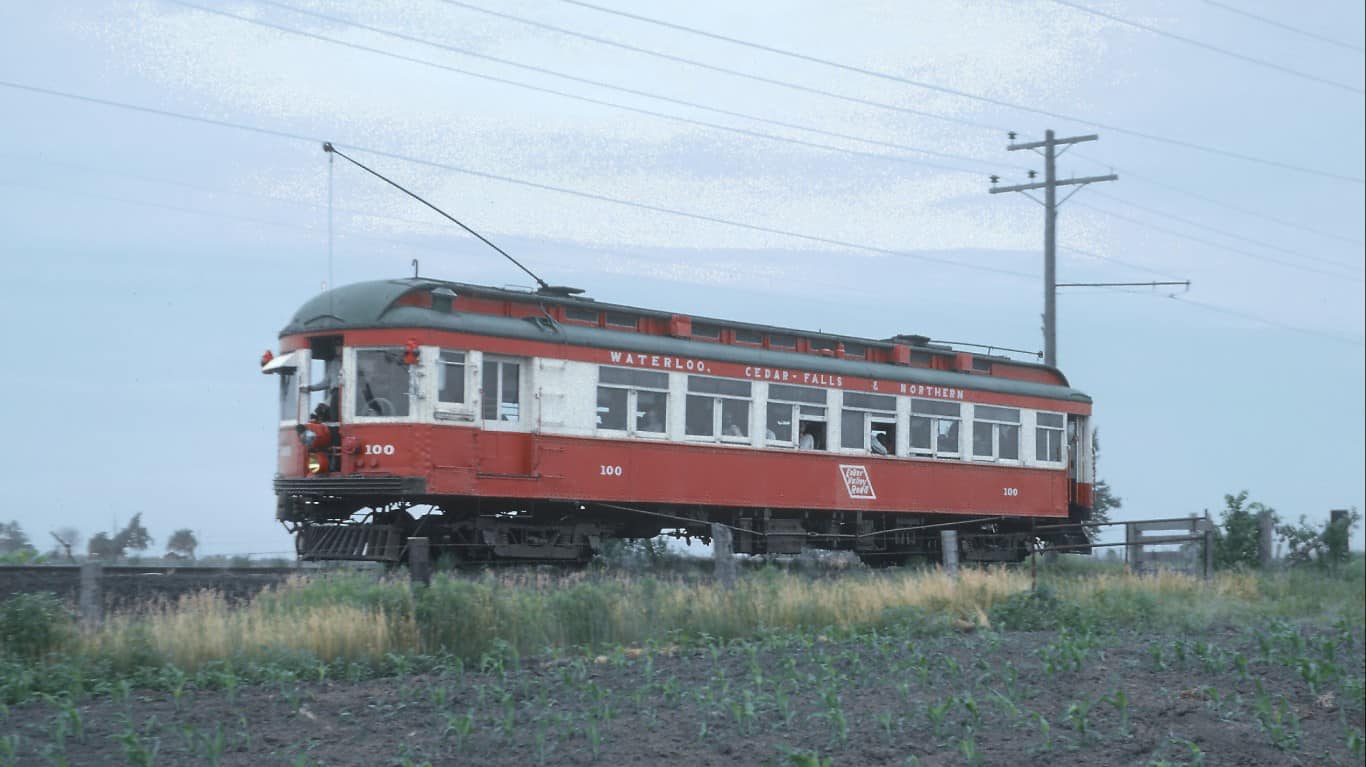
- > “Creative class” as share of all jobs, 2022: 14.5% (+6.5 ppts. from 2018)
- > Avg. annual “creative class” wage, 2022: $89,086 (+24.1% from 2018)
- > Most concentrated “creative class” jobs: Mechanical engineers; personal service managers; industrial engineers
13. Midland, MI
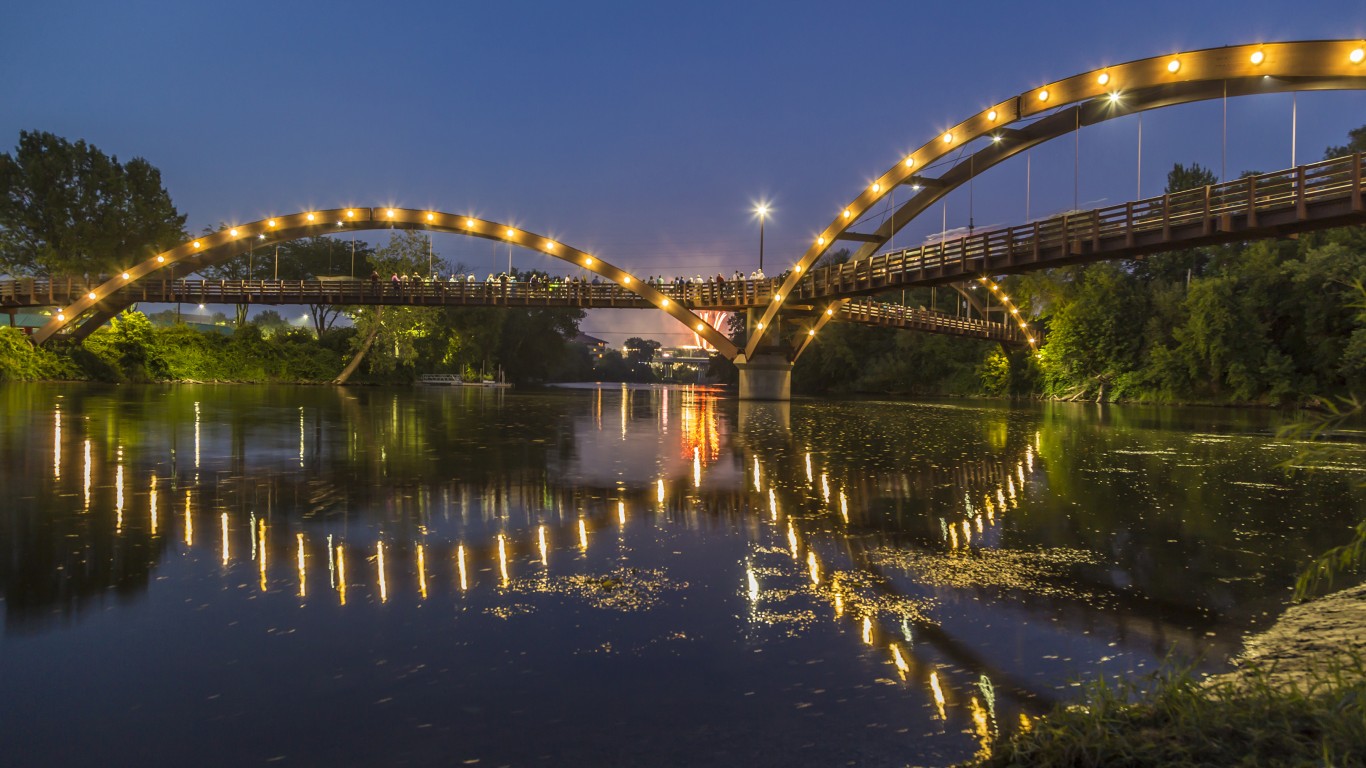
- > “Creative class” as share of all jobs, 2022: 14.4% (+6.8 ppts. from 2018)
- > Avg. annual “creative class” wage, 2022: $111,815 (+16.8% from 2018)
- > Most concentrated “creative class” jobs: Chemists; purchasing managers; industrial production managers
12. Baltimore-Columbia-Towson, MD
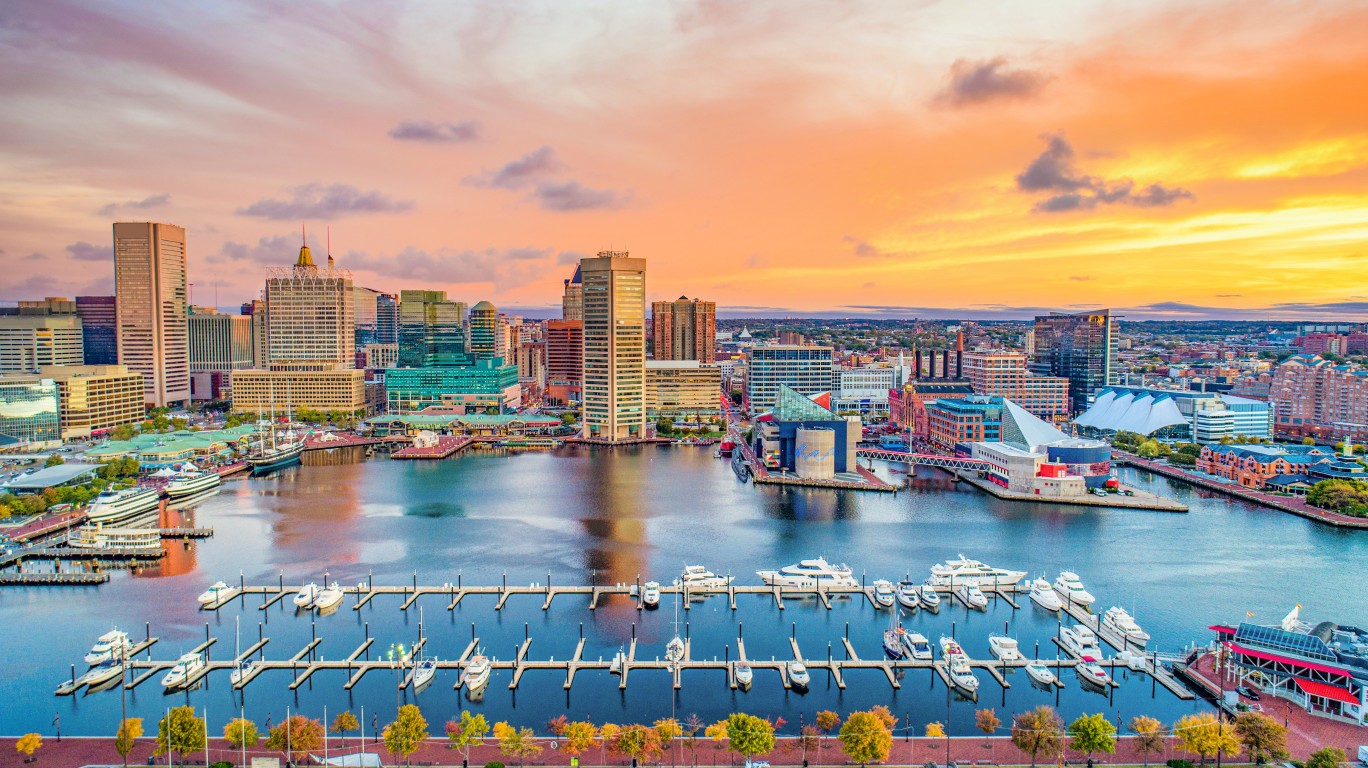
- > “Creative class” as share of all jobs, 2022: 19.9% (+6.8 ppts. from 2018)
- > Avg. annual “creative class” wage, 2022: $113,597 (+12.2% from 2018)
- > Most concentrated “creative class” jobs: Physical scientists; atmospheric and space scientists; information security analysts
11. Dallas-Fort Worth-Arlington, TX
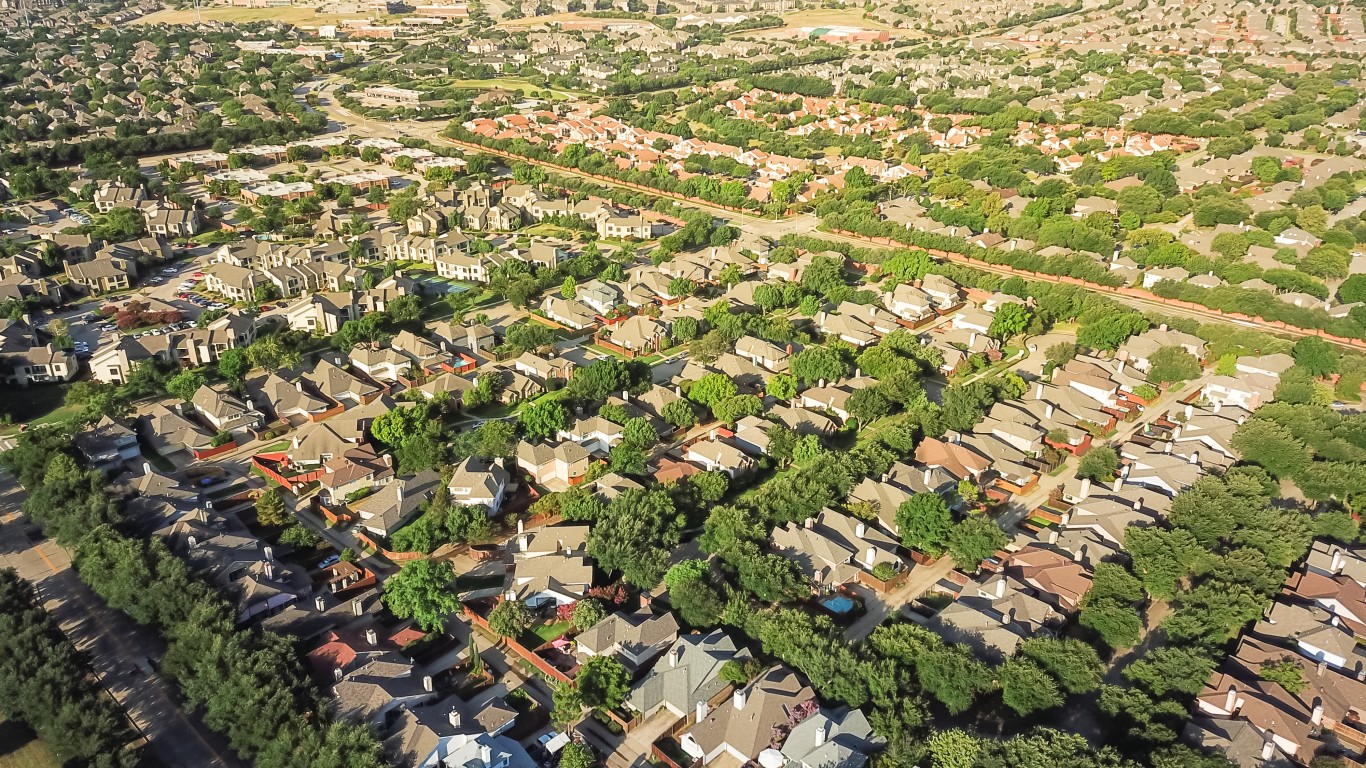
- > “Creative class” as share of all jobs, 2022: 18.5% (+7.0 ppts. from 2018)
- > Avg. annual “creative class” wage, 2022: $109,495 (+12.6% from 2018)
- > Most concentrated “creative class” jobs: Sales engineers; petroleum engineers; court reporters and simultaneous captioners
10. Raleigh, NC
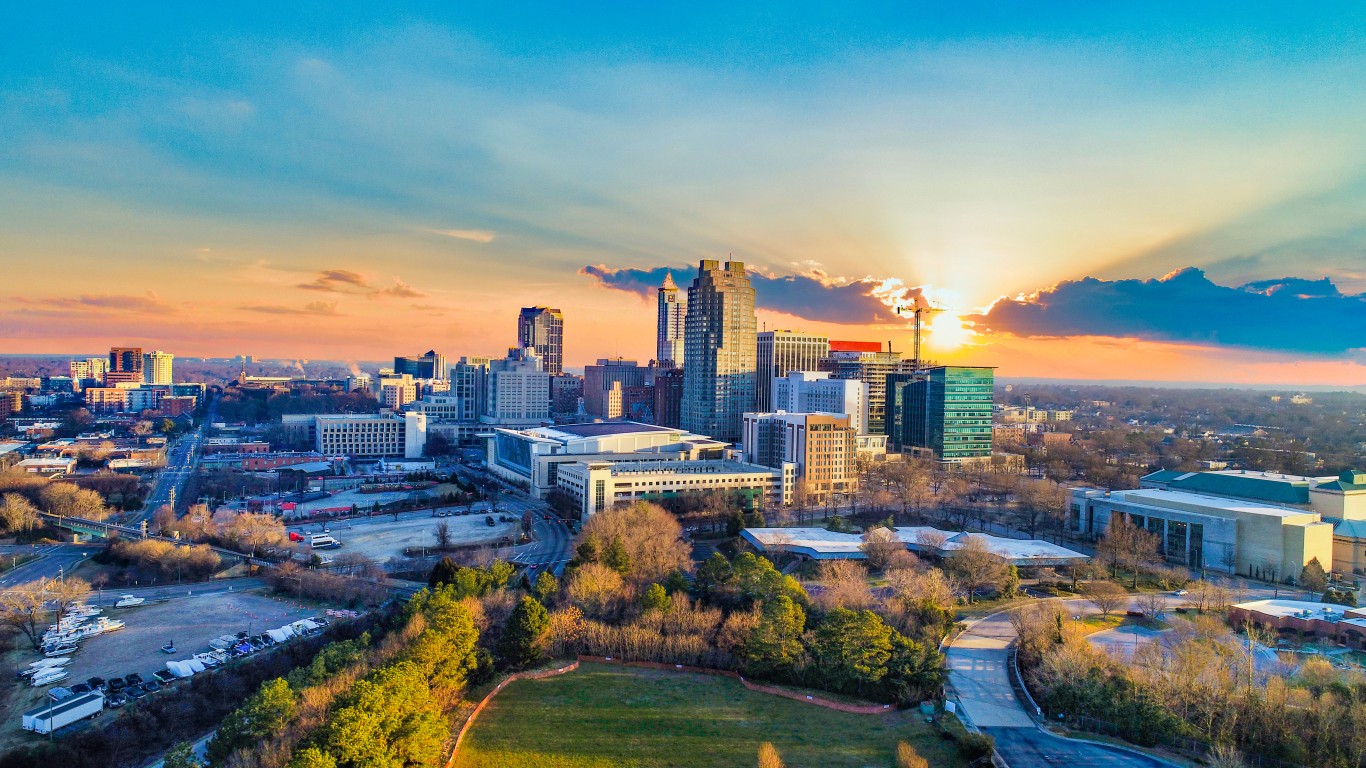
- > “Creative class” as share of all jobs, 2022: 20.2% (+7.4 ppts. from 2018)
- > Avg. annual “creative class” wage, 2022: $107,597 (+13.3% from 2018)
- > Most concentrated “creative class” jobs: Postsecondary social work teachers; soil and plant scientists; life scientists
9. California-Lexington Park, MD
- > “Creative class” as share of all jobs, 2022: 26.4% (+7.9 ppts. from 2018)
- > Avg. annual “creative class” wage, 2022: $118,212 (+2.7% from 2018)
- > Most concentrated “creative class” jobs: Aerospace engineers; computer and information research scientists; electronics engineers, except computer
8. Huntsville, AL
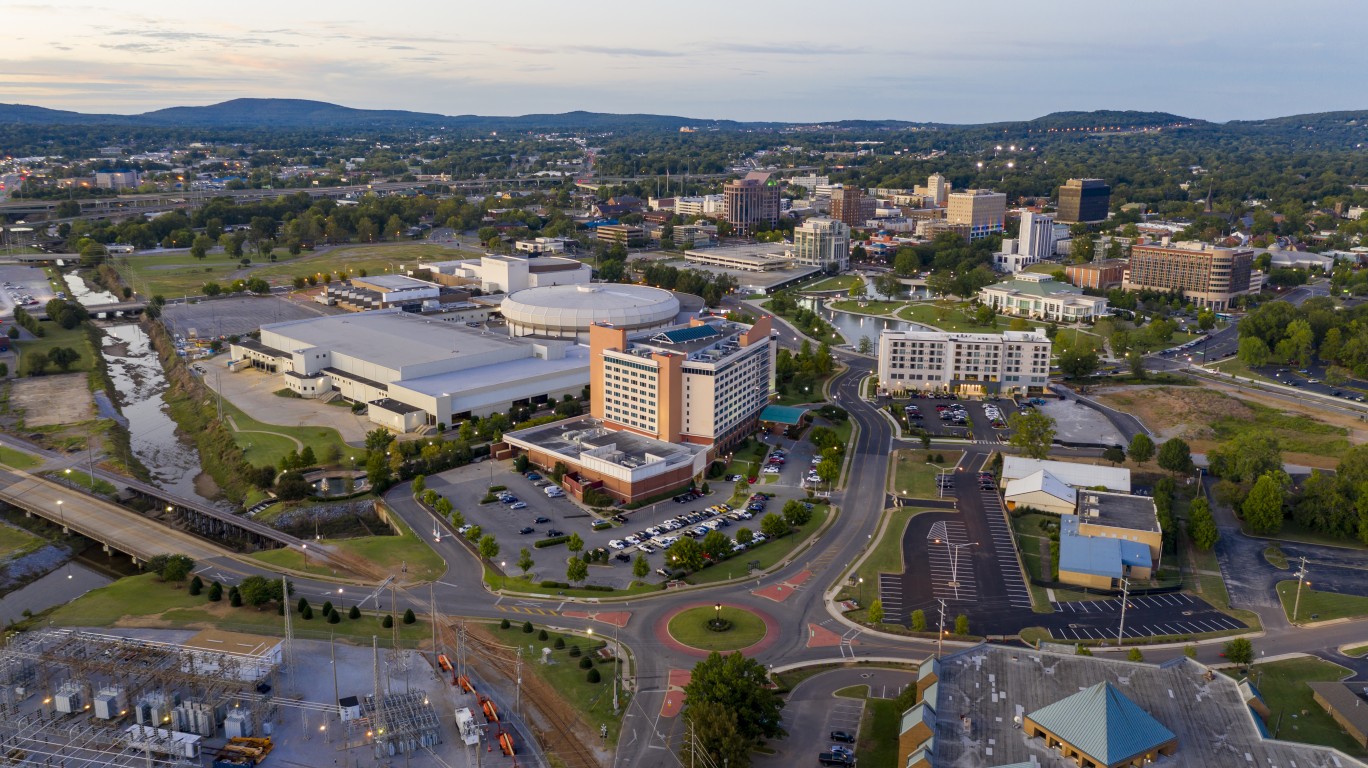
- > “Creative class” as share of all jobs, 2022: 23.8% (+8.1 ppts. from 2018)
- > Avg. annual “creative class” wage, 2022: $110,918 (+10.4% from 2018)
- > Most concentrated “creative class” jobs: Aerospace engineers; engineers; atmospheric and space scientists
7. Seattle-Tacoma-Bellevue, WA
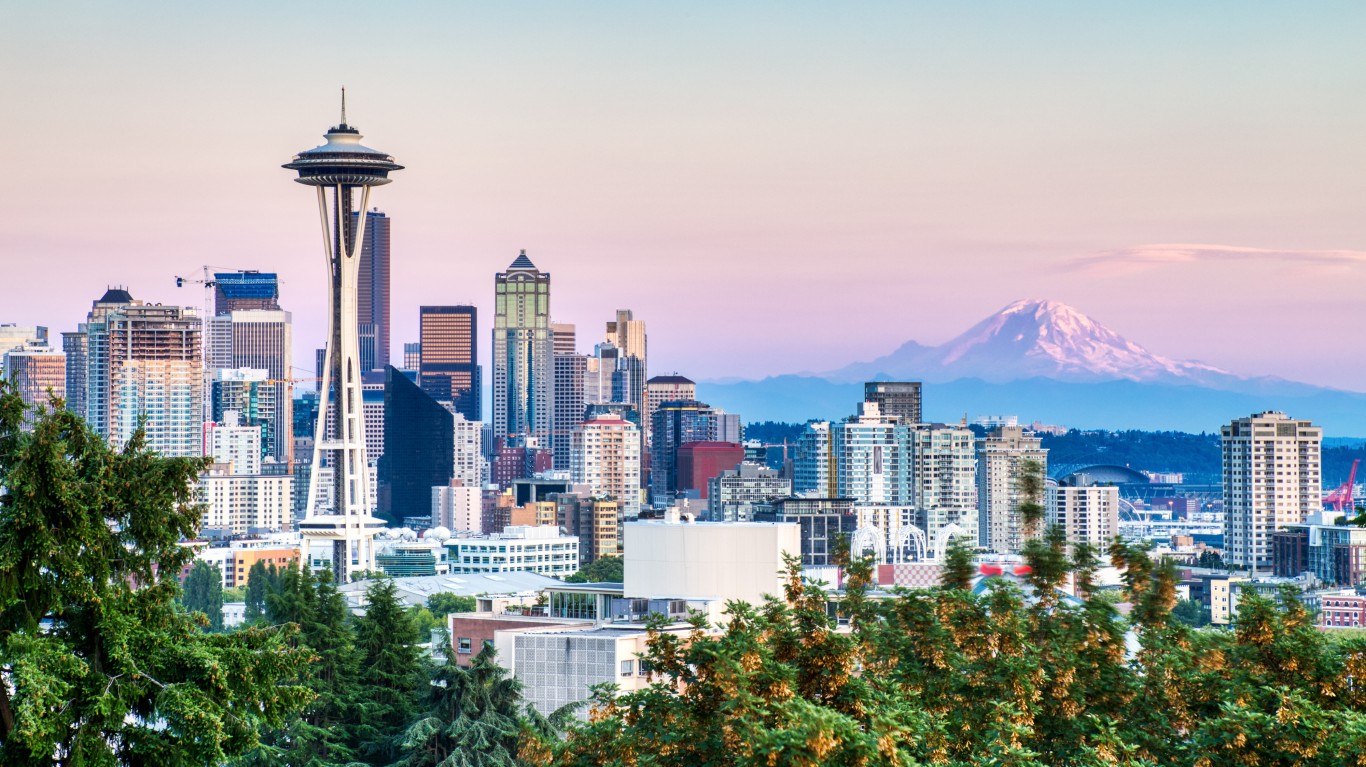
- > “Creative class” as share of all jobs, 2022: 21.8% (+8.2 ppts. from 2018)
- > Avg. annual “creative class” wage, 2022: $129,088 (+21.9% from 2018)
- > Most concentrated “creative class” jobs: Mathematical science occupations; special effects artists and animators; epidemiologists
6. Washington-Arlington-Alexandria, DC-VA-MD-WV
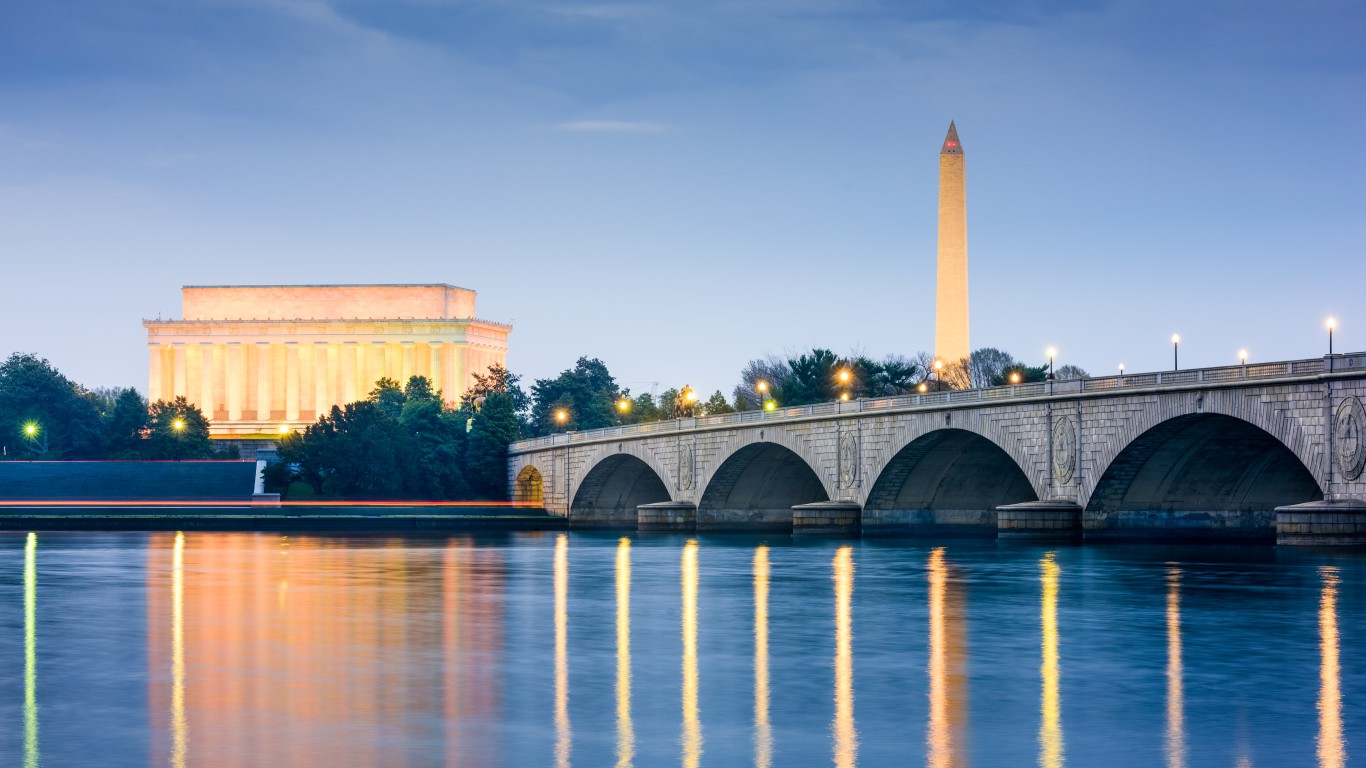
- > “Creative class” as share of all jobs, 2022: 27.0% (+8.6 ppts. from 2018)
- > Avg. annual “creative class” wage, 2022: $135,108 (+10.7% from 2018)
- > Most concentrated “creative class” jobs: Political scientists; economists; artists and related workers
5. San Francisco-Oakland-Hayward, CA
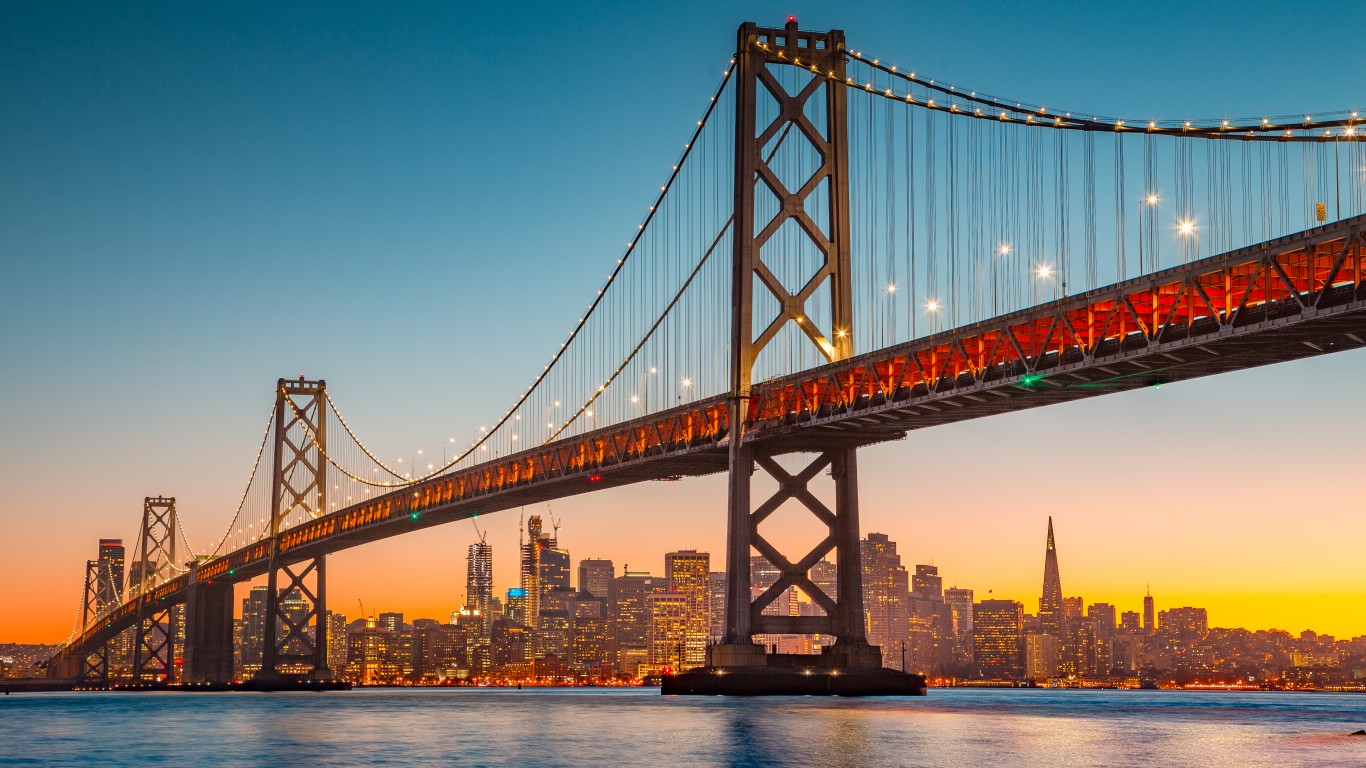
- > “Creative class” as share of all jobs, 2022: 25.3% (+8.6 ppts. from 2018)
- > Avg. annual “creative class” wage, 2022: $158,176 (+26.3% from 2018)
- > Most concentrated “creative class” jobs: Physicists; biochemists and biophysicists; biological scientists
4. Trenton, NJ
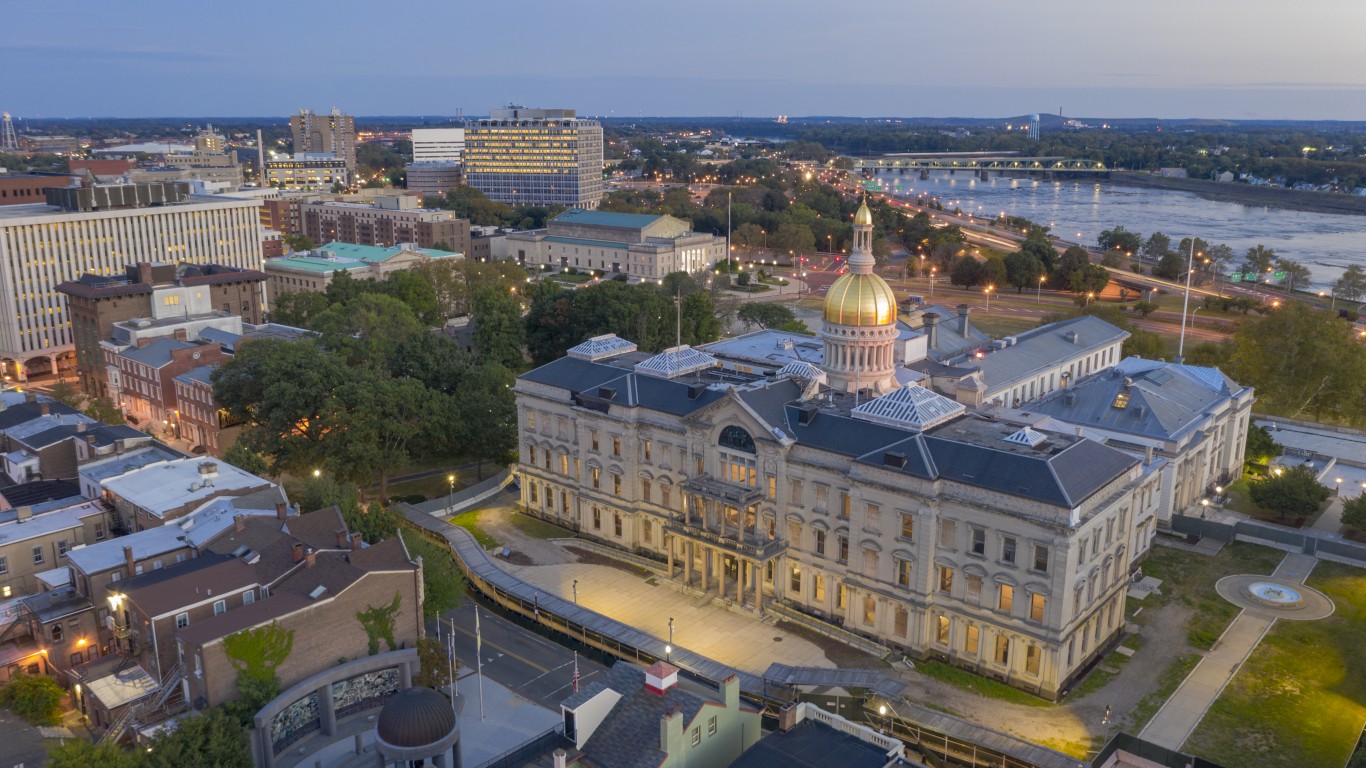
- > “Creative class” as share of all jobs, 2022: 23.6% (+8.6 ppts. from 2018)
- > Avg. annual “creative class” wage, 2022: $126,968 (+11.4% from 2018)
- > Most concentrated “creative class” jobs: Natural sciences managers; medical scientists, except epidemiologists; environmental scientists and specialists, including health
3. Austin-Round Rock, TX
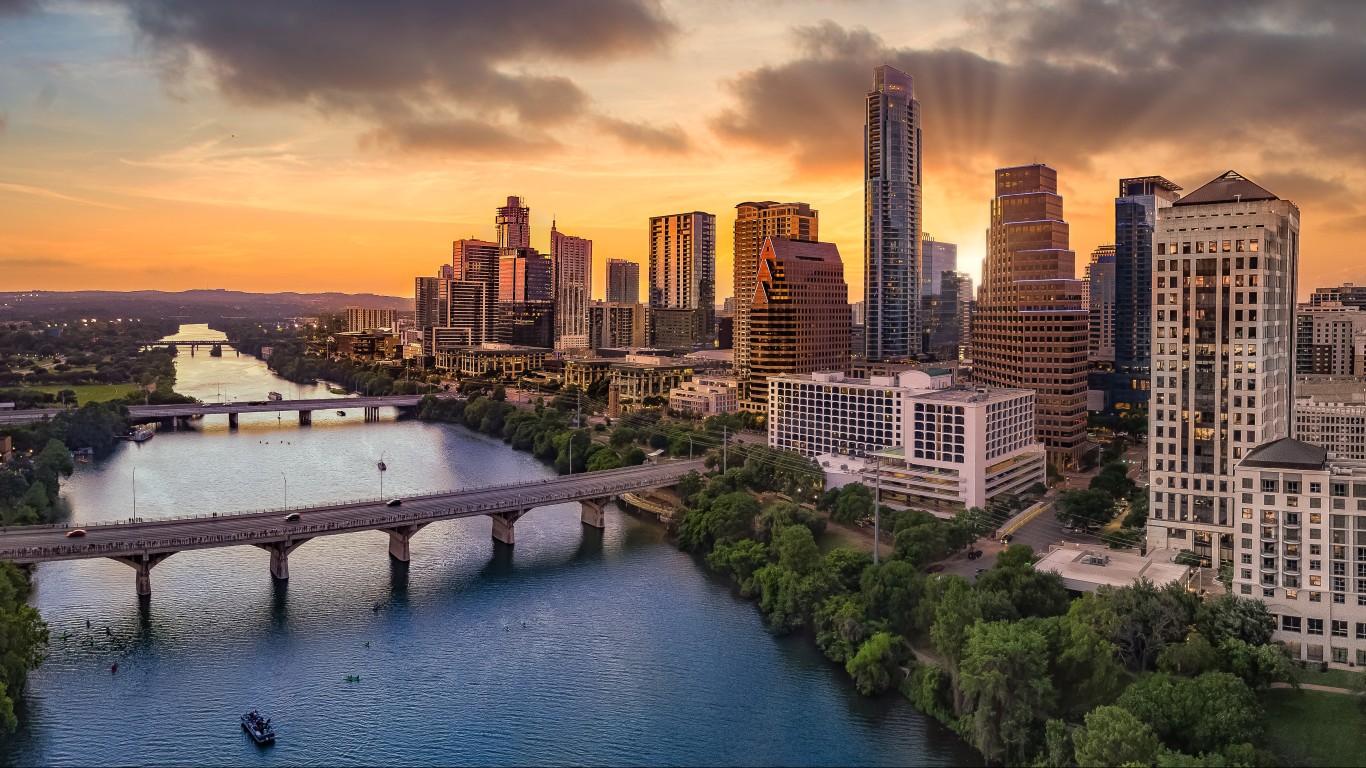
- > “Creative class” as share of all jobs, 2022: 22.5% (+9.0 ppts. from 2018)
- > Avg. annual “creative class” wage, 2022: $108,298 (+15.1% from 2018)
- > Most concentrated “creative class” jobs: Geoscientists, except hydrologists and geographers; computer occupations; sales engineers
2. Boulder, CO
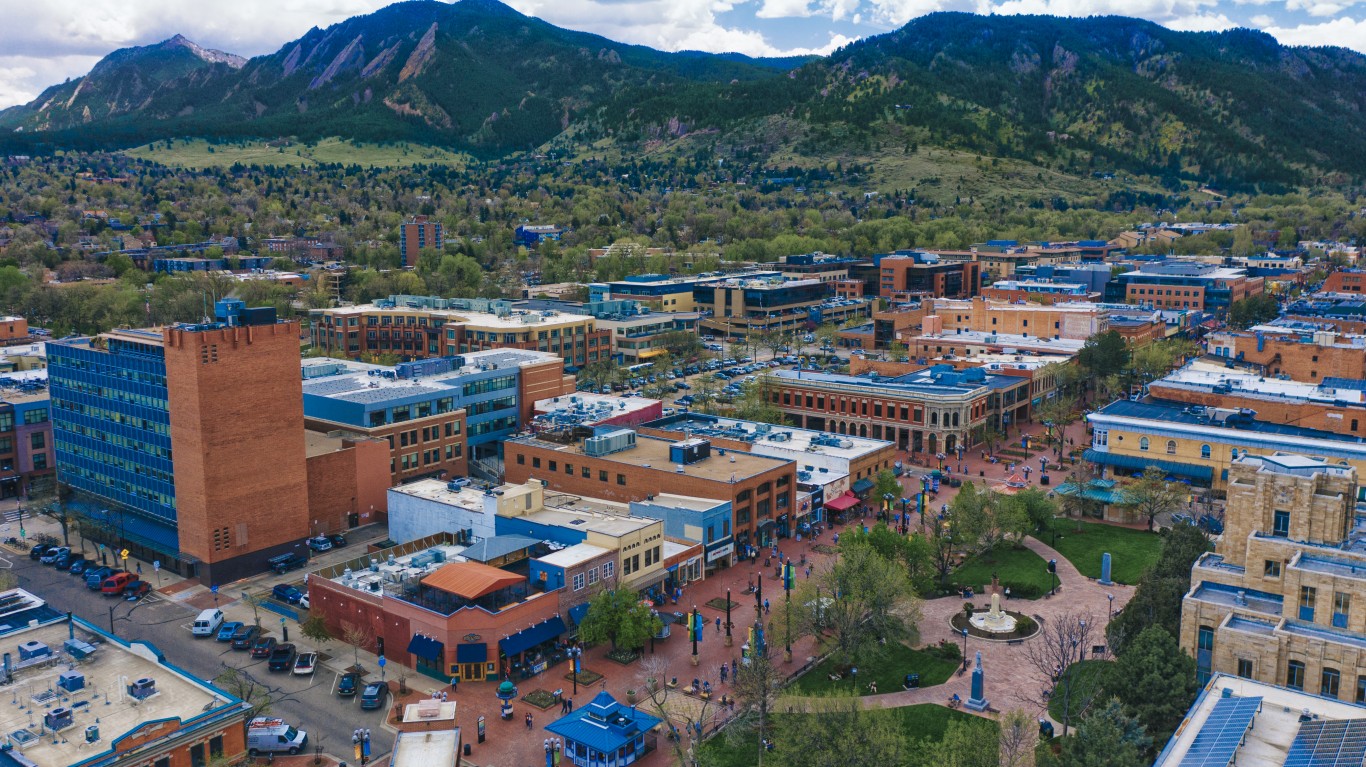
- > “Creative class” as share of all jobs, 2022: 27.5% (+9.2 ppts. from 2018)
- > Avg. annual “creative class” wage, 2022: $125,303 (+19.0% from 2018)
- > Most concentrated “creative class” jobs: Atmospheric and space scientists; physicists; aerospace engineers
1. San Jose-Sunnyvale-Santa Clara, CA
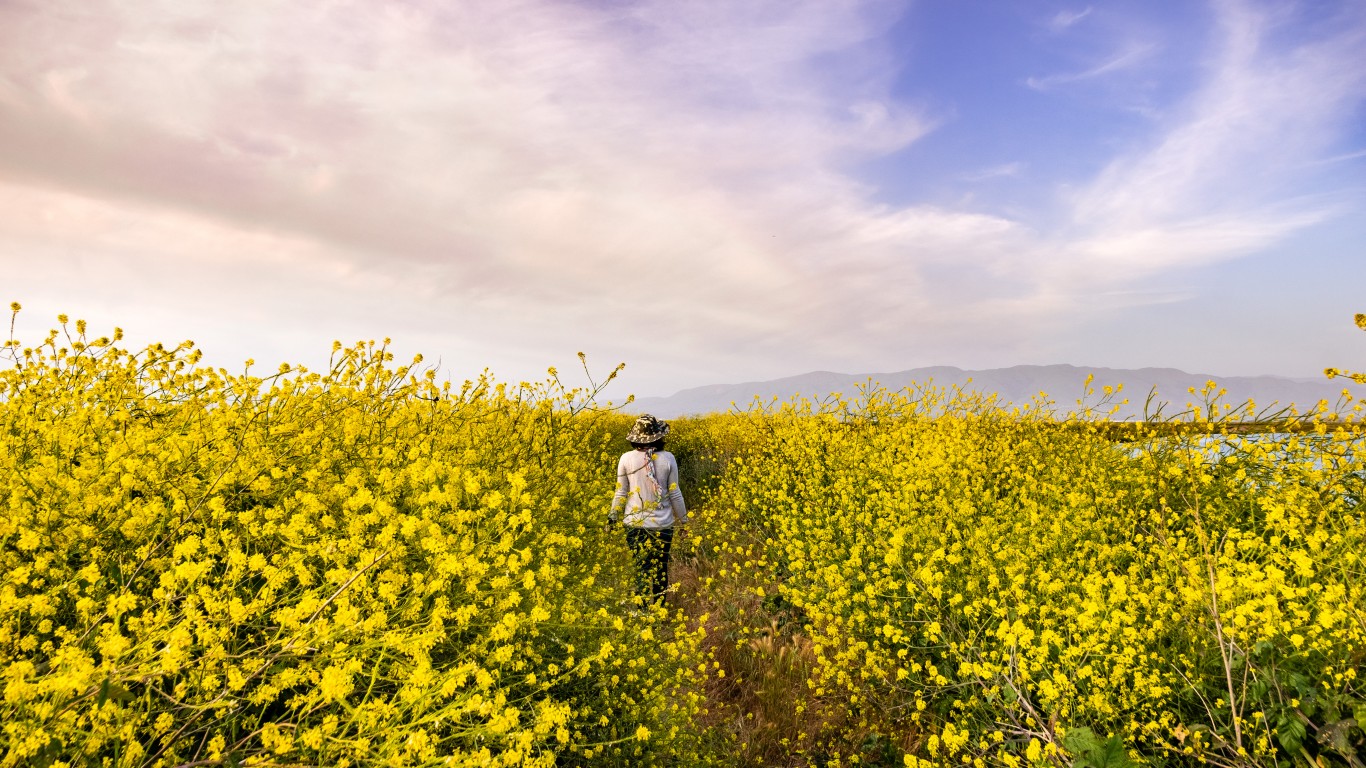
- > “Creative class” as share of all jobs, 2022: 32.4% (+16.0 ppts. from 2018)
- > Avg. annual “creative class” wage, 2022: $191,391 (+43.0% from 2018)
- > Most concentrated “creative class” jobs: Computer hardware engineers; sales engineers; computer and information research scientists
Methodology
To determine the cities with the fastest-growing creative classes, 24/7 Wall St. reviewed data on employment by detailed occupation from the Occupational Employment and Wage Statistics program of the Bureau of Labor Statistics. Metropolitan statistical areas were ranked based on the percentage-point change in “creative class” occupations as a percentage of all occupations from 2018 to 2022. The “creative class” includes scientists and engineers, university professors, artists, architects, and other creative occupations, and are formally classified within the federal Standard Occupation Classification system for detailed occupations by the Economic Research Service of the U.S. Department of Agriculture. Data used to calculate weighted average annual wage among “creative class” occupations, as well as the most concentrated “creative class” occupations — measured by location quotient — also came from the BLS OEWS.
Are You Still Paying With a Debit Card?
The average American spends $17,274 on debit cards a year, and it’s a HUGE mistake. First, debit cards don’t have the same fraud protections as credit cards. Once your money is gone, it’s gone. But more importantly you can actually get something back from this spending every time you swipe.
Issuers are handing out wild bonuses right now. With some you can earn up to 5% back on every purchase. That’s like getting a 5% discount on everything you buy!
Our top pick is kind of hard to imagine. Not only does it pay up to 5% back, it also includes a $200 cash back reward in the first six months, a 0% intro APR, and…. $0 annual fee. It’s quite literally free money for any one that uses a card regularly. Click here to learn more!
Flywheel Publishing has partnered with CardRatings to provide coverage of credit card products. Flywheel Publishing and CardRatings may receive a commission from card issuers.
Thank you for reading! Have some feedback for us?
Contact the 24/7 Wall St. editorial team.
