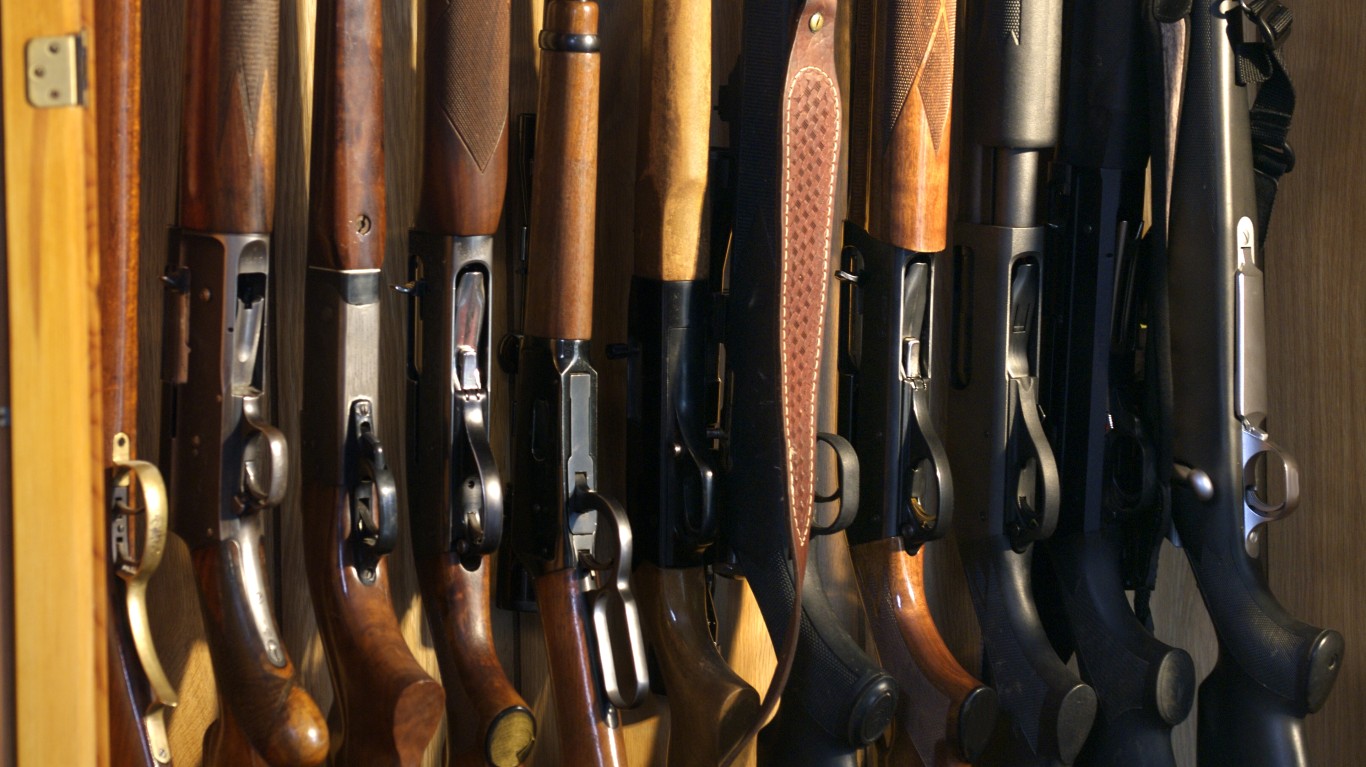
Gun sales have hit record highs in the United States in recent years. According to the Bureau of Alcohol, Tobacco, Firearms, and Explosives, 36.6 million firearms were manufactured and sold in the U.S. between 2020 and 2022, a 60% increase over the preceding three-year period. And as consumer demand for firearms has spiked, so too have instances of criminal gun violence. (These are the states where anyone can get a gun today.)
Every year, American law enforcement agencies seize thousands of firearms suspected to have been used in a crime. As part of the investigation, the ATF often traces these firearms back to their original point of sale. In 2022 alone, the ATF traced nearly 505,000 firearms — a 10.6% increase from the previous year, and more than double the number of tracings reported as recently as 2014.
While not all guns traced by the ATF have been used in a crime — and not all firearms used for illicit purposes are traced — federal tracing data offers valuable insight into trends and geographic patterns related to gun violence in the United States. In the last year, for example, some U.S. cities have reported a surge in suspected criminal firearm investigations.
Using ATF firearm tracing data as a proxy for criminal offenses, 24/7 Wall St. identified the U.S. cities where gun crime is surging. We considered the 10 cities in each state with the most firearm tracings in 2022 — 500 U.S. cities in total — and ranked them on the one-year change in ATF gun tracings. Cities in which fewer than 20 firearms were traced in 2021 were excluded from analysis.
Each of the 35 cities on this list reported a more than 50% increase in federal firearm investigations between 2021 and 2022. In many of these cities, criminal firearm investigations more than doubled year over year. (Here is a look at the states where gun deaths are increasing the fastest.)
While most cities on this list also reported a net influx of new residents between 2021 and 2022, population growth alone does not explain the spike in criminal gun violence. Adjusted for population using five-year estimates from the U.S. Census Bureau’s 2021 and 2022 American Community Surveys, the rate of ATF firearm tracings also increased meaningfully in every city on this list.
Here are the cities where gun related crime is surging.
35. Tacoma, WA
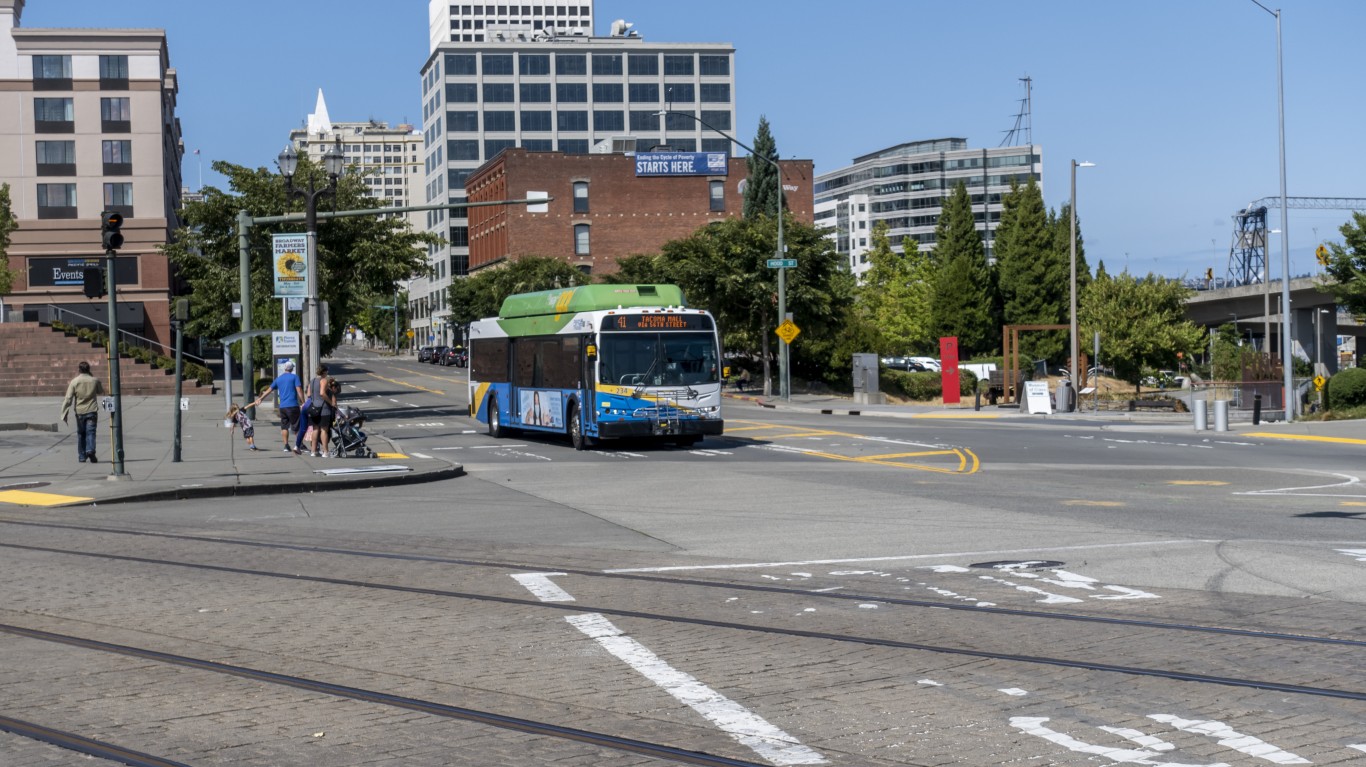
- 1-yr. change in ATF firearm tracings, 2021-2022: +51.8% (+207)
- ATF firearm tracings by year: 607 in 2022; 400 in 2021
- 1-yr. change in population, 2021-2022: +0.9% (+1,902)
- Population adjusted ATF firearm tracings in 2022: 276.9 per 100,000 people
- Population adjusted ATF firearm tracings in 2021: 184.1 per 100,000 people
34. North Platte, NE
- 1-yr. change in ATF firearm tracings, 2021-2022: +52.3% (+23)
- ATF firearm tracings by year: 67 in 2022; 44 in 2021
- 1-yr. change in population, 2021-2022: -1.0% (-234)
- Population adjusted ATF firearm tracings in 2022: 287.4 per 100,000 people
- Population adjusted ATF firearm tracings in 2021: 186.9 per 100,000 people
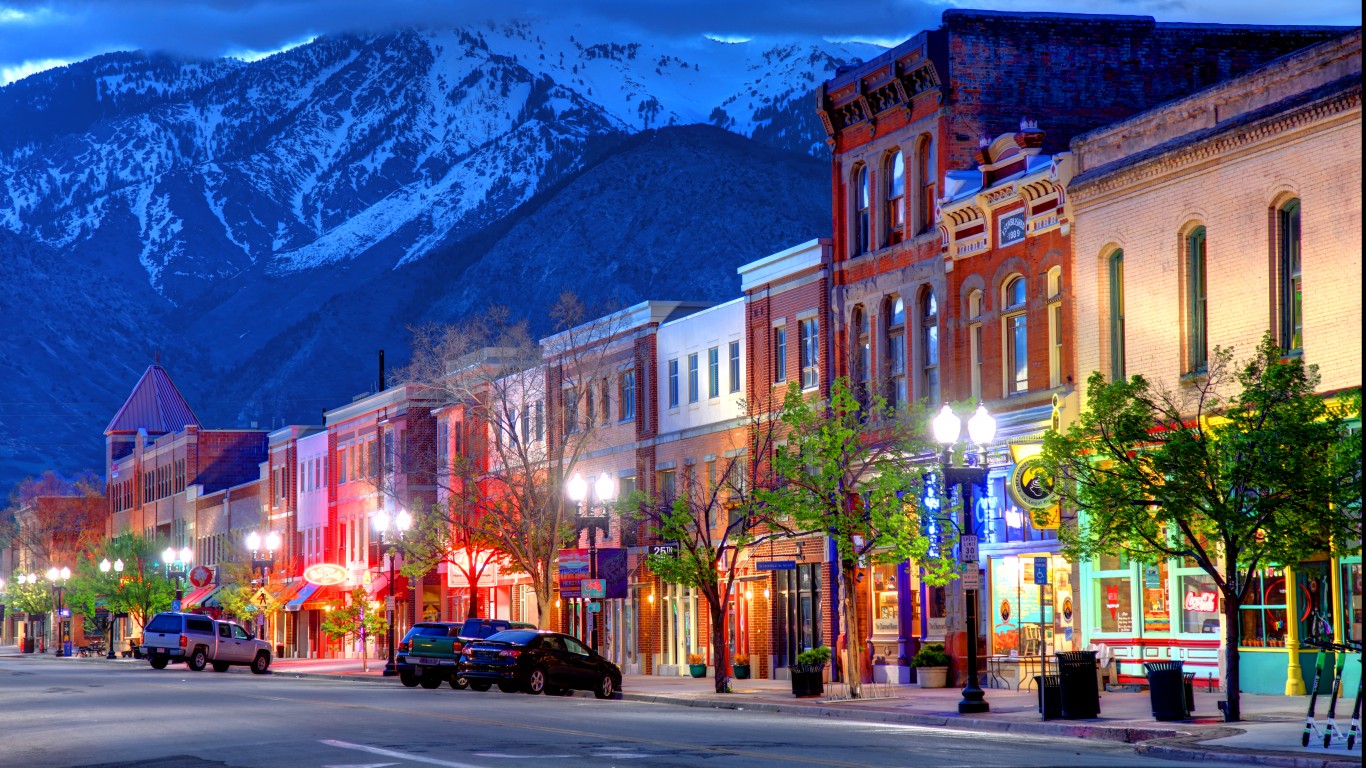
33. Saint George, UT
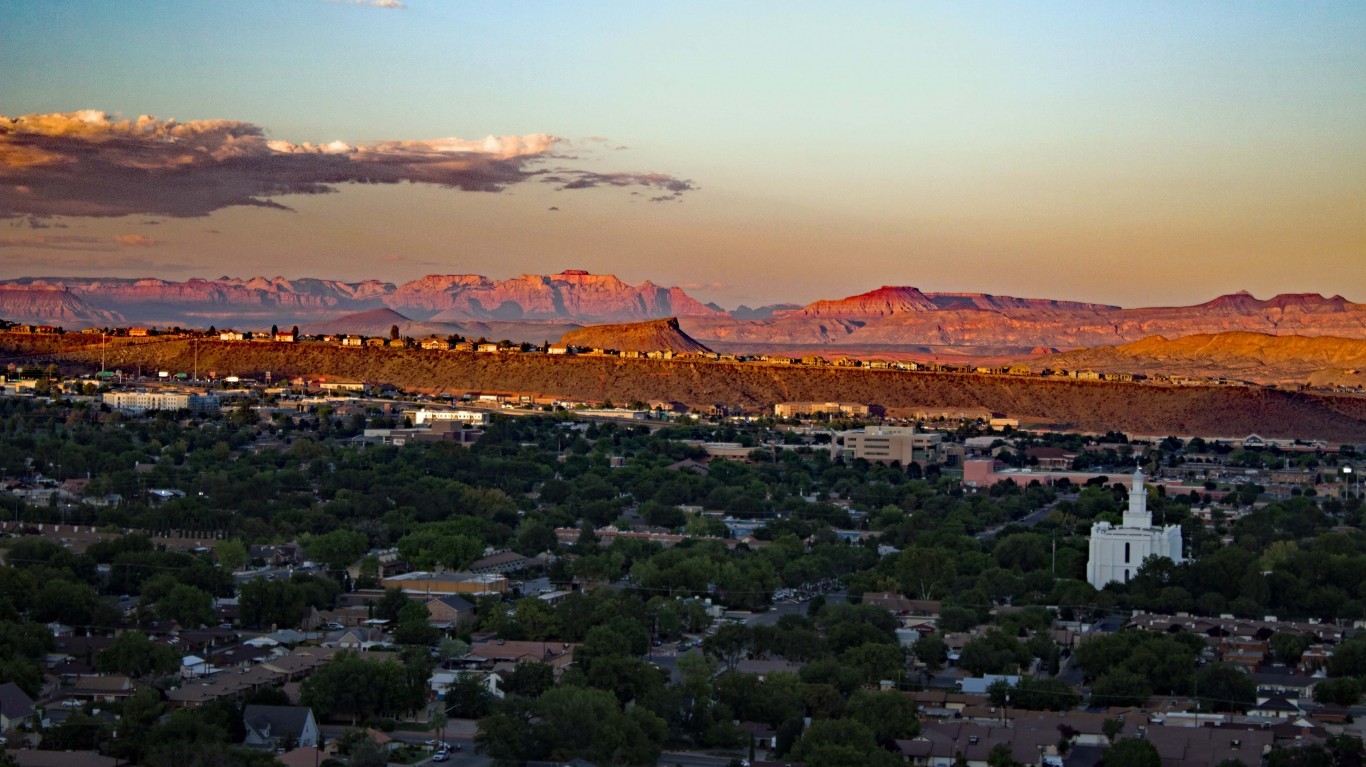
- 1-yr. change in ATF firearm tracings, 2021-2022: +52.9% (+63)
- ATF firearm tracings by year: 182 in 2022; 119 in 2021
- 1-yr. change in population, 2021-2022: +3.6% (+3,299)
- Population adjusted ATF firearm tracings in 2022: 189.2 per 100,000 people
- Population adjusted ATF firearm tracings in 2021: 128.1 per 100,000 people
32. Corpus Christi, TX
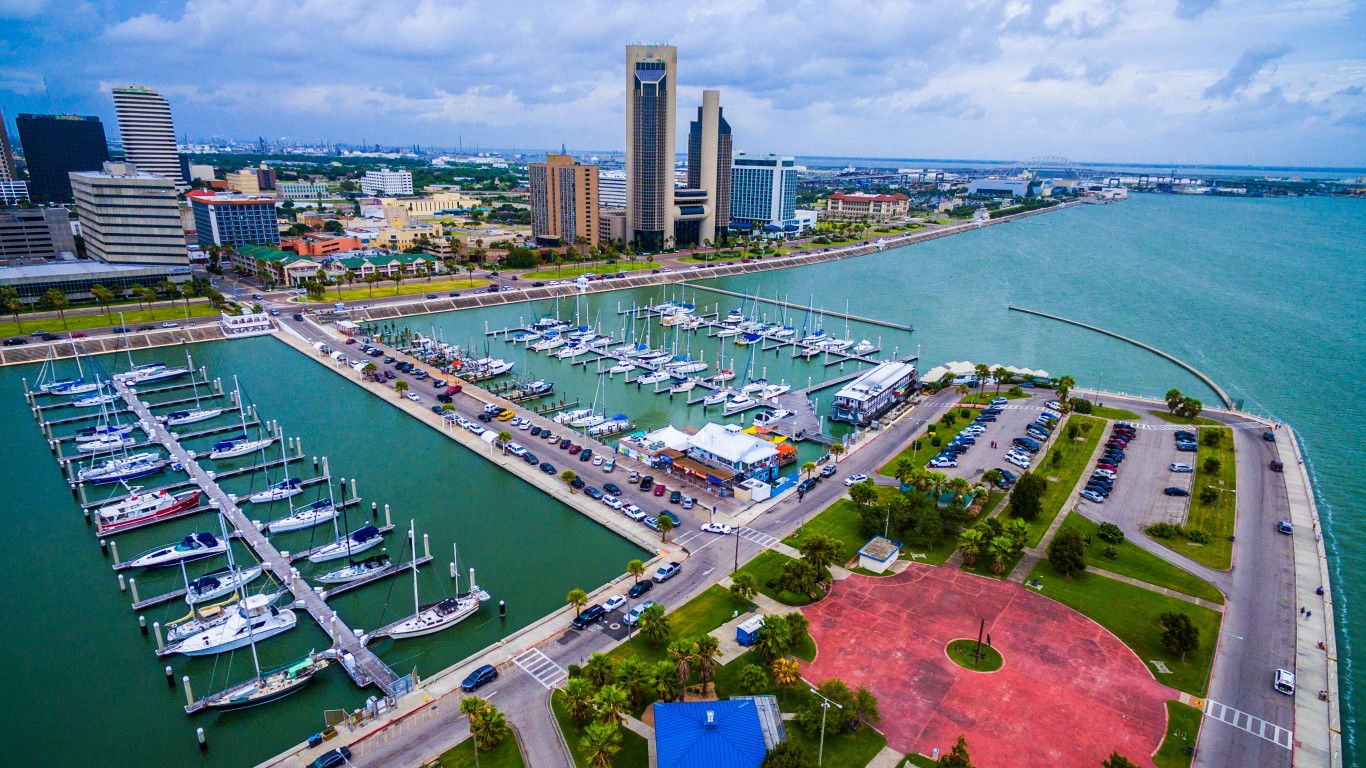
- 1-yr. change in ATF firearm tracings, 2021-2022: +54.2% (+416)
- ATF firearm tracings by year: 1,184 in 2022; 768 in 2021
- 1-yr. change in population, 2021-2022: -0.1% (-364)
- Population adjusted ATF firearm tracings in 2022: 372.6 per 100,000 people
- Population adjusted ATF firearm tracings in 2021: 241.4 per 100,000 people
31. Holyoke, MA

- 1-yr. change in ATF firearm tracings, 2021-2022: +54.4% (+37)
- ATF firearm tracings by year: 105 in 2022; 68 in 2021
- 1-yr. change in population, 2021-2022: -0.7% (-270)
- Population adjusted ATF firearm tracings in 2022: 274.8 per 100,000 people
- Population adjusted ATF firearm tracings in 2021: 176.7 per 100,000 people
30. Maple Grove, MN
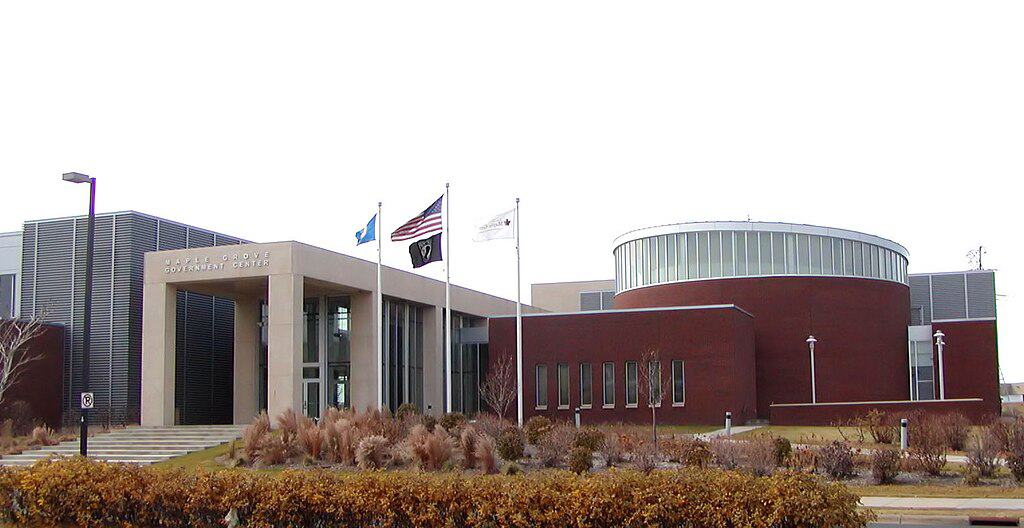
- 1-yr. change in ATF firearm tracings, 2021-2022: +56.9% (+29)
- ATF firearm tracings by year: 80 in 2022; 51 in 2021
- 1-yr. change in population, 2021-2022: +0.3% (+210)
- Population adjusted ATF firearm tracings in 2022: 114.1 per 100,000 people
- Population adjusted ATF firearm tracings in 2021: 73.0 per 100,000 people
29. Peoria, AZ
- 1-yr. change in ATF firearm tracings, 2021-2022: +58.6% (+112)
- ATF firearm tracings by year: 303 in 2022; 191 in 2021
- 1-yr. change in population, 2021-2022: +1.9% (+3,559)
- Population adjusted ATF firearm tracings in 2022: 158.4 per 100,000 people
- Population adjusted ATF firearm tracings in 2021: 101.7 per 100,000 people
28. Racine, WI

- 1-yr. change in ATF firearm tracings, 2021-2022: +59.0% (+147)
- ATF firearm tracings by year: 396 in 2022; 249 in 2021
- 1-yr. change in population, 2021-2022: -0.3% (-252)
- Population adjusted ATF firearm tracings in 2022: 511.3 per 100,000 people
- Population adjusted ATF firearm tracings in 2021: 320.4 per 100,000 people
27. West Allis, WI

- 1-yr. change in ATF firearm tracings, 2021-2022: +61.7% (+116)
- ATF firearm tracings by year: 304 in 2022; 188 in 2021
- 1-yr. change in population, 2021-2022: -0.5% (-313)
- Population adjusted ATF firearm tracings in 2022: 507.5 per 100,000 people
- Population adjusted ATF firearm tracings in 2021: 312.2 per 100,000 people
26. Syracuse, NY

- 1-yr. change in ATF firearm tracings, 2021-2022: +65.9% (+135)
- ATF firearm tracings by year: 340 in 2022; 205 in 2021
- 1-yr. change in population, 2021-2022: -0.4% (-647)
- Population adjusted ATF firearm tracings in 2022: 232.7 per 100,000 people
- Population adjusted ATF firearm tracings in 2021: 139.7 per 100,000 people
25. York, PA

- 1-yr. change in ATF firearm tracings, 2021-2022: +68.3% (+86)
- ATF firearm tracings by year: 212 in 2022; 126 in 2021
- 1-yr. change in population, 2021-2022: +0.2% (+90)
- Population adjusted ATF firearm tracings in 2022: 473.4 per 100,000 people
- Population adjusted ATF firearm tracings in 2021: 281.9 per 100,000 people
24. Newport News, VA

- 1-yr. change in ATF firearm tracings, 2021-2022: +69.3% (+537)
- ATF firearm tracings by year: 1,312 in 2022; 775 in 2021
- 1-yr. change in population, 2021-2022: +0.03% (+49)
- Population adjusted ATF firearm tracings in 2022: 708.7 per 100,000 people
- Population adjusted ATF firearm tracings in 2021: 418.8 per 100,000 people
23. East Saint Louis, IL

- 1-yr. change in ATF firearm tracings, 2021-2022: +70.2% (+134)
- ATF firearm tracings by year: 325 in 2022; 191 in 2021
- 1-yr. change in population, 2021-2022: -3.3% (-641)
- Population adjusted ATF firearm tracings in 2022: 1729.1 per 100,000 people
- Population adjusted ATF firearm tracings in 2021: 982.7 per 100,000 people
22. Clarksburg, WV
- 1-yr. change in ATF firearm tracings, 2021-2022: +73.7% (+42)
- ATF firearm tracings by year: 99 in 2022; 57 in 2021
- 1-yr. change in population, 2021-2022: -0.7% (-108)
- Population adjusted ATF firearm tracings in 2022: 619.6 per 100,000 people
- Population adjusted ATF firearm tracings in 2021: 354.4 per 100,000 people
21. Elizabethtown, KY

- 1-yr. change in ATF firearm tracings, 2021-2022: +74.7% (+62)
- ATF firearm tracings by year: 145 in 2022; 83 in 2021
- 1-yr. change in population, 2021-2022: +1.2% (+359)
- Population adjusted ATF firearm tracings in 2022: 461.4 per 100,000 people
- Population adjusted ATF firearm tracings in 2021: 267.2 per 100,000 people
20. Myrtle Beach, SC
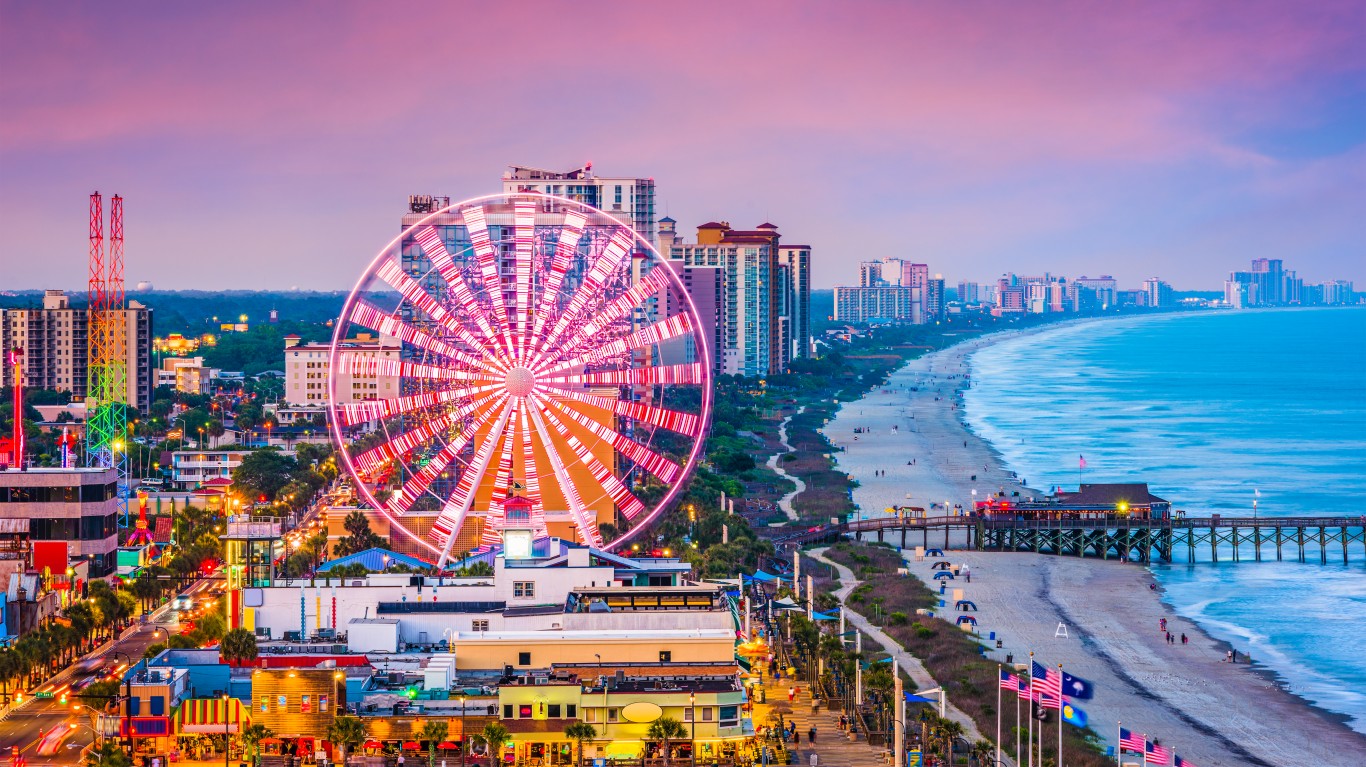
- 1-yr. change in ATF firearm tracings, 2021-2022: +76.9% (+247)
- ATF firearm tracings by year: 568 in 2022; 321 in 2021
- 1-yr. change in population, 2021-2022: +2.7% (+948)
- Population adjusted ATF firearm tracings in 2022: 1575.0 per 100,000 people
- Population adjusted ATF firearm tracings in 2021: 914.1 per 100,000 people
19. Chester, PA

- 1-yr. change in ATF firearm tracings, 2021-2022: +87.7% (+100)
- ATF firearm tracings by year: 214 in 2022; 114 in 2021
- 1-yr. change in population, 2021-2022: +0.7% (+229)
- Population adjusted ATF firearm tracings in 2022: 647.5 per 100,000 people
- Population adjusted ATF firearm tracings in 2021: 347.4 per 100,000 people
18. Murfreesboro, TN
- 1-yr. change in ATF firearm tracings, 2021-2022: +95.9% (+162)
- ATF firearm tracings by year: 331 in 2022; 169 in 2021
- 1-yr. change in population, 2021-2022: +3.0% (+4,517)
- Population adjusted ATF firearm tracings in 2022: 215.7 per 100,000 people
- Population adjusted ATF firearm tracings in 2021: 113.4 per 100,000 people
17. Fresno, CA
- 1-yr. change in ATF firearm tracings, 2021-2022: +98.0% (+944)
- ATF firearm tracings by year: 1,907 in 2022; 963 in 2021
- 1-yr. change in population, 2021-2022: +0.5% (+2,850)
- Population adjusted ATF firearm tracings in 2022: 352.2 per 100,000 people
- Population adjusted ATF firearm tracings in 2021: 178.8 per 100,000 people
16. Norman, OK

- 1-yr. change in ATF firearm tracings, 2021-2022: +100.0% (+28)
- ATF firearm tracings by year: 56 in 2022; 28 in 2021
- 1-yr. change in population, 2021-2022: +1.6% (+1,956)
- Population adjusted ATF firearm tracings in 2022: 43.9 per 100,000 people
- Population adjusted ATF firearm tracings in 2021: 22.3 per 100,000 people
15. Las Cruces, NM
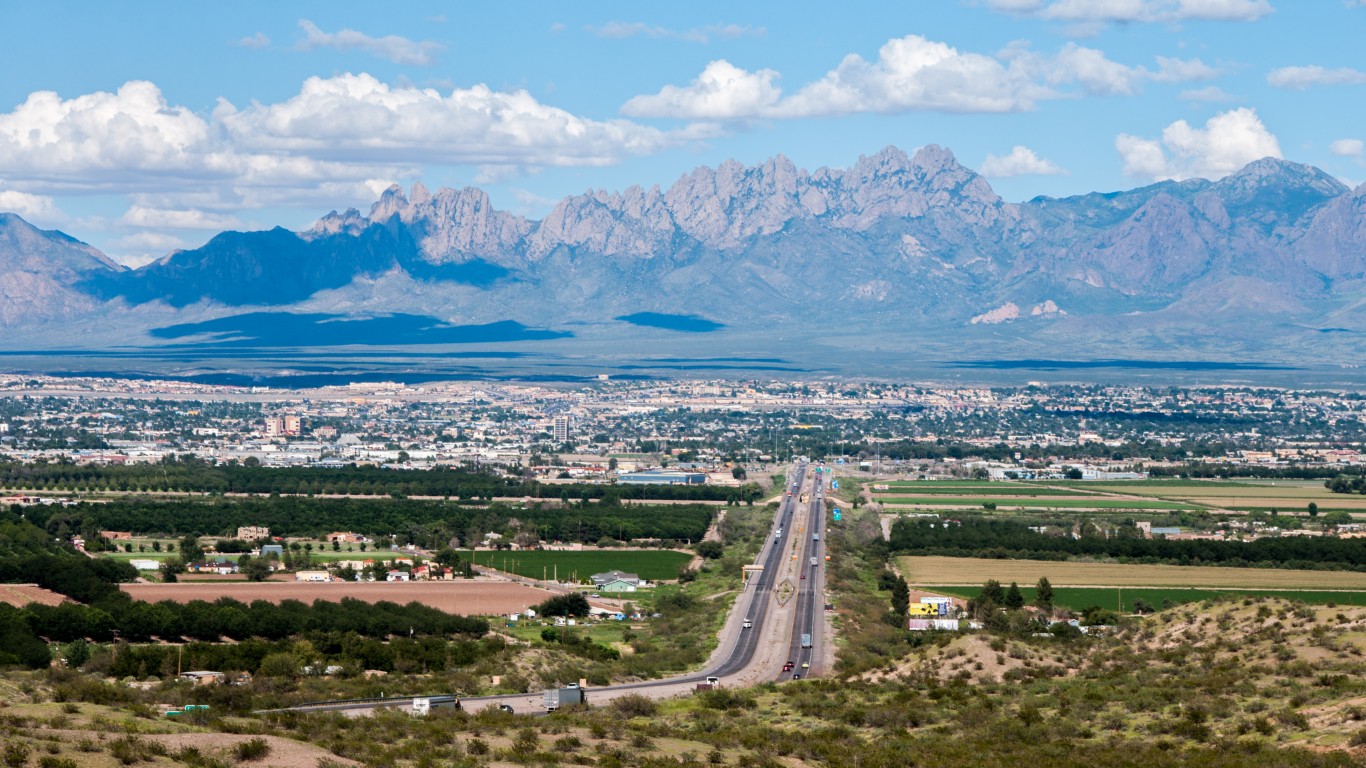
- 1-yr. change in ATF firearm tracings, 2021-2022: +104.5% (+139)
- ATF firearm tracings by year: 272 in 2022; 133 in 2021
- 1-yr. change in population, 2021-2022: +1.2% (+1,339)
- Population adjusted ATF firearm tracings in 2022: 244.4 per 100,000 people
- Population adjusted ATF firearm tracings in 2021: 121.0 per 100,000 people
14. Ogden, UT
- 1-yr. change in ATF firearm tracings, 2021-2022: +107.8% (+110)
- ATF firearm tracings by year: 212 in 2022; 102 in 2021
- 1-yr. change in population, 2021-2022: +0.7% (+644)
- Population adjusted ATF firearm tracings in 2022: 244.4 per 100,000 people
- Population adjusted ATF firearm tracings in 2021: 118.5 per 100,000 people
13. Aurora, CO
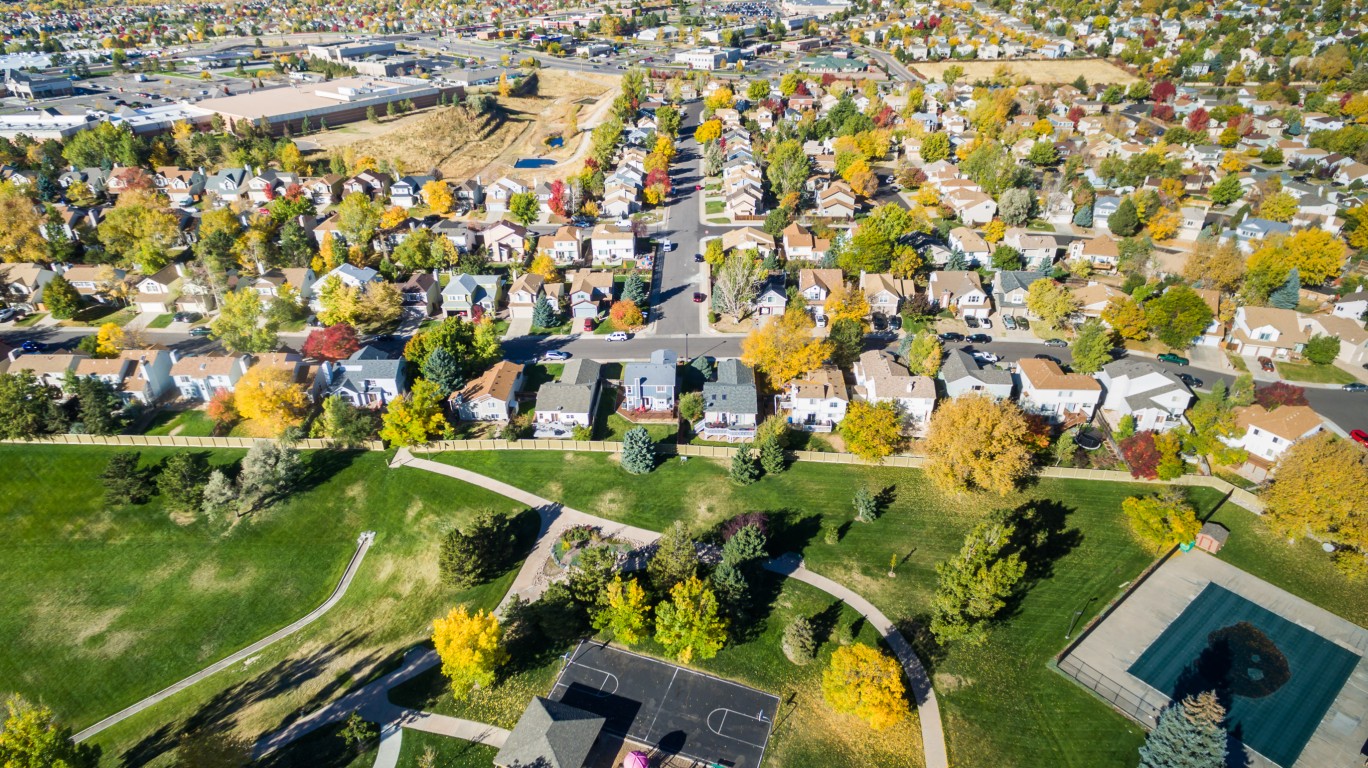
- 1-yr. change in ATF firearm tracings, 2021-2022: +113.8% (+272)
- ATF firearm tracings by year: 511 in 2022; 239 in 2021
- 1-yr. change in population, 2021-2022: +1.0% (+3,853)
- Population adjusted ATF firearm tracings in 2022: 131.9 per 100,000 people
- Population adjusted ATF firearm tracings in 2021: 62.3 per 100,000 people
12. Duluth, MN
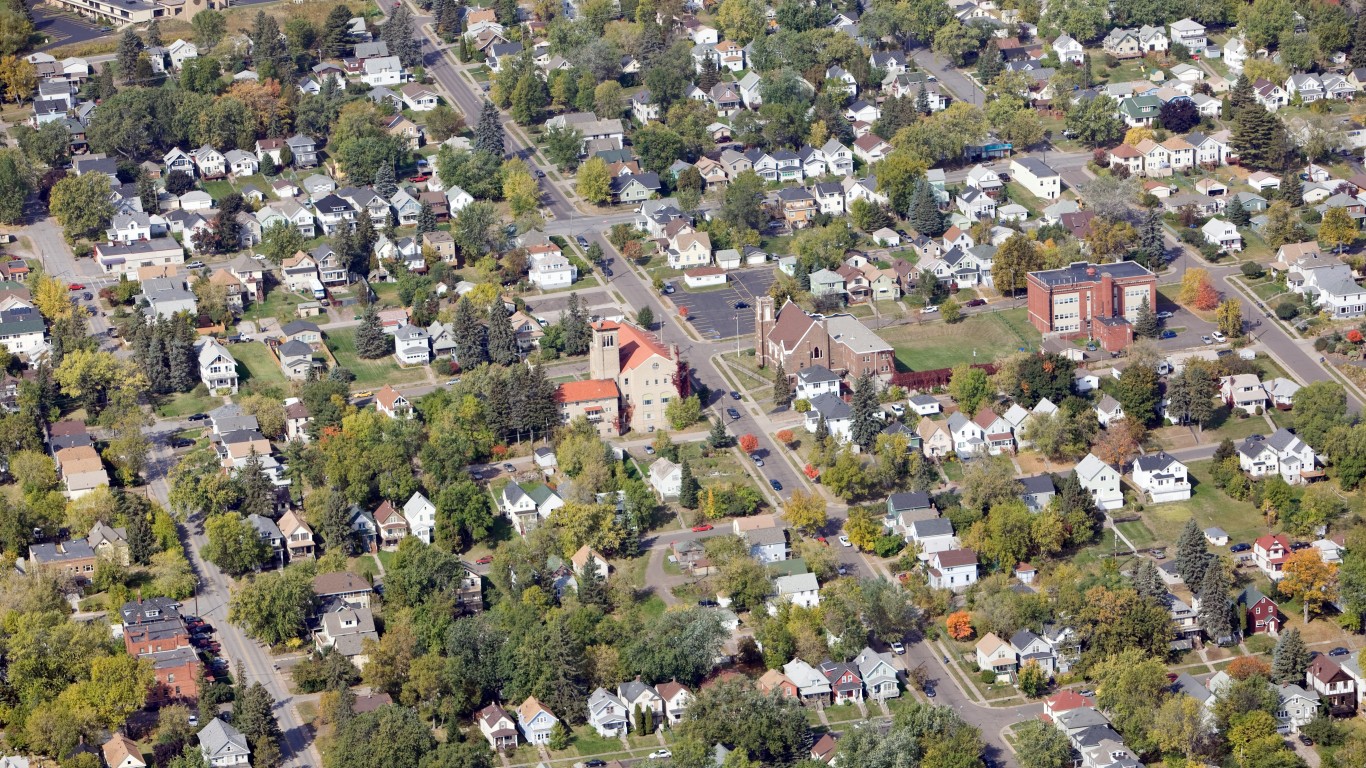
- 1-yr. change in ATF firearm tracings, 2021-2022: +114.3% (+80)
- ATF firearm tracings by year: 150 in 2022; 70 in 2021
- 1-yr. change in population, 2021-2022: +0.1% (+61)
- Population adjusted ATF firearm tracings in 2022: 172.9 per 100,000 people
- Population adjusted ATF firearm tracings in 2021: 80.7 per 100,000 people
11. Wasilla, AK

- 1-yr. change in ATF firearm tracings, 2021-2022: +129.4% (+44)
- ATF firearm tracings by year: 78 in 2022; 34 in 2021
- 1-yr. change in population, 2021-2022: +1.9% (+169)
- Population adjusted ATF firearm tracings in 2022: 841.7 per 100,000 people
- Population adjusted ATF firearm tracings in 2021: 373.7 per 100,000 people
10. Anchorage, AK
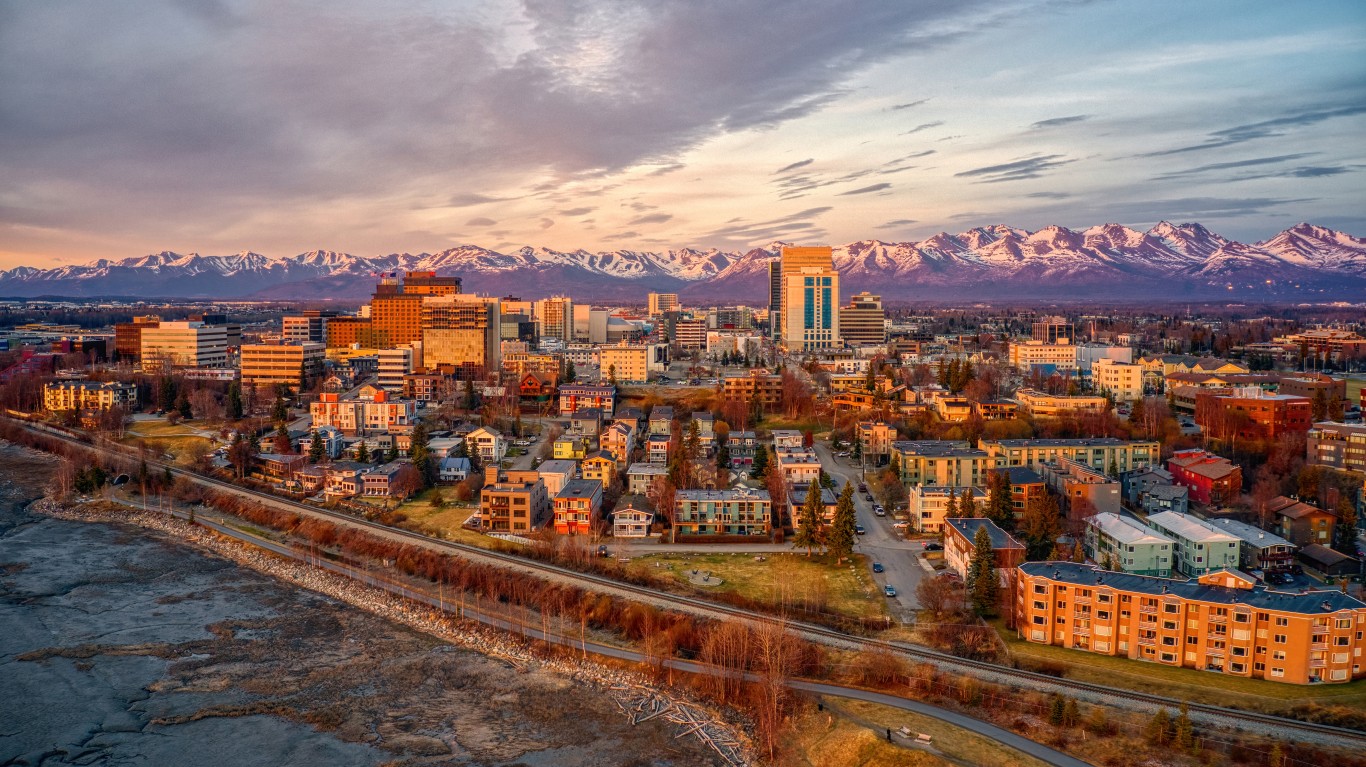
- 1-yr. change in ATF firearm tracings, 2021-2022: +129.5% (+500)
- ATF firearm tracings by year: 886 in 2022; 386 in 2021
- 1-yr. change in population, 2021-2022: -0.6% (-1,871)
- Population adjusted ATF firearm tracings in 2022: 304.8 per 100,000 people
- Population adjusted ATF firearm tracings in 2021: 131.9 per 100,000 people
9. Honolulu, HI

- 1-yr. change in ATF firearm tracings, 2021-2022: +136.7% (+41)
- ATF firearm tracings by year: 71 in 2022; 30 in 2021
- 1-yr. change in population, 2021-2022: -0.9% (-3,007)
- Population adjusted ATF firearm tracings in 2022: 20.4 per 100,000 people
- Population adjusted ATF firearm tracings in 2021: 8.5 per 100,000 people
8. Lihue, HI

- 1-yr. change in ATF firearm tracings, 2021-2022: +150.0% (+33)
- ATF firearm tracings by year: 55 in 2022; 22 in 2021
- 1-yr. change in population, 2021-2022: +3.3% (+278)
- Population adjusted ATF firearm tracings in 2022: 635.9 per 100,000 people
- Population adjusted ATF firearm tracings in 2021: 262.8 per 100,000 people
7. Austin, TX

- 1-yr. change in ATF firearm tracings, 2021-2022: +156.7% (+1,042)
- ATF firearm tracings by year: 1,707 in 2022; 665 in 2021
- 1-yr. change in population, 2021-2022: +1.4% (+13,544)
- Population adjusted ATF firearm tracings in 2022: 178.1 per 100,000 people
- Population adjusted ATF firearm tracings in 2021: 70.4 per 100,000 people
6. Sioux City, IA
- 1-yr. change in ATF firearm tracings, 2021-2022: +159.2% (+121)
- ATF firearm tracings by year: 197 in 2022; 76 in 2021
- 1-yr. change in population, 2021-2022: +0.5% (+388)
- Population adjusted ATF firearm tracings in 2022: 230.5 per 100,000 people
- Population adjusted ATF firearm tracings in 2021: 89.3 per 100,000 people
5. Great Falls, MT

- 1-yr. change in ATF firearm tracings, 2021-2022: +164.7% (+140)
- ATF firearm tracings by year: 225 in 2022; 85 in 2021
- 1-yr. change in population, 2021-2022: -0.01% (-8)
- Population adjusted ATF firearm tracings in 2022: 372.7 per 100,000 people
- Population adjusted ATF firearm tracings in 2021: 140.8 per 100,000 people
4. New Britain, CT

- 1-yr. change in ATF firearm tracings, 2021-2022: +165.2% (+114)
- ATF firearm tracings by year: 183 in 2022; 69 in 2021
- 1-yr. change in population, 2021-2022: +0.3% (+190)
- Population adjusted ATF firearm tracings in 2022: 246.6 per 100,000 people
- Population adjusted ATF firearm tracings in 2021: 93.2 per 100,000 people
3. Farmington, NM

- 1-yr. change in ATF firearm tracings, 2021-2022: +176.9% (+92)
- ATF firearm tracings by year: 144 in 2022; 52 in 2021
- 1-yr. change in population, 2021-2022: -0.5% (-239)
- Population adjusted ATF firearm tracings in 2022: 310.0 per 100,000 people
- Population adjusted ATF firearm tracings in 2021: 111.4 per 100,000 people
2. Fort Worth, TX
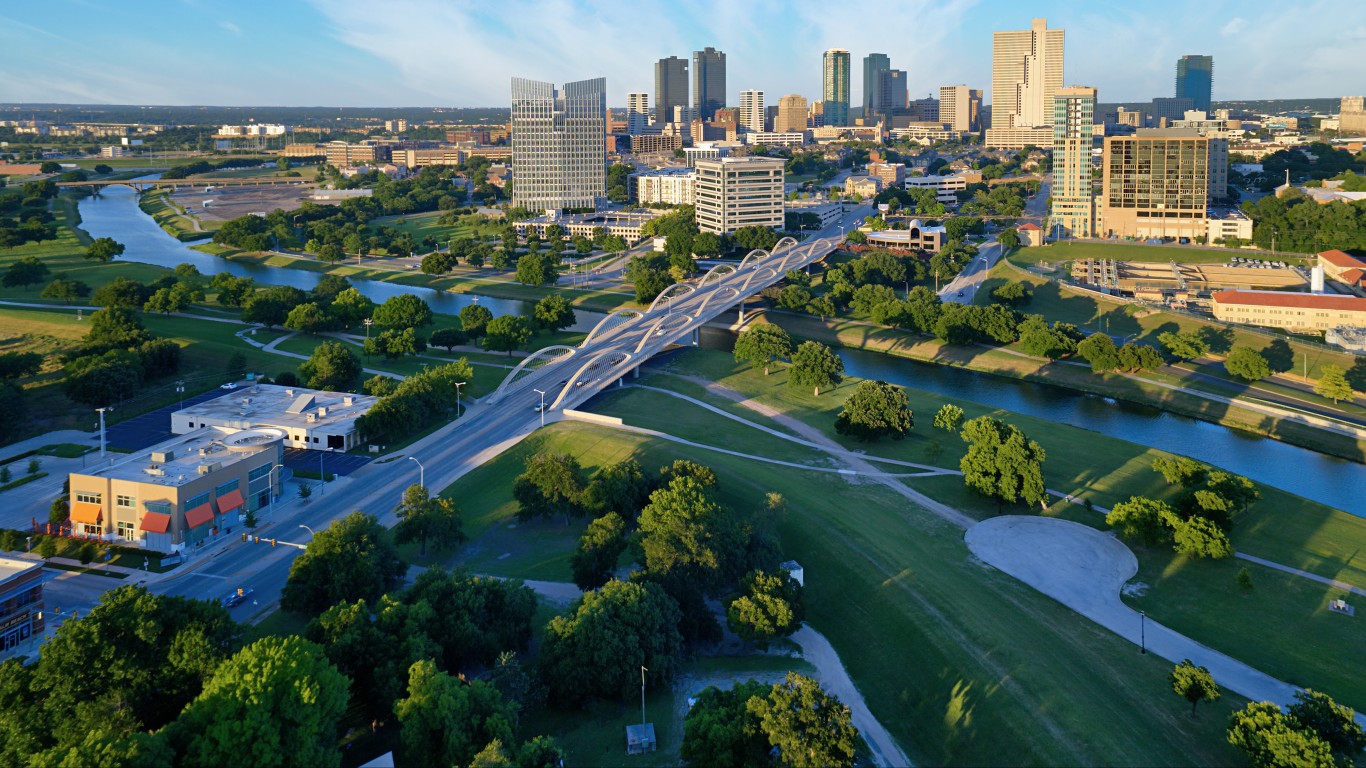
- 1-yr. change in ATF firearm tracings, 2021-2022: +274.3% (+1,975)
- ATF firearm tracings by year: 2,695 in 2022; 720 in 2021
- 1-yr. change in population, 2021-2022: +1.8% (+16,194)
- Population adjusted ATF firearm tracings in 2022: 291.5 per 100,000 people
- Population adjusted ATF firearm tracings in 2021: 79.3 per 100,000 people
1. Montgomery, AL

- 1-yr. change in ATF firearm tracings, 2021-2022: +317.0% (+596)
- ATF firearm tracings by year: 784 in 2022; 188 in 2021
- 1-yr. change in population, 2021-2022: -0.6% (-1,203)
- Population adjusted ATF firearm tracings in 2022: 392.4 per 100,000 people
- Population adjusted ATF firearm tracings in 2021: 93.5 per 100,000 people
It’s Your Money, Your Future—Own It (sponsor)
Are you ahead, or behind on retirement? For families with more than $500,000 saved for retirement, finding a financial advisor who puts your interest first can be the difference, and today it’s easier than ever. SmartAsset’s free tool matches you with up to three fiduciary financial advisors who serve your area in minutes. Each advisor has been carefully vetted and must act in your best interests. Start your search now.
If you’ve saved and built a substantial nest egg for you and your family, don’t delay; get started right here and help your retirement dreams become a retirement reality.
Thank you for reading! Have some feedback for us?
Contact the 24/7 Wall St. editorial team.

Our expert who first called NVIDIA in 2009 is predicting 2025 will see a historic AI breakthrough.
You can follow him investing $500,000 of his own money on our top AI stocks for free.