Special Report
Where Gun Sales Fell The Fastest Last Month, All 50 States Ranked
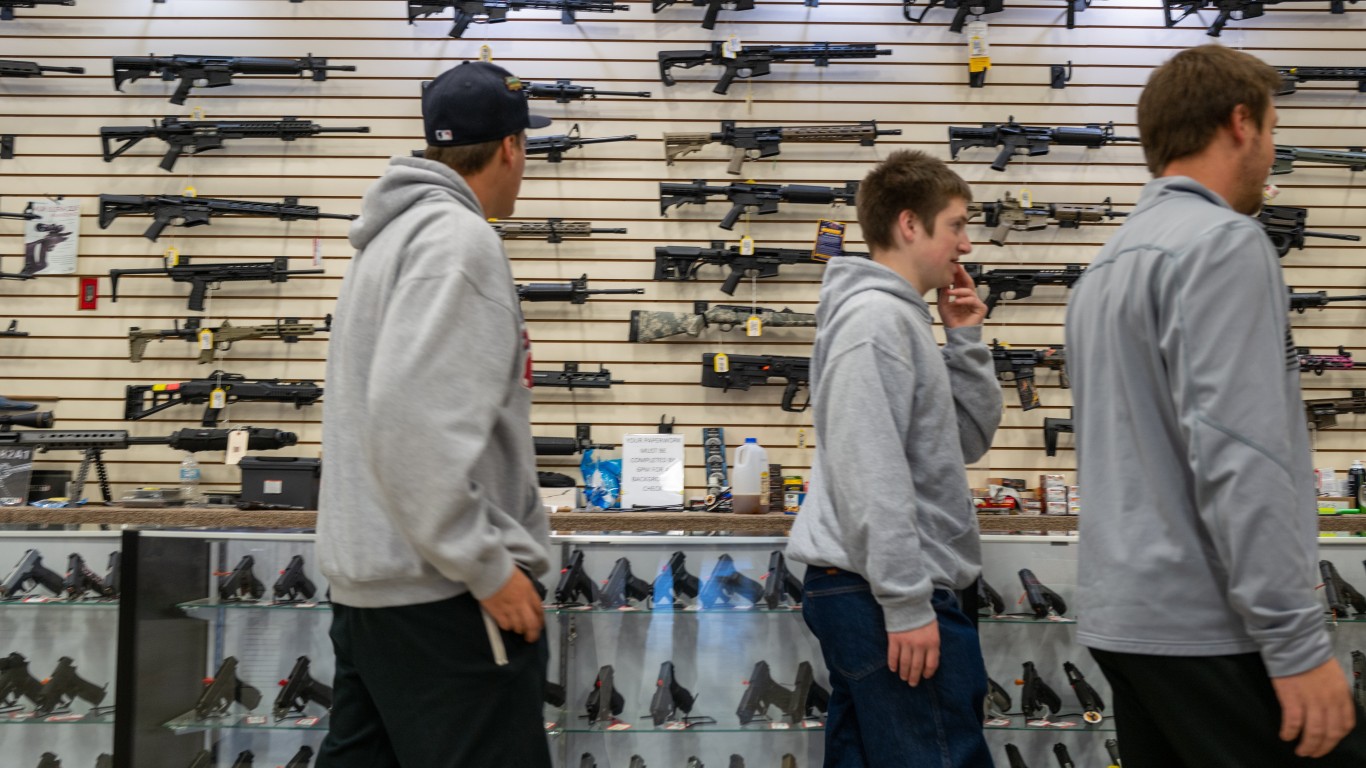
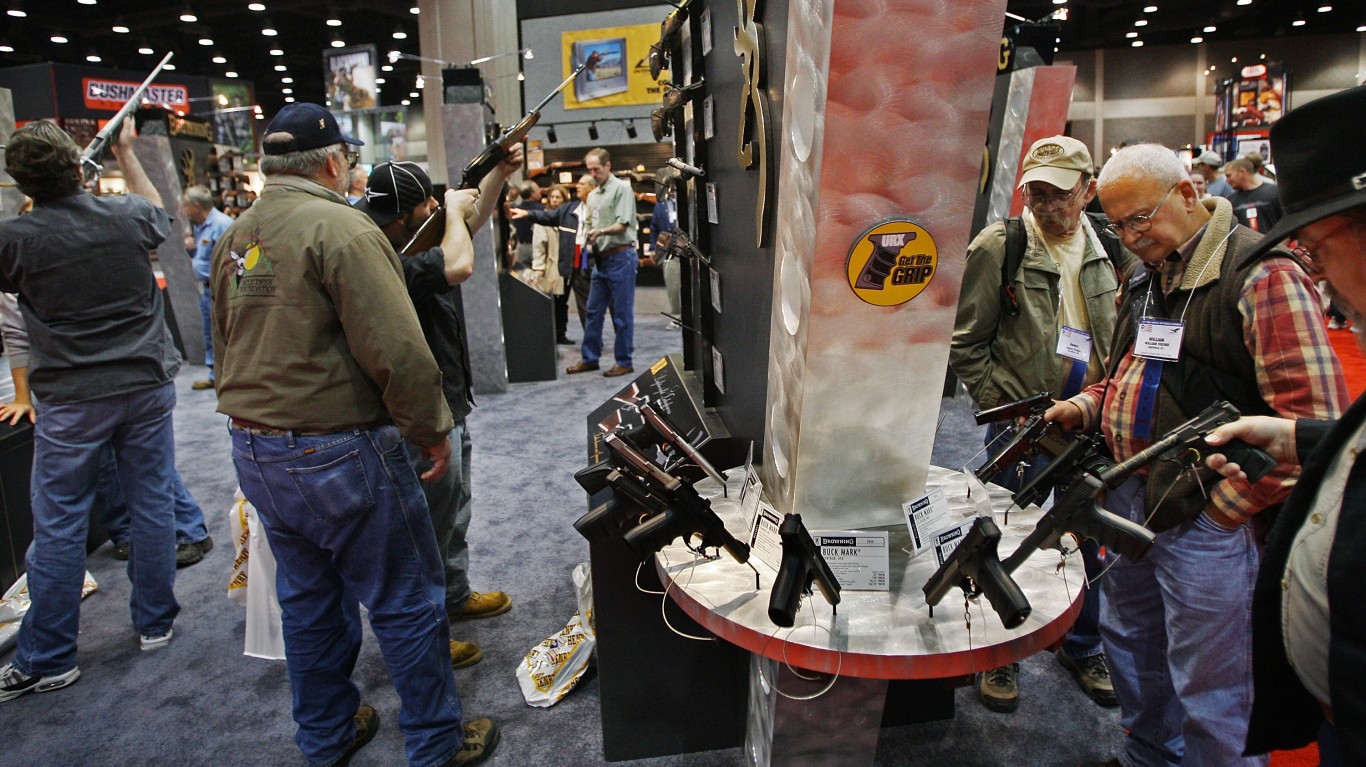
Spencer Platt / Getty Images News via Getty Images
Published: December 29, 2023 10:36 am
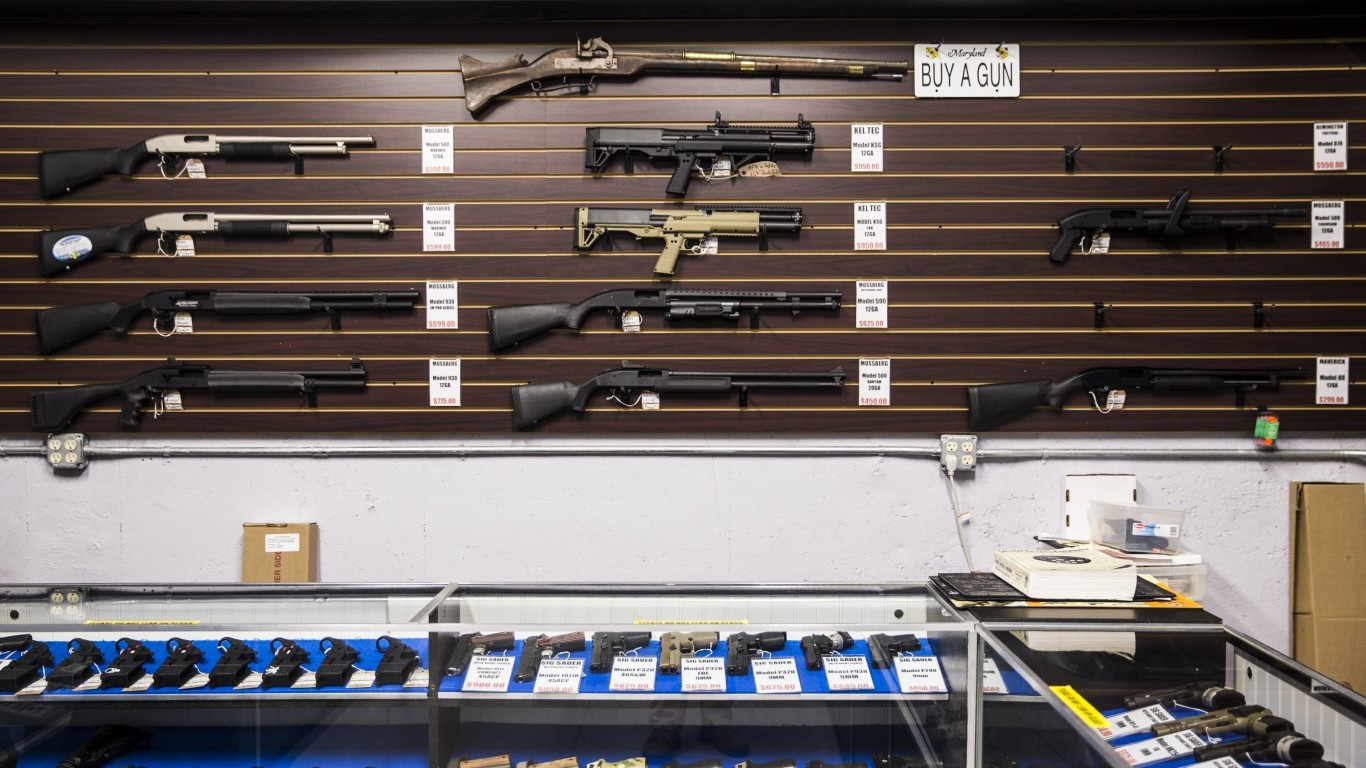
This season’s Black Friday, Nov. 24, 2023, broke the record for gun sales — at least as estimated by firearm background checks. The FBI processed 214,913 background checks initiated that day, the third highest day on record and the most on a Black Friday. The FBI cautions that firearm checks are not a one-to-one correlation to gun sales, but they do serve as a rough proxy.
To get an even better approximation of gun sales, 24/7 Wall St. adjusts the FBI figures by excluding checks for such categories as pawn shop transactions, returns, rentals, and rechecks. Using adjusted figures, firearm background checks were about flat nationwide in November, declining by just 0.2% compared to November 2022. This might suggest that gun sales are leveling after dropping significantly from the pandemic years highs. Adjusted firearm background checks increased in 34 states in November and fell in 16.
To identify the states where gun sales fell the fastest last month, 24/7 Wall St. used data from the FBI’s National Instant Criminal Background Check System . We ranked the states based on the percent change in adjusted background checks from November 2022 to November 2023, from the largest increase to the largest drop. Despite using adjusted figures, background checks remain a rough estimate of gun sales as states have different laws regarding when background checks are required and different accounting practices. (These are states with high-capacity magazine bans .)
In five of the 16 states where background checks fell in November, checks dropped by over 10%. The five — Illinois, Maryland, Oregon, Tennessee, and Wisconsin — are all in the top 25 for total background checks that month. Per capita checks in these five states, however, range from among the lowest to among the highest. These states also have vastly different gun laws. While Tennessee gets an F grade for its gun laws from Gifford Law Center’s most recent Annual Gun Law Scorecard , Maryland, Oregon, and Illinois get an A-.
At the other end of the list, the five states where firearm background checks increased the most in November are California, Hawaii, Maine, New Hampshire, and North Carolina. These state’s gun law grades range from D- to A. And while Maine has the 13th most gun stores per capita, California has the third fewest. Here are states with the most gun stores .
Here is where gun sales fell the fastest last month, all 50 states ranked.
50. Hawaii
Change in background checks, Nov. 2022 to Nov. 2023: +73.1%Firearm background checks, Nov. 2023: 2,455 (2nd lowest)Firearm background checks, Nov. 2022: 1,418 (the lowest)Firearm background checks per 1,000 residents, Nov. 2023: 1.7 per 1,000 (2nd lowest)Firearm background checks per 1,000 residents, Nov. 2022: 1.0 (the lowest)Population: 1,440,196 (11th lowest)
49. New Hampshire
DOMINICK REUTER / AFP via Getty Images
Change in background checks, Nov. 2022 to Nov. 2023: +44.9%Firearm background checks, Nov. 2023: 16,201 (16th lowest)Firearm background checks, Nov. 2022: 11,178 (12th lowest)Firearm background checks per 1,000 residents, Nov. 2023: 11.6 per 1,000 (the highest)Firearm background checks per 1,000 residents, Nov. 2022: 8.0 (14th highest)Population: 1,395,231 (10th lowest)
48. Maine
VistaVision / iStock Editorial via Getty Images
Change in background checks, Nov. 2022 to Nov. 2023: +28.9%Firearm background checks, Nov. 2023: 12,421 (12th lowest)Firearm background checks, Nov. 2022: 9,633 (10th lowest)Firearm background checks per 1,000 residents, Nov. 2023: 9.0 per 1,000 (8th highest)Firearm background checks per 1,000 residents, Nov. 2022: 7.0 (20th highest)Population: 1,385,340 (9th lowest)
47. North Carolina
J. Michael Jones / iStock Editorial via Getty Images
Change in background checks, Nov. 2022 to Nov. 2023: +26.1%Firearm background checks, Nov. 2023: 60,837 (8th highest)Firearm background checks, Nov. 2022: 48,228 (13th highest)Firearm background checks per 1,000 residents, Nov. 2023: 5.7 per 1,000 (17th lowest)Firearm background checks per 1,000 residents, Nov. 2022: 4.5 (13th lowest)Population: 10,698,973 (9th highest)
46. California
David McNew / Getty Images News via Getty Images
Change in background checks, Nov. 2022 to Nov. 2023: +23.3%Firearm background checks, Nov. 2023: 126,033 (3rd highest)Firearm background checks, Nov. 2022: 102,205 (4th highest)Firearm background checks per 1,000 residents, Nov. 2023: 3.2 per 1,000 (6th lowest)Firearm background checks per 1,000 residents, Nov. 2022: 2.6 (5th lowest)Population: 39,029,342 (the highest)
45. Massachusetts
Boston Globe / Boston Globe via Getty Images
Change in background checks, Nov. 2022 to Nov. 2023: +17.8%Firearm background checks, Nov. 2023: 23,805 (22nd lowest)Firearm background checks, Nov. 2022: 20,205 (21st lowest)Firearm background checks per 1,000 residents, Nov. 2023: 3.4 per 1,000 (7th lowest)Firearm background checks per 1,000 residents, Nov. 2022: 2.9 (6th lowest)Population: 6,981,974 (16th highest)
44. Montana
Cheri Alguire / iStock Editorial via Getty Images
Change in background checks, Nov. 2022 to Nov. 2023: +15.2%Firearm background checks, Nov. 2023: 12,387 (11th lowest)Firearm background checks, Nov. 2022: 10,756 (11th lowest)Firearm background checks per 1,000 residents, Nov. 2023: 11.0 per 1,000 (3rd highest)Firearm background checks per 1,000 residents, Nov. 2022: 9.6 (8th highest)Population: 1,122,867 (8th lowest)
43. North Dakota
Mike Kemp / In Pictures via Getty Images
Change in background checks, Nov. 2022 to Nov. 2023: +13.2%Firearm background checks, Nov. 2023: 6,516 (7th lowest)Firearm background checks, Nov. 2022: 5,754 (5th lowest)Firearm background checks per 1,000 residents, Nov. 2023: 8.4 per 1,000 (14th highest)Firearm background checks per 1,000 residents, Nov. 2022: 7.4 (17th highest)Population: 779,261 (4th lowest)
42. New Jersey
Spencer Platt / Getty Images News via Getty Images
Change in background checks, Nov. 2022 to Nov. 2023: +13.1%Firearm background checks, Nov. 2023: 15,060 (15th lowest)Firearm background checks, Nov. 2022: 13,316 (14th lowest)Firearm background checks per 1,000 residents, Nov. 2023: 1.6 per 1,000 (the lowest)Firearm background checks per 1,000 residents, Nov. 2022: 1.4 (2nd lowest)Population: 9,261,699 (11th highest)
41. Ohio
Change in background checks, Nov. 2022 to Nov. 2023: +12.4%Firearm background checks, Nov. 2023: 68,143 (6th highest)Firearm background checks, Nov. 2022: 60,607 (8th highest)Firearm background checks per 1,000 residents, Nov. 2023: 5.8 per 1,000 (20th lowest)Firearm background checks per 1,000 residents, Nov. 2022: 5.2 (16th lowest)Population: 11,756,058 (7th highest)
40. Florida
Change in background checks, Nov. 2022 to Nov. 2023: +11.4%Firearm background checks, Nov. 2023: 128,109 (2nd highest)Firearm background checks, Nov. 2022: 114,977 (2nd highest)Firearm background checks per 1,000 residents, Nov. 2023: 5.8 per 1,000 (19th lowest)Firearm background checks per 1,000 residents, Nov. 2022: 5.2 (17th lowest)Population: 22,244,823 (3rd highest)
39. Michigan
Roberto Galan / iStock Editorial via Getty Images
Change in background checks, Nov. 2022 to Nov. 2023: +9.6%Firearm background checks, Nov. 2023: 70,328 (5th highest)Firearm background checks, Nov. 2022: 64,166 (7th highest)Firearm background checks per 1,000 residents, Nov. 2023: 7.0 per 1,000 (21st highest)Firearm background checks per 1,000 residents, Nov. 2022: 6.4 (25th lowest)Population: 10,034,113 (10th highest)
38. Rhode Island
dlewis33 / E+ via Getty Images
Change in background checks, Nov. 2022 to Nov. 2023: +9.3%Firearm background checks, Nov. 2023: 2,430 (the lowest)Firearm background checks, Nov. 2022: 2,223 (2nd lowest)Firearm background checks per 1,000 residents, Nov. 2023: 2.2 per 1,000 (5th lowest)Firearm background checks per 1,000 residents, Nov. 2022: 2.0 (4th lowest)Population: 1,093,734 (7th lowest)
37. Wyoming
Melissa Kopka / iStock Editorial via Getty Images
Change in background checks, Nov. 2022 to Nov. 2023: +8.9%Firearm background checks, Nov. 2023: 6,457 (6th lowest)Firearm background checks, Nov. 2022: 5,927 (6th lowest)Firearm background checks per 1,000 residents, Nov. 2023: 11.1 per 1,000 (2nd highest)Firearm background checks per 1,000 residents, Nov. 2022: 10.2 (4th highest)Population: 581,381 (the lowest)
36. Nevada
Ethan Miller / Getty Images News via Getty Images
Change in background checks, Nov. 2022 to Nov. 2023: +8.1%Firearm background checks, Nov. 2023: 12,218 (10th lowest)Firearm background checks, Nov. 2022: 11,304 (13th lowest)Firearm background checks per 1,000 residents, Nov. 2023: 3.8 per 1,000 (9th lowest)Firearm background checks per 1,000 residents, Nov. 2022: 3.6 (9th lowest)Population: 3,177,772 (19th lowest)
35. New York
Dmitro2009 / iStock Editorial via Getty Images
Change in background checks, Nov. 2022 to Nov. 2023: +7.7%Firearm background checks, Nov. 2023: 33,595 (21st highest)Firearm background checks, Nov. 2022: 31,201 (24th highest)Firearm background checks per 1,000 residents, Nov. 2023: 1.7 per 1,000 (3rd lowest)Firearm background checks per 1,000 residents, Nov. 2022: 1.6 (3rd lowest)Population: 19,677,151 (4th highest)
34. Kentucky
Scott Olson / Getty Images News via Getty Images
Change in background checks, Nov. 2022 to Nov. 2023: +7.6%Firearm background checks, Nov. 2023: 29,958 (23rd highest)Firearm background checks, Nov. 2022: 27,831 (25th lowest)Firearm background checks per 1,000 residents, Nov. 2023: 6.6 per 1,000 (23rd highest)Firearm background checks per 1,000 residents, Nov. 2022: 6.2 (23rd lowest)Population: 4,512,310 (25th lowest)
33. Arkansas
artas / iStock via Getty Images
Change in background checks, Nov. 2022 to Nov. 2023: +7.5%Firearm background checks, Nov. 2023: 23,321 (21st lowest)Firearm background checks, Nov. 2022: 21,689 (22nd lowest)Firearm background checks per 1,000 residents, Nov. 2023: 7.7 per 1,000 (18th highest)Firearm background checks per 1,000 residents, Nov. 2022: 7.1 (19th highest)Population: 3,045,637 (18th lowest)
32. Texas
Rick Gershon / Getty Images News via Getty Images
Change in background checks, Nov. 2022 to Nov. 2023: +7.5%Firearm background checks, Nov. 2023: 149,021 (the highest)Firearm background checks, Nov. 2022: 138,599 (the highest)Firearm background checks per 1,000 residents, Nov. 2023: 5.0 per 1,000 (15th lowest)Firearm background checks per 1,000 residents, Nov. 2022: 4.6 (15th lowest)Population: 30,029,572 (2nd highest)
31. Nebraska
Change in background checks, Nov. 2022 to Nov. 2023: +7.4%Firearm background checks, Nov. 2023: 7,479 (8th lowest)Firearm background checks, Nov. 2022: 6,962 (7th lowest)Firearm background checks per 1,000 residents, Nov. 2023: 3.8 per 1,000 (8th lowest)Firearm background checks per 1,000 residents, Nov. 2022: 3.5 (8th lowest)Population: 1,967,923 (14th lowest)
30. Connecticut
Christopher Capozziello / Getty Images News via Getty Images
Change in background checks, Nov. 2022 to Nov. 2023: +6.1%Firearm background checks, Nov. 2023: 16,999 (17th lowest)Firearm background checks, Nov. 2022: 16,015 (17th lowest)Firearm background checks per 1,000 residents, Nov. 2023: 4.7 per 1,000 (14th lowest)Firearm background checks per 1,000 residents, Nov. 2022: 4.4 (12th lowest)Population: 3,626,205 (22nd lowest)
29. Delaware
Patrick Smith / Getty Images News via Getty Images
Change in background checks, Nov. 2022 to Nov. 2023: +6.1%Firearm background checks, Nov. 2023: 4,281 (4th lowest)Firearm background checks, Nov. 2022: 4,035 (4th lowest)Firearm background checks per 1,000 residents, Nov. 2023: 4.2 per 1,000 (10th lowest)Firearm background checks per 1,000 residents, Nov. 2022: 4.0 (10th lowest)Population: 1,018,396 (6th lowest)
28. Arizona
Marc Lecureuil / Getty Images
Change in background checks, Nov. 2022 to Nov. 2023: +6.0%Firearm background checks, Nov. 2023: 41,638 (17th highest)Firearm background checks, Nov. 2022: 39,287 (20th highest)Firearm background checks per 1,000 residents, Nov. 2023: 5.7 per 1,000 (16th lowest)Firearm background checks per 1,000 residents, Nov. 2022: 5.3 (18th lowest)Population: 7,359,197 (14th highest)
27. Missouri
Anadolu Agency / Anadolu Agency via Getty Images
Change in background checks, Nov. 2022 to Nov. 2023: +5.7%Firearm background checks, Nov. 2023: 50,107 (13th highest)Firearm background checks, Nov. 2022: 47,399 (14th highest)Firearm background checks per 1,000 residents, Nov. 2023: 8.1 per 1,000 (15th highest)Firearm background checks per 1,000 residents, Nov. 2022: 7.7 (15th highest)Population: 6,177,957 (18th highest)
26. Virginia
Change in background checks, Nov. 2022 to Nov. 2023: +5.3%Firearm background checks, Nov. 2023: 53,783 (10th highest)Firearm background checks, Nov. 2022: 51,056 (11th highest)Firearm background checks per 1,000 residents, Nov. 2023: 6.2 per 1,000 (24th lowest)Firearm background checks per 1,000 residents, Nov. 2022: 5.9 (20th lowest)Population: 8,683,619 (12th highest)
25. West Virginia
jfbenning / iStock Editorial via Getty Images
Change in background checks, Nov. 2022 to Nov. 2023: +4.3%Firearm background checks, Nov. 2023: 18,729 (19th lowest)Firearm background checks, Nov. 2022: 17,952 (19th lowest)Firearm background checks per 1,000 residents, Nov. 2023: 10.6 per 1,000 (5th highest)Firearm background checks per 1,000 residents, Nov. 2022: 10.1 (6th highest)Population: 1,775,156 (12th lowest)
24. Oklahoma
Change in background checks, Nov. 2022 to Nov. 2023: +3.7%Firearm background checks, Nov. 2023: 33,811 (20th highest)Firearm background checks, Nov. 2022: 32,606 (23rd highest)Firearm background checks per 1,000 residents, Nov. 2023: 8.4 per 1,000 (13th highest)Firearm background checks per 1,000 residents, Nov. 2022: 8.1 (13th highest)Population: 4,019,800 (23rd lowest)
23. Indiana
Scott Olson / Getty Images News via Getty Images
Change in background checks, Nov. 2022 to Nov. 2023: +3.3%Firearm background checks, Nov. 2023: 46,681 (14th highest)Firearm background checks, Nov. 2022: 45,168 (16th highest)Firearm background checks per 1,000 residents, Nov. 2023: 6.8 per 1,000 (22nd highest)Firearm background checks per 1,000 residents, Nov. 2022: 6.6 (22nd highest)Population: 6,833,037 (17th highest)
22. Iowa
lynngrae / iStock via Getty Images
Change in background checks, Nov. 2022 to Nov. 2023: +3.1%Firearm background checks, Nov. 2023: 13,783 (13th lowest)Firearm background checks, Nov. 2022: 13,373 (15th lowest)Firearm background checks per 1,000 residents, Nov. 2023: 4.3 per 1,000 (11th lowest)Firearm background checks per 1,000 residents, Nov. 2022: 4.2 (11th lowest)Population: 3,200,517 (20th lowest)
21. Louisiana
Change in background checks, Nov. 2022 to Nov. 2023: +1.8%Firearm background checks, Nov. 2023: 29,070 (24th highest)Firearm background checks, Nov. 2022: 28,556 (25th highest)Firearm background checks per 1,000 residents, Nov. 2023: 6.3 per 1,000 (25th lowest)Firearm background checks per 1,000 residents, Nov. 2022: 6.2 (24th lowest)Population: 4,590,241 (25th highest)
20. Kansas
BeyondImages / iStock Unreleased via Getty Images
Change in background checks, Nov. 2022 to Nov. 2023: +1.3%Firearm background checks, Nov. 2023: 17,750 (18th lowest)Firearm background checks, Nov. 2022: 17,521 (18th lowest)Firearm background checks per 1,000 residents, Nov. 2023: 6.0 per 1,000 (23rd lowest)Firearm background checks per 1,000 residents, Nov. 2022: 6.0 (22nd lowest)Population: 2,937,150 (16th lowest)
19. Georgia
RonBailey / E+ via Getty Images
Change in background checks, Nov. 2022 to Nov. 2023: +1.0%Firearm background checks, Nov. 2023: 50,327 (12th highest)Firearm background checks, Nov. 2022: 49,833 (12th highest)Firearm background checks per 1,000 residents, Nov. 2023: 4.6 per 1,000 (13th lowest)Firearm background checks per 1,000 residents, Nov. 2022: 4.6 (14th lowest)Population: 10,912,876 (8th highest)
18. Minnesota
Change in background checks, Nov. 2022 to Nov. 2023: +0.4%Firearm background checks, Nov. 2023: 37,811 (18th highest)Firearm background checks, Nov. 2022: 37,651 (21st highest)Firearm background checks per 1,000 residents, Nov. 2023: 6.6 per 1,000 (24th highest)Firearm background checks per 1,000 residents, Nov. 2022: 6.6 (24th highest)Population: 5,717,184 (22nd highest)
17. Washington
Juan Jose Napuri / iStock via Getty Images
Change in background checks, Nov. 2022 to Nov. 2023: +0.0%Firearm background checks, Nov. 2023: 46,211 (15th highest)Firearm background checks, Nov. 2022: 46,202 (15th highest)Firearm background checks per 1,000 residents, Nov. 2023: 5.9 per 1,000 (21st lowest)Firearm background checks per 1,000 residents, Nov. 2022: 5.9 (21st lowest)Population: 7,785,786 (13th highest)
16. Vermont
SKapl / iStock via Getty Images
Change in background checks, Nov. 2022 to Nov. 2023: -0.4%Firearm background checks, Nov. 2023: 3,688 (3rd lowest)Firearm background checks, Nov. 2022: 3,704 (3rd lowest)Firearm background checks per 1,000 residents, Nov. 2023: 5.7 per 1,000 (18th lowest)Firearm background checks per 1,000 residents, Nov. 2022: 5.7 (19th lowest)Population: 647,064 (2nd lowest)
15. New Mexico
Change in background checks, Nov. 2022 to Nov. 2023: -0.6%Firearm background checks, Nov. 2023: 13,897 (14th lowest)Firearm background checks, Nov. 2022: 13,980 (16th lowest)Firearm background checks per 1,000 residents, Nov. 2023: 6.6 per 1,000 (25th highest)Firearm background checks per 1,000 residents, Nov. 2022: 6.6 (21st highest)Population: 2,113,344 (15th lowest)
14. Pennsylvania
Spencer Platt / Getty Images News via Getty Images
Change in background checks, Nov. 2022 to Nov. 2023: -1.3%Firearm background checks, Nov. 2023: 104,201 (4th highest)Firearm background checks, Nov. 2022: 105,538 (3rd highest)Firearm background checks per 1,000 residents, Nov. 2023: 8.0 per 1,000 (16th highest)Firearm background checks per 1,000 residents, Nov. 2022: 8.1 (12th highest)Population: 12,972,008 (5th highest)
13. Mississippi
Change in background checks, Nov. 2022 to Nov. 2023: -1.7%Firearm background checks, Nov. 2023: 24,761 (25th lowest)Firearm background checks, Nov. 2022: 25,198 (24th lowest)Firearm background checks per 1,000 residents, Nov. 2023: 8.4 per 1,000 (12th highest)Firearm background checks per 1,000 residents, Nov. 2022: 8.6 (11th highest)Population: 2,940,057 (17th lowest)
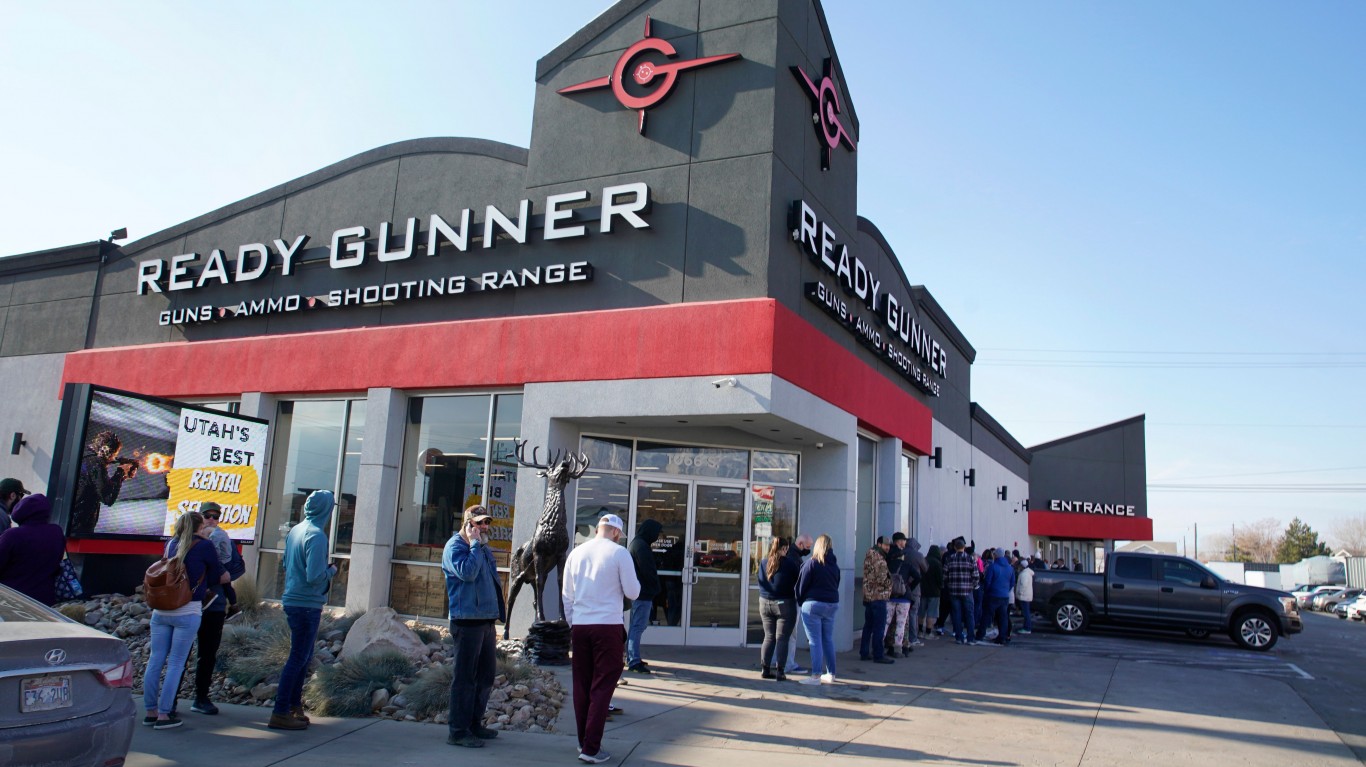
12. Utah
GEORGE FREY / AFP via Getty Images
Change in background checks, Nov. 2022 to Nov. 2023: -1.7%Firearm background checks, Nov. 2023: 23,863 (23rd lowest)Firearm background checks, Nov. 2022: 24,288 (23rd lowest)Firearm background checks per 1,000 residents, Nov. 2023: 7.1 per 1,000 (20th highest)Firearm background checks per 1,000 residents, Nov. 2022: 7.2 (18th highest)Population: 3,380,800 (21st lowest)
11. South Dakota
picture alliance / picture alliance via Getty Images
Change in background checks, Nov. 2022 to Nov. 2023: -2.4%Firearm background checks, Nov. 2023: 8,127 (9th lowest)Firearm background checks, Nov. 2022: 8,330 (9th lowest)Firearm background checks per 1,000 residents, Nov. 2023: 8.9 per 1,000 (9th highest)Firearm background checks per 1,000 residents, Nov. 2022: 9.2 (10th highest)Population: 909,824 (5th lowest)
10. Idaho
Karl Weatherly / Photodisc via Getty Images
Change in background checks, Nov. 2022 to Nov. 2023: -2.7%Firearm background checks, Nov. 2023: 19,180 (20th lowest)Firearm background checks, Nov. 2022: 19,703 (20th lowest)Firearm background checks per 1,000 residents, Nov. 2023: 9.9 per 1,000 (6th highest)Firearm background checks per 1,000 residents, Nov. 2022: 10.2 (5th highest)Population: 1,939,033 (13th lowest)
9. Colorado
mtcurado / iStock Unreleased via Getty Images
Change in background checks, Nov. 2022 to Nov. 2023: -3.2%Firearm background checks, Nov. 2023: 42,161 (16th highest)Firearm background checks, Nov. 2022: 43,551 (17th highest)Firearm background checks per 1,000 residents, Nov. 2023: 7.2 per 1,000 (19th highest)Firearm background checks per 1,000 residents, Nov. 2022: 7.5 (16th highest)Population: 5,839,926 (21st highest)
8. Alabama
Barry Lewis / In Pictures via Getty Images
Change in background checks, Nov. 2022 to Nov. 2023: -7.3%Firearm background checks, Nov. 2023: 55,844 (9th highest)Firearm background checks, Nov. 2022: 60,215 (9th highest)Firearm background checks per 1,000 residents, Nov. 2023: 11.0 per 1,000 (4th highest)Firearm background checks per 1,000 residents, Nov. 2022: 11.9 (2nd highest)Population: 5,074,296 (24th highest)
7. South Carolina
Richard Ellis / Getty Images News via Getty Images
Change in background checks, Nov. 2022 to Nov. 2023: -9.0%Firearm background checks, Nov. 2023: 31,749 (22nd highest)Firearm background checks, Nov. 2022: 34,905 (22nd highest)Firearm background checks per 1,000 residents, Nov. 2023: 6.0 per 1,000 (22nd lowest)Firearm background checks per 1,000 residents, Nov. 2022: 6.6 (23rd highest)Population: 5,282,634 (23rd highest)
6. Alaska
specnaz-s / iStock via Getty Images
Change in background checks, Nov. 2022 to Nov. 2023: -9.5%Firearm background checks, Nov. 2023: 6,321 (5th lowest)Firearm background checks, Nov. 2022: 6,981 (8th lowest)Firearm background checks per 1,000 residents, Nov. 2023: 8.6 per 1,000 (10th highest)Firearm background checks per 1,000 residents, Nov. 2022: 9.5 (9th highest)Population: 733,583 (3rd lowest)
5. Tennessee
Change in background checks, Nov. 2022 to Nov. 2023: -11.5%Firearm background checks, Nov. 2023: 64,866 (7th highest)Firearm background checks, Nov. 2022: 73,315 (6th highest)Firearm background checks per 1,000 residents, Nov. 2023: 9.2 per 1,000 (7th highest)Firearm background checks per 1,000 residents, Nov. 2022: 10.4 (3rd highest)Population: 7,051,339 (15th highest)
4. Wisconsin
Change in background checks, Nov. 2022 to Nov. 2023: -13.4%Firearm background checks, Nov. 2023: 50,476 (11th highest)Firearm background checks, Nov. 2022: 58,280 (10th highest)Firearm background checks per 1,000 residents, Nov. 2023: 8.6 per 1,000 (11th highest)Firearm background checks per 1,000 residents, Nov. 2022: 9.9 (7th highest)Population: 5,892,539 (20th highest)
3. Maryland
Anadolu Agency / Anadolu Agency via Getty Images
Change in background checks, Nov. 2022 to Nov. 2023: -32.9%Firearm background checks, Nov. 2023: 26,633 (25th highest)Firearm background checks, Nov. 2022: 39,708 (19th highest)Firearm background checks per 1,000 residents, Nov. 2023: 4.3 per 1,000 (12th lowest)Firearm background checks per 1,000 residents, Nov. 2022: 6.4 (25th highest)Population: 6,164,660 (19th highest)
2. Illinois
Scott Olson / Getty Images News via Getty Images
Change in background checks, Nov. 2022 to Nov. 2023: -42.4%Firearm background checks, Nov. 2023: 24,055 (24th lowest)Firearm background checks, Nov. 2022: 41,743 (18th highest)Firearm background checks per 1,000 residents, Nov. 2023: 1.9 per 1,000 (4th lowest)Firearm background checks per 1,000 residents, Nov. 2022: 3.3 (7th lowest)Population: 12,582,032 (6th highest)
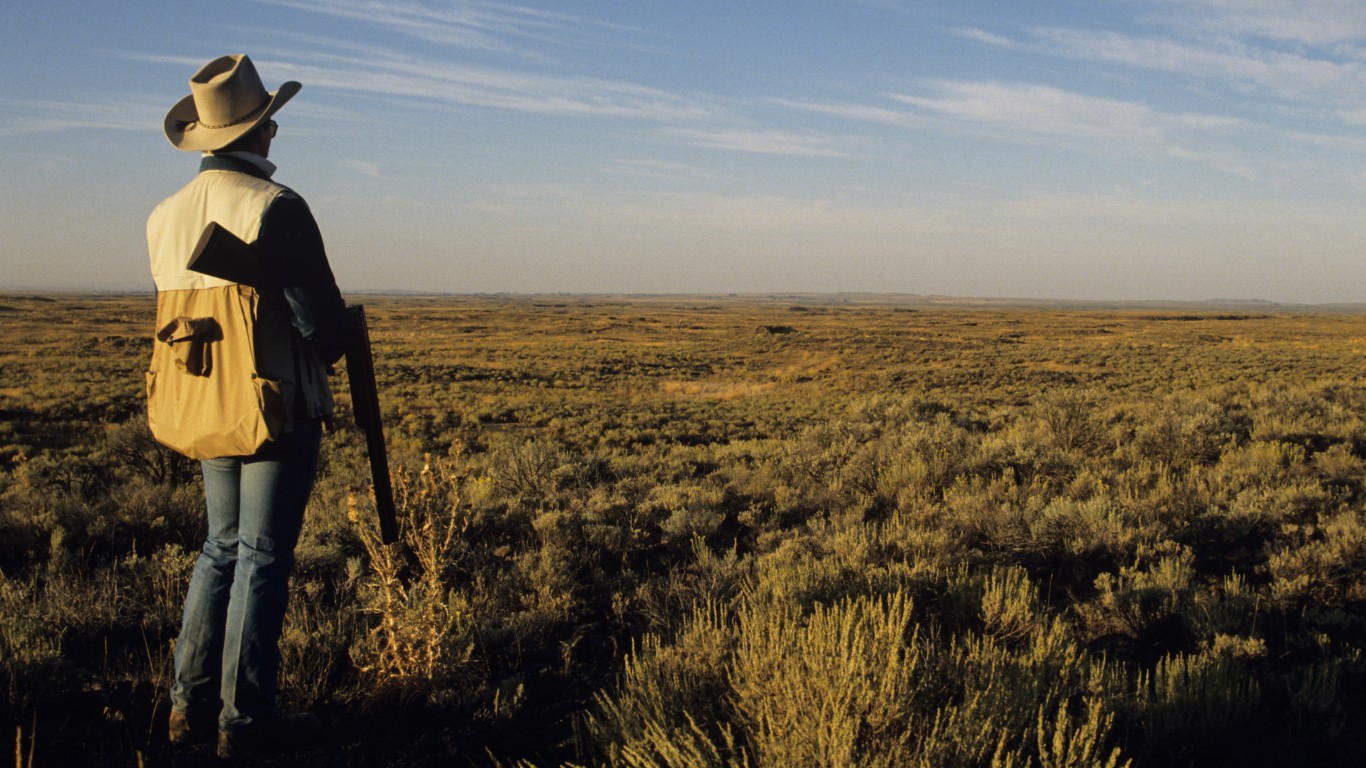
1. Oregon
ROB KERR / AFP via Getty Images
Change in background checks, Nov. 2022 to Nov. 2023: -62.7%Firearm background checks, Nov. 2023: 33,986 (19th highest)Firearm background checks, Nov. 2022: 91,073 (5th highest)Firearm background checks per 1,000 residents, Nov. 2023: 8.0 per 1,000 (17th highest)Firearm background checks per 1,000 residents, Nov. 2022: 21.5 (the highest)Population: 4,240,137 (24th lowest)
Methodology
To identify the states where gun sales are decreasing the most, 24/7 Wall St. used data from the FBI’s National Instant Criminal Background Check System . We ranked the states based on the percent change in background checks from November 2022 to November 2023, from the largest increase to the largest drop. To reach a more accurate approximation of gun sales, we adjusted background checks by excluding checks for such categories as pawn shop transactions, returns, rentals, and rechecks.
Even after removing some types of checks that are clearly unrelated to a new firearm purchase, because every state has different laws in terms of when background checks are required and different accounting practices, background checks still only serve as a rough approximation of gun sales.
The most glaring example of this is Illinois, which alone accounted for about half of the background checks in the country after excluding the aforementioned categories. Illinois no longer breaks down background checks separately, but did from July 2016 through July 2021. During the four full years of data, an average of 9.2% of Illinois’s non-private sale or gun-specific permit checks were non-rechecks. We applied that average to the most recent state figures to estimate Illinois’ count. This was done only because Illinois is such a glaring example of inconsistency and because there was historical data to produce an estimate.
There are likely other states for which the background check figures listed are inflated or underestimated proxies for gun sales.
Population data came from the U.S. Census Bureau’s Population and Housing Unit Estimates Program, and are for July of 2022, the most recent data available.
Are You Still Paying With a Debit Card?
The average American spends $17,274 on debit cards a year, and it’s a HUGE mistake. First, debit cards don’t have the same fraud protections as credit cards. Once your money is gone, it’s gone. But more importantly you can actually get something back from this spending every time you swipe.
Issuers are handing out wild bonuses right now. With some you can earn up to 5% back on every purchase. That’s like getting a 5% discount on everything you buy!
Our top pick is kind of hard to imagine. Not only does it pay up to 5% back, it also includes a $200 cash back reward in the first six months, a 0% intro APR, and…. $0 annual fee. It’s quite literally free money for any one that uses a card regularly. Click here to learn more!
Flywheel Publishing has partnered with CardRatings to provide coverage of credit card products. Flywheel Publishing and CardRatings may receive a commission from card issuers.
Read more:
Special Report , FBI , federal government , firearm background checks , firearm background checks per capita , firearms , gun , gun control , gun sales , gun sales falling , guns , NICS , Politics
Thank you for reading! Have some feedback for us?Contact the 24/7 Wall St. editorial team .