Most criminal cases in the United States are investigated and prosecuted at the state or local level. Federal involvement is typically reserved for the most serious offenses, including terrorism, interstate drug trafficking, and crimes against the government. In recent years, however, firearm offenses have been taking up a growing share of federal resources.
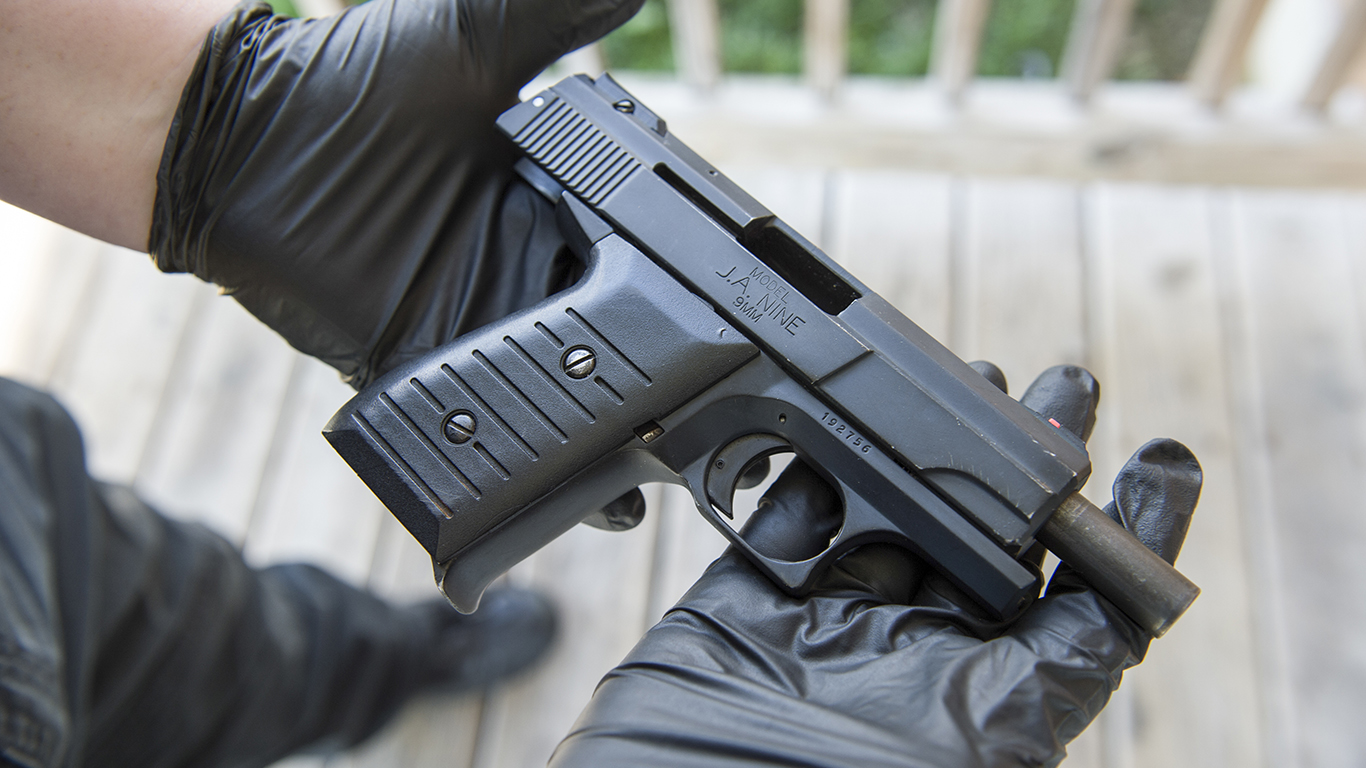
When a firearm is recovered at a crime scene or taken from a suspect, local law enforcement often enlist the help of the U.S. Bureau of Alcohol, Tobacco, Firearms, and Explosives to trace any recovered firearms back to their original point of sale. In each of the last nine years, the number of firearms traced by the ATF increased, topping 504,000 in 2022 — up 10.6% from the previous year and more than double the number of tracings reported in 2014.
Though not all guns the ATF traces have been used in a crime — just as not all firearms used for illicit purposes are traced — federal tracing data offers valuable insight into trends and geographic patterns related to gun violence in the United States. The latest data shows that certain states are driving the steady rise in firearm investigations. (Here is a look at every state’s grade on gun laws.)
Using ATF firearm tracing data as a proxy for criminal offenses, 24/7 Wall St. identified the states where gun crime is surging. We ranked all states on the one-year change in ATF gun tracings, from smallest to largest.
Only eight of the 50 states reported a year-over-year decline in federal firearm investigations. Among the remaining 42 states, ATF firearm tracings increased anywhere from 0.7% to 172.5% between 2021 and 2022.
While most of the states driving the national increase in gun crime also reported a net influx of new residents between 2021 and 2022, population growth alone does not explain the spike in criminal gun violence. Adjusted for population using five-year estimates from the U.S. Census Bureau’s 2021 and 2022 American Community Surveys, population-adjusted ATF firearm tracings also increased in each of the 42 states reporting an increase in total federal gun tracings.
It is important to note that the states reporting the largest one-year increase in gun tracings do not necessarily have a higher than average concentration of gun crime. Just over half of the 10 highest ranking states on this list had fewer gun tracings per 100,000 residents in 2022 than the national average of 149 per 100,000. (Here is a look at the states where gun deaths are increasing the fastest.)
Here are the states driving the surge in gun crime.
50. Michigan

- 1-yr. change in ATF firearm tracings, 2021-2022: -17.7% (-2,184)
- ATF firearm tracings by year: 10,145 in 2022; 12,329 in 2021
- 1-yr. change in population, 2021-2022: -0.2% (-16,693)
- Population-adjusted ATF firearm tracings in 2022: 101.1 per 100,000 people (15th lowest of 50 states)
- Population-adjusted ATF firearm tracings in 2021: 122.7 per 100,000 people (25th highest of 50 states)
49. Nevada

- 1-yr. change in ATF firearm tracings, 2021-2022: -11.5% (-776)
- ATF firearm tracings by year: 5,959 in 2022; 6,735 in 2021
- 1-yr. change in population, 2021-2022: +1.1% (+33,781)
- Population-adjusted ATF firearm tracings in 2022: 187.5 per 100,000 people (9th highest of 50 states)
- Population-adjusted ATF firearm tracings in 2021: 214.2 per 100,000 people (4th highest of 50 states)
48. Nebraska
- 1-yr. change in ATF firearm tracings, 2021-2022: -4.4% (-99)
- ATF firearm tracings by year: 2,141 in 2022; 2,240 in 2021
- 1-yr. change in population, 2021-2022: +0.2% (+4,231)
- Population-adjusted ATF firearm tracings in 2022: 108.8 per 100,000 people (19th lowest of 50 states)
- Population-adjusted ATF firearm tracings in 2021: 114.1 per 100,000 people (21st lowest of 50 states)
47. New Mexico

- 1-yr. change in ATF firearm tracings, 2021-2022: -3.9% (-159)
- ATF firearm tracings by year: 3,955 in 2022; 4,114 in 2021
- 1-yr. change in population, 2021-2022: -0.1% (-2,533)
- Population-adjusted ATF firearm tracings in 2022: 187.1 per 100,000 people (10th highest of 50 states)
- Population-adjusted ATF firearm tracings in 2021: 194.4 per 100,000 people (6th highest of 50 states)
46. Ohio

- 1-yr. change in ATF firearm tracings, 2021-2022: -1.5% (-306)
- ATF firearm tracings by year: 20,520 in 2022; 20,826 in 2021
- 1-yr. change in population, 2021-2022: -0.2% (-23,959)
- Population-adjusted ATF firearm tracings in 2022: 174.6 per 100,000 people (13th highest of 50 states)
- Population-adjusted ATF firearm tracings in 2021: 176.8 per 100,000 people (8th highest of 50 states)
45. Arkansas

- 1-yr. change in ATF firearm tracings, 2021-2022: -1.3% (-47)
- ATF firearm tracings by year: 3,494 in 2022; 3,541 in 2021
- 1-yr. change in population, 2021-2022: +0.7% (+19,746)
- Population-adjusted ATF firearm tracings in 2022: 114.7 per 100,000 people (20th lowest of 50 states)
- Population-adjusted ATF firearm tracings in 2021: 117.0 per 100,000 people (22nd lowest of 50 states)
44. Missouri

- 1-yr. change in ATF firearm tracings, 2021-2022: -0.5% (-54)
- ATF firearm tracings by year: 10,159 in 2022; 10,213 in 2021
- 1-yr. change in population, 2021-2022: +0.2% (+9,770)
- Population-adjusted ATF firearm tracings in 2022: 164.4 per 100,000 people (18th highest of 50 states)
- Population-adjusted ATF firearm tracings in 2021: 165.6 per 100,000 people (12th highest of 50 states)
43. Delaware
- 1-yr. change in ATF firearm tracings, 2021-2022: -0.1% (-2)
- ATF firearm tracings by year: 1,676 in 2022; 1,678 in 2021
- 1-yr. change in population, 2021-2022: +1.5% (+15,012)
- Population-adjusted ATF firearm tracings in 2022: 164.6 per 100,000 people (17th highest of 50 states)
- Population-adjusted ATF firearm tracings in 2021: 167.2 per 100,000 people (10th highest of 50 states)
42. New Hampshire

- 1-yr. change in ATF firearm tracings, 2021-2022: +0.7% (+5)
- ATF firearm tracings by year: 710 in 2022; 705 in 2021
- 1-yr. change in population, 2021-2022: +0.5% (+6,239)
- Population-adjusted ATF firearm tracings in 2022: 50.9 per 100,000 people (3rd lowest of 50 states)
- Population-adjusted ATF firearm tracings in 2021: 50.8 per 100,000 people (7th lowest of 50 states)
41. Oregon

- 1-yr. change in ATF firearm tracings, 2021-2022: +2.3% (+127)
- ATF firearm tracings by year: 5,586 in 2022; 5,459 in 2021
- 1-yr. change in population, 2021-2022: -0.1% (-6,018)
- Population-adjusted ATF firearm tracings in 2022: 131.7 per 100,000 people (23rd lowest of 50 states)
- Population-adjusted ATF firearm tracings in 2021: 128.6 per 100,000 people (24th highest of 50 states)
40. Illinois

- 1-yr. change in ATF firearm tracings, 2021-2022: +2.7% (+518)
- ATF firearm tracings by year: 19,706 in 2022; 19,188 in 2021
- 1-yr. change in population, 2021-2022: -0.7% (-89,437)
- Population-adjusted ATF firearm tracings in 2022: 156.6 per 100,000 people (21st highest of 50 states)
- Population-adjusted ATF firearm tracings in 2021: 151.4 per 100,000 people (18th highest of 50 states)
39. California
- 1-yr. change in ATF firearm tracings, 2021-2022: +3.5% (+1,924)
- ATF firearm tracings by year: 56,262 in 2022; 54,338 in 2021
- 1-yr. change in population, 2021-2022: -0.5% (-208,494)
- Population-adjusted ATF firearm tracings in 2022: 144.2 per 100,000 people (23rd highest of 50 states)
- Population-adjusted ATF firearm tracings in 2021: 138.5 per 100,000 people (22nd highest of 50 states)
38. Kansas
- 1-yr. change in ATF firearm tracings, 2021-2022: +5.1% (+218)
- ATF firearm tracings by year: 4,521 in 2022; 4,303 in 2021
- 1-yr. change in population, 2021-2022: +0.1% (+2,568)
- Population-adjusted ATF firearm tracings in 2022: 153.9 per 100,000 people (22nd highest of 50 states)
- Population-adjusted ATF firearm tracings in 2021: 146.6 per 100,000 people (20th highest of 50 states)
37. Florida

- 1-yr. change in ATF firearm tracings, 2021-2022: +5.3% (+1,844)
- ATF firearm tracings by year: 36,335 in 2022; 34,491 in 2021
- 1-yr. change in population, 2021-2022: +2.1% (+463,695)
- Population-adjusted ATF firearm tracings in 2022: 163.3 per 100,000 people (20th highest of 50 states)
- Population-adjusted ATF firearm tracings in 2021: 158.4 per 100,000 people (15th highest of 50 states)
36. Oklahoma

- 1-yr. change in ATF firearm tracings, 2021-2022: +6.7% (+355)
- ATF firearm tracings by year: 5,657 in 2022; 5,302 in 2021
- 1-yr. change in population, 2021-2022: +0.8% (+33,161)
- Population-adjusted ATF firearm tracings in 2022: 140.7 per 100,000 people (24th highest of 50 states)
- Population-adjusted ATF firearm tracings in 2021: 133.0 per 100,000 people (23rd highest of 50 states)
35. North Dakota

- 1-yr. change in ATF firearm tracings, 2021-2022: +6.9% (+54)
- ATF firearm tracings by year: 832 in 2022; 778 in 2021
- 1-yr. change in population, 2021-2022: +0.6% (+4,313)
- Population-adjusted ATF firearm tracings in 2022: 106.8 per 100,000 people (18th lowest of 50 states)
- Population-adjusted ATF firearm tracings in 2021: 100.4 per 100,000 people (18th lowest of 50 states)
34. North Carolina

- 1-yr. change in ATF firearm tracings, 2021-2022: +8.6% (+1,981)
- ATF firearm tracings by year: 25,085 in 2022; 23,104 in 2021
- 1-yr. change in population, 2021-2022: +1.4% (+147,811)
- Population-adjusted ATF firearm tracings in 2022: 234.5 per 100,000 people (3rd highest of 50 states)
- Population-adjusted ATF firearm tracings in 2021: 219.0 per 100,000 people (3rd highest of 50 states)
33. Idaho

- 1-yr. change in ATF firearm tracings, 2021-2022: +8.6% (+119)
- ATF firearm tracings by year: 1,495 in 2022; 1,376 in 2021
- 1-yr. change in population, 2021-2022: +2.0% (+38,110)
- Population-adjusted ATF firearm tracings in 2022: 77.1 per 100,000 people (9th lowest of 50 states)
- Population-adjusted ATF firearm tracings in 2021: 72.4 per 100,000 people (12th lowest of 50 states)
32. Indiana
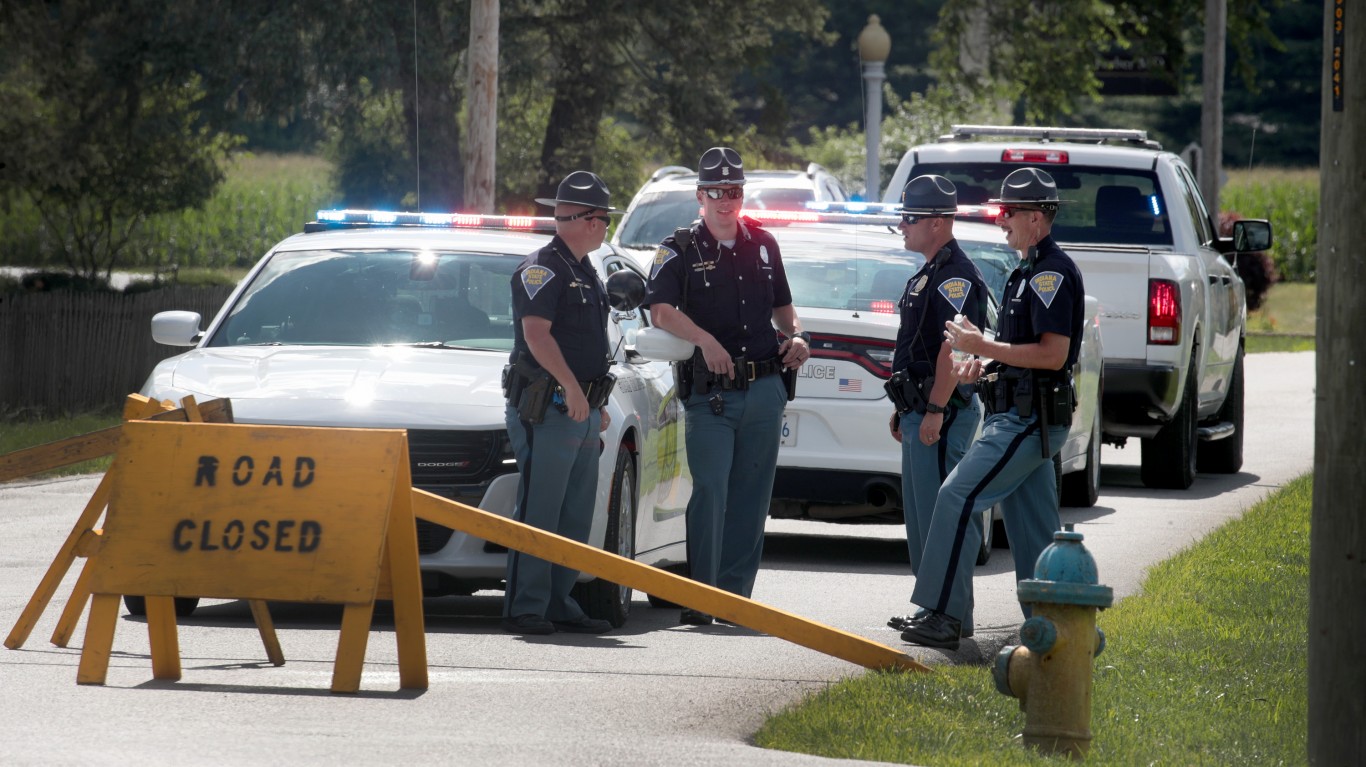
- 1-yr. change in ATF firearm tracings, 2021-2022: +9.4% (+971)
- ATF firearm tracings by year: 11,320 in 2022; 10,349 in 2021
- 1-yr. change in population, 2021-2022: +0.4% (+27,052)
- Population-adjusted ATF firearm tracings in 2022: 165.7 per 100,000 people (16th highest of 50 states)
- Population-adjusted ATF firearm tracings in 2021: 152.1 per 100,000 people (17th highest of 50 states)
31. Montana

- 1-yr. change in ATF firearm tracings, 2021-2022: +9.8% (+117)
- ATF firearm tracings by year: 1,305 in 2022; 1,188 in 2021
- 1-yr. change in population, 2021-2022: +1.7% (+18,596)
- Population-adjusted ATF firearm tracings in 2022: 116.2 per 100,000 people (21st lowest of 50 states)
- Population-adjusted ATF firearm tracings in 2021: 107.6 per 100,000 people (19th lowest of 50 states)
30. Kentucky

- 1-yr. change in ATF firearm tracings, 2021-2022: +10.5% (+712)
- ATF firearm tracings by year: 7,524 in 2022; 6,812 in 2021
- 1-yr. change in population, 2021-2022: +0.1% (+2,916)
- Population-adjusted ATF firearm tracings in 2022: 166.7 per 100,000 people (14th highest of 50 states)
- Population-adjusted ATF firearm tracings in 2021: 151.1 per 100,000 people (19th highest of 50 states)
29. Tennessee

- 1-yr. change in ATF firearm tracings, 2021-2022: +10.6% (+1,651)
- ATF firearm tracings by year: 17,182 in 2022; 15,531 in 2021
- 1-yr. change in population, 2021-2022: +1.1% (+76,121)
- Population-adjusted ATF firearm tracings in 2022: 243.7 per 100,000 people (2nd highest of 50 states)
- Population-adjusted ATF firearm tracings in 2021: 222.7 per 100,000 people (2nd highest of 50 states)
28. Georgia

- 1-yr. change in ATF firearm tracings, 2021-2022: +10.7% (+2,184)
- ATF firearm tracings by year: 22,656 in 2022; 20,472 in 2021
- 1-yr. change in population, 2021-2022: +1.1% (+113,310)
- Population-adjusted ATF firearm tracings in 2022: 207.6 per 100,000 people (5th highest of 50 states)
- Population-adjusted ATF firearm tracings in 2021: 189.6 per 100,000 people (7th highest of 50 states)
27. Washington
- 1-yr. change in ATF firearm tracings, 2021-2022: +10.8% (+605)
- ATF firearm tracings by year: 6,191 in 2022; 5,586 in 2021
- 1-yr. change in population, 2021-2022: +0.6% (+47,094)
- Population-adjusted ATF firearm tracings in 2022: 79.5 per 100,000 people (10th lowest of 50 states)
- Population-adjusted ATF firearm tracings in 2021: 72.2 per 100,000 people (11th lowest of 50 states)
26. South Dakota

- 1-yr. change in ATF firearm tracings, 2021-2022: +11.7% (+97)
- ATF firearm tracings by year: 929 in 2022; 832 in 2021
- 1-yr. change in population, 2021-2022: +1.6% (+14,448)
- Population-adjusted ATF firearm tracings in 2022: 102.1 per 100,000 people (16th lowest of 50 states)
- Population-adjusted ATF firearm tracings in 2021: 92.9 per 100,000 people (16th lowest of 50 states)
25. New Jersey

- 1-yr. change in ATF firearm tracings, 2021-2022: +12.0% (+563)
- ATF firearm tracings by year: 5,248 in 2022; 4,685 in 2021
- 1-yr. change in population, 2021-2022: -0.1% (-5,431)
- Population-adjusted ATF firearm tracings in 2022: 56.7 per 100,000 people (6th lowest of 50 states)
- Population-adjusted ATF firearm tracings in 2021: 50.6 per 100,000 people (6th lowest of 50 states)
24. Colorado

- 1-yr. change in ATF firearm tracings, 2021-2022: +12.3% (+866)
- ATF firearm tracings by year: 7,917 in 2022; 7,051 in 2021
- 1-yr. change in population, 2021-2022: +0.5% (+27,857)
- Population-adjusted ATF firearm tracings in 2022: 135.6 per 100,000 people (25th lowest of 50 states)
- Population-adjusted ATF firearm tracings in 2021: 121.3 per 100,000 people (25th lowest of 50 states)
23. Mississippi
- 1-yr. change in ATF firearm tracings, 2021-2022: +12.9% (+614)
- ATF firearm tracings by year: 5,358 in 2022; 4,744 in 2021
- 1-yr. change in population, 2021-2022: -0.3% (-9,908)
- Population-adjusted ATF firearm tracings in 2022: 182.2 per 100,000 people (11th highest of 50 states)
- Population-adjusted ATF firearm tracings in 2021: 160.8 per 100,000 people (13th highest of 50 states)
22. Maryland

- 1-yr. change in ATF firearm tracings, 2021-2022: +13.0% (+1,280)
- ATF firearm tracings by year: 11,137 in 2022; 9,857 in 2021
- 1-yr. change in population, 2021-2022: -0.01% (-469)
- Population-adjusted ATF firearm tracings in 2022: 180.7 per 100,000 people (12th highest of 50 states)
- Population-adjusted ATF firearm tracings in 2021: 159.9 per 100,000 people (14th highest of 50 states)
21. South Carolina

- 1-yr. change in ATF firearm tracings, 2021-2022: +13.0% (+1,393)
- ATF firearm tracings by year: 12,106 in 2022; 10,713 in 2021
- 1-yr. change in population, 2021-2022: +1.8% (+91,929)
- Population-adjusted ATF firearm tracings in 2022: 229.2 per 100,000 people (4th highest of 50 states)
- Population-adjusted ATF firearm tracings in 2021: 206.4 per 100,000 people (5th highest of 50 states)
20. Wisconsin
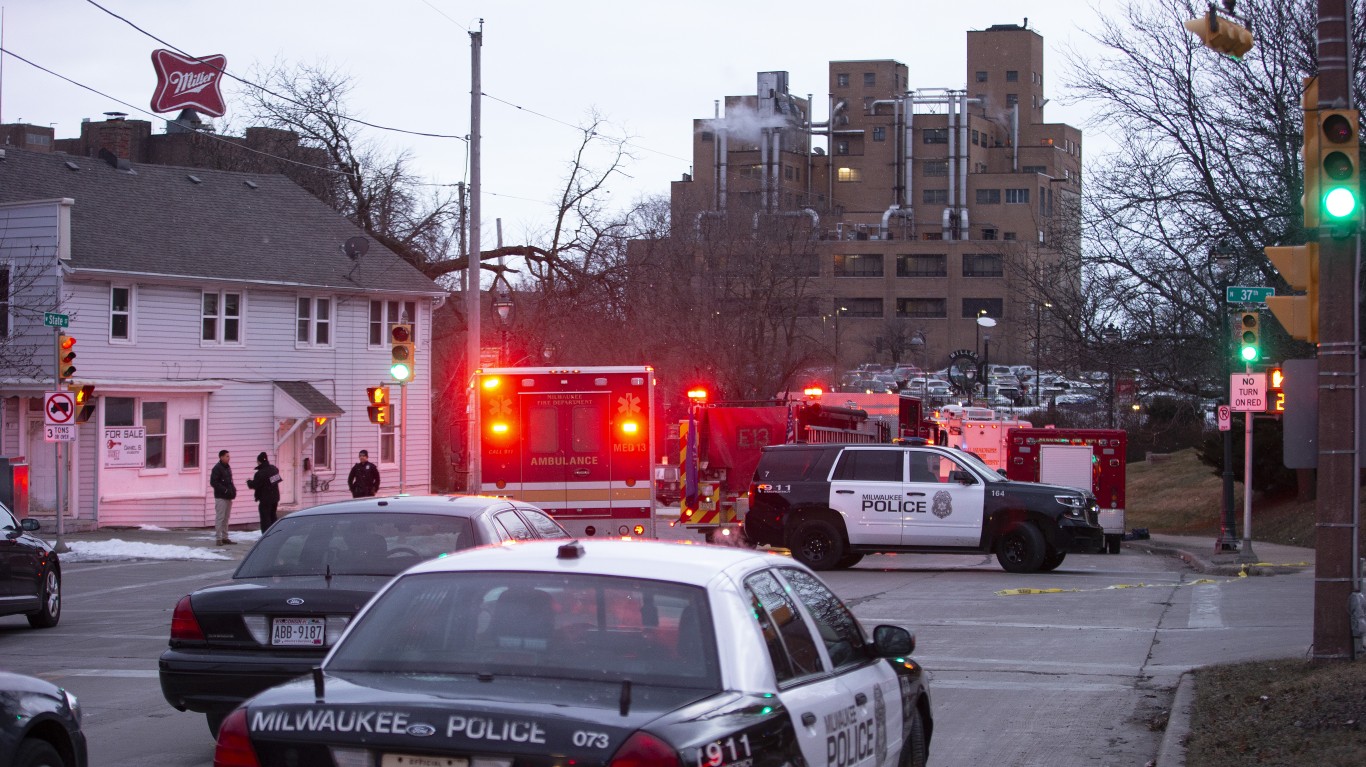
- 1-yr. change in ATF firearm tracings, 2021-2022: +13.4% (+945)
- ATF firearm tracings by year: 8,007 in 2022; 7,062 in 2021
- 1-yr. change in population, 2021-2022: -0.1% (-3,369)
- Population-adjusted ATF firearm tracings in 2022: 135.9 per 100,000 people (25th highest of 50 states)
- Population-adjusted ATF firearm tracings in 2021: 119.8 per 100,000 people (24th lowest of 50 states)
19. Massachusetts

- 1-yr. change in ATF firearm tracings, 2021-2022: +13.7% (+443)
- ATF firearm tracings by year: 3,665 in 2022; 3,222 in 2021
- 1-yr. change in population, 2021-2022: +0.0% (-2,749)
- Population-adjusted ATF firearm tracings in 2022: 52.5 per 100,000 people (4th lowest of 50 states)
- Population-adjusted ATF firearm tracings in 2021: 46.1 per 100,000 people (5th lowest of 50 states)
18. Utah

- 1-yr. change in ATF firearm tracings, 2021-2022: +14.0% (+423)
- ATF firearm tracings by year: 3,453 in 2022; 3,030 in 2021
- 1-yr. change in population, 2021-2022: +1.3% (+42,825)
- Population-adjusted ATF firearm tracings in 2022: 102.1 per 100,000 people (17th lowest of 50 states)
- Population-adjusted ATF firearm tracings in 2021: 90.8 per 100,000 people (15th lowest of 50 states)
17. Wyoming

- 1-yr. change in ATF firearm tracings, 2021-2022: +14.1% (+42)
- ATF firearm tracings by year: 340 in 2022; 298 in 2021
- 1-yr. change in population, 2021-2022: +0.5% (+2,578)
- Population-adjusted ATF firearm tracings in 2022: 58.5 per 100,000 people (7th lowest of 50 states)
- Population-adjusted ATF firearm tracings in 2021: 51.5 per 100,000 people (8th lowest of 50 states)
16. Pennsylvania

- 1-yr. change in ATF firearm tracings, 2021-2022: +14.1% (+2,173)
- ATF firearm tracings by year: 17,543 in 2022; 15,370 in 2021
- 1-yr. change in population, 2021-2022: +0.1% (+7,952)
- Population-adjusted ATF firearm tracings in 2022: 135.2 per 100,000 people (24th lowest of 50 states)
- Population-adjusted ATF firearm tracings in 2021: 118.6 per 100,000 people (23rd lowest of 50 states)
15. Minnesota

- 1-yr. change in ATF firearm tracings, 2021-2022: +15.7% (+722)
- ATF firearm tracings by year: 5,327 in 2022; 4,605 in 2021
- 1-yr. change in population, 2021-2022: +0.2% (+9,794)
- Population-adjusted ATF firearm tracings in 2022: 93.2 per 100,000 people (12th lowest of 50 states)
- Population-adjusted ATF firearm tracings in 2021: 80.7 per 100,000 people (14th lowest of 50 states)
14. Arizona
- 1-yr. change in ATF firearm tracings, 2021-2022: +15.7% (+1,906)
- ATF firearm tracings by year: 14,019 in 2022; 12,113 in 2021
- 1-yr. change in population, 2021-2022: +1.1% (+82,881)
- Population-adjusted ATF firearm tracings in 2022: 190.5 per 100,000 people (7th highest of 50 states)
- Population-adjusted ATF firearm tracings in 2021: 166.5 per 100,000 people (11th highest of 50 states)
13. New York

- 1-yr. change in ATF firearm tracings, 2021-2022: +16.3% (+1,677)
- ATF firearm tracings by year: 11,987 in 2022; 10,310 in 2021
- 1-yr. change in population, 2021-2022: -0.8% (-158,762)
- Population-adjusted ATF firearm tracings in 2022: 60.9 per 100,000 people (8th lowest of 50 states)
- Population-adjusted ATF firearm tracings in 2021: 52.0 per 100,000 people (9th lowest of 50 states)
12. Louisiana

- 1-yr. change in ATF firearm tracings, 2021-2022: +17.4% (+2,412)
- ATF firearm tracings by year: 16,235 in 2022; 13,823 in 2021
- 1-yr. change in population, 2021-2022: -0.7% (-33,806)
- Population-adjusted ATF firearm tracings in 2022: 353.7 per 100,000 people (the highest of 50 states)
- Population-adjusted ATF firearm tracings in 2021: 298.9 per 100,000 people (the highest of 50 states)
11. Connecticut
- 1-yr. change in ATF firearm tracings, 2021-2022: +18.6% (+300)
- ATF firearm tracings by year: 1,917 in 2022; 1,617 in 2021
- 1-yr. change in population, 2021-2022: +0.6% (+20,608)
- Population-adjusted ATF firearm tracings in 2022: 52.9 per 100,000 people (5th lowest of 50 states)
- Population-adjusted ATF firearm tracings in 2021: 44.9 per 100,000 people (4th lowest of 50 states)
10. Virginia

- 1-yr. change in ATF firearm tracings, 2021-2022: +18.7% (+2,281)
- ATF firearm tracings by year: 14,465 in 2022; 12,184 in 2021
- 1-yr. change in population, 2021-2022: +0.5% (+41,345)
- Population-adjusted ATF firearm tracings in 2022: 166.6 per 100,000 people (15th highest of 50 states)
- Population-adjusted ATF firearm tracings in 2021: 141.0 per 100,000 people (21st highest of 50 states)
9. Alabama

- 1-yr. change in ATF firearm tracings, 2021-2022: +18.9% (+1,672)
- ATF firearm tracings by year: 10,519 in 2022; 8,847 in 2021
- 1-yr. change in population, 2021-2022: +0.7% (+34,419)
- Population-adjusted ATF firearm tracings in 2022: 207.3 per 100,000 people (6th highest of 50 states)
- Population-adjusted ATF firearm tracings in 2021: 175.5 per 100,000 people (9th highest of 50 states)
8. Vermont

- 1-yr. change in ATF firearm tracings, 2021-2022: +23.0% (+56)
- ATF firearm tracings by year: 299 in 2022; 243 in 2021
- 1-yr. change in population, 2021-2022: +0.2% (+1,494)
- Population-adjusted ATF firearm tracings in 2022: 46.2 per 100,000 people (2nd lowest of 50 states)
- Population-adjusted ATF firearm tracings in 2021: 37.6 per 100,000 people (3rd lowest of 50 states)
7. Texas

- 1-yr. change in ATF firearm tracings, 2021-2022: +23.8% (+10,848)
- ATF firearm tracings by year: 56,466 in 2022; 45,618 in 2021
- 1-yr. change in population, 2021-2022: +1.7% (+501,631)
- Population-adjusted ATF firearm tracings in 2022: 188.0 per 100,000 people (8th highest of 50 states)
- Population-adjusted ATF firearm tracings in 2021: 154.5 per 100,000 people (16th highest of 50 states)
6. West Virginia

- 1-yr. change in ATF firearm tracings, 2021-2022: +23.9% (+406)
- ATF firearm tracings by year: 2,104 in 2022; 1,698 in 2021
- 1-yr. change in population, 2021-2022: -0.4% (-7,803)
- Population-adjusted ATF firearm tracings in 2022: 118.5 per 100,000 people (22nd lowest of 50 states)
- Population-adjusted ATF firearm tracings in 2021: 95.2 per 100,000 people (17th lowest of 50 states)
5. Iowa

- 1-yr. change in ATF firearm tracings, 2021-2022: +24.1% (+620)
- ATF firearm tracings by year: 3,196 in 2022; 2,576 in 2021
- 1-yr. change in population, 2021-2022: +0.2% (+7,438)
- Population-adjusted ATF firearm tracings in 2022: 99.9 per 100,000 people (13th lowest of 50 states)
- Population-adjusted ATF firearm tracings in 2021: 80.7 per 100,000 people (13th lowest of 50 states)
4. Alaska

- 1-yr. change in ATF firearm tracings, 2021-2022: +50.6% (+403)
- ATF firearm tracings by year: 1,200 in 2022; 797 in 2021
- 1-yr. change in population, 2021-2022: +0.1% (+910)
- Population-adjusted ATF firearm tracings in 2022: 163.6 per 100,000 people (19th highest of 50 states)
- Population-adjusted ATF firearm tracings in 2021: 108.8 per 100,000 people (20th lowest of 50 states)
3. Rhode Island

- 1-yr. change in ATF firearm tracings, 2021-2022: +52.7% (+351)
- ATF firearm tracings by year: 1,017 in 2022; 666 in 2021
- 1-yr. change in population, 2021-2022: -0.2% (-1,876)
- Population-adjusted ATF firearm tracings in 2022: 93.0 per 100,000 people (11th lowest of 50 states)
- Population-adjusted ATF firearm tracings in 2021: 60.8 per 100,000 people (10th lowest of 50 states)
2. Hawaii

- 1-yr. change in ATF firearm tracings, 2021-2022: +149.6% (+172)
- ATF firearm tracings by year: 287 in 2022; 115 in 2021
- 1-yr. change in population, 2021-2022: -0.1% (-1,357)
- Population-adjusted ATF firearm tracings in 2022: 19.9 per 100,000 people (the lowest of 50 states)
- Population-adjusted ATF firearm tracings in 2021: 8.0 per 100,000 people (the lowest of 50 states)
1. Maine

- 1-yr. change in ATF firearm tracings, 2021-2022: +172.5% (+885)
- ATF firearm tracings by year: 1,398 in 2022; 513 in 2021
- 1-yr. change in population, 2021-2022: +1.0% (+13,093)
- Population-adjusted ATF firearm tracings in 2022: 100.9 per 100,000 people (14th lowest of 50 states)
- Population-adjusted ATF firearm tracings in 2021: 37.4 per 100,000 people (2nd lowest of 50 states)
The Average American Has No Idea How Much Money You Can Make Today (Sponsor)
The last few years made people forget how much banks and CD’s can pay. Meanwhile, interest rates have spiked and many can afford to pay you much more, but most are keeping yields low and hoping you won’t notice.
But there is good news. To win qualified customers, some accounts are paying almost 10x the national average! That’s an incredible way to keep your money safe and earn more at the same time. Our top pick for high yield savings accounts includes other benefits as well. You can earn up to 3.80% with a Checking & Savings Account today Sign up and get up to $300 with direct deposit. No account fees. FDIC Insured.
Click here to see how much more you could be earning on your savings today. It takes just a few minutes to open an account to make your money work for you.
Our top pick for high yield savings accounts includes other benefits as well. You can earn up to 4.00% with a Checking & Savings Account from Sofi. Sign up and get up to $300 with direct deposit. No account fees. FDIC Insured.
Thank you for reading! Have some feedback for us?
Contact the 24/7 Wall St. editorial team.
