Special Report
The Number of Murders in North Carolina Every Year Since 1995

Published:
The number of reported homicides in the U.S. surged by a record-breaking 30% in 2020, topping 20,000 for the first time since 1995. When incidents of deadly violence jump, there is rarely only one cause.
Crime rates in the United States are affected by a number of social and economic variables. According to the FBI, these include, but are not limited to, financial security, family cohesiveness, population density, law enforcement efficacy, and public attitudes toward crime. Both at an individual level, and across broad populations, these and other factors can have a meaningful impact on rates of every type of criminal activity — including homicide.
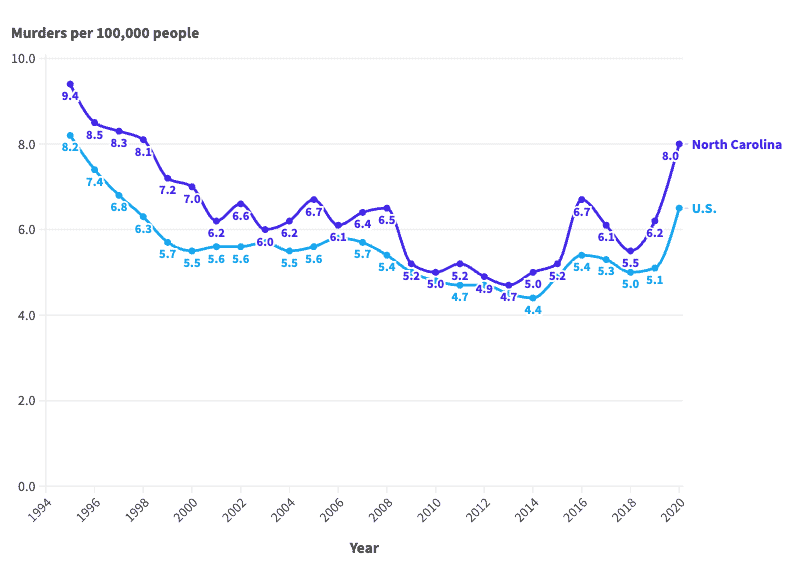
In the 26 years from 1995 to 2020, the number of murders reported annually in the U.S. ranged from about 14,200 to nearly 22,000. Over the same period, the national population adjusted homicide rate varied from 4.4 murders for every 100,000 people, to 8.2 per 100,000.
Similar fluctuations in rates of violence are also evident in North Carolina. Since 1995, North Carolina’s annual murder rate has gone as high as 9.4 homicides per 100,000 people, down to 4.7 per 100,000. Meanwhile, the annual number of murders in the state peaked at 852, and fell as low as 463 over the same 26 year period.
North Carolina’s homicide rate has been higher than the national average every year in the last two and a half decades. However, North Carolina’s murder rate has not ranked in the top 10 among the 50 states since the late 1990s.


| Year | Murders per 100,000 people in North Carolina | Murders per 100,000 people in U.S. | Total murders in North Carolina | Total murders in U.S. |
|---|---|---|---|---|
| 1995 | 9.4 | 8.2 | 677 | 21,606 |
| 1996 | 8.5 | 7.4 | 619 | 19,645 |
| 1997 | 8.3 | 6.8 | 614 | 18,211 |
| 1998 | 8.1 | 6.3 | 612 | 16,974 |
| 1999 | 7.2 | 5.7 | 552 | 15,522 |
| 2000 | 7.0 | 5.5 | 560 | 15,586 |
| 2001 | 6.2 | 5.6 | 505 | 16,037 |
| 2002 | 6.6 | 5.6 | 548 | 16,229 |
| 2003 | 6.0 | 5.7 | 506 | 16,528 |
| 2004 | 6.2 | 5.5 | 532 | 16,148 |
| 2005 | 6.7 | 5.6 | 585 | 16,740 |
| 2006 | 6.1 | 5.8 | 539 | 17,309 |
| 2007 | 6.4 | 5.7 | 584 | 17,128 |
| 2008 | 6.5 | 5.4 | 599 | 16,465 |
| 2009 | 5.2 | 5.0 | 489 | 15,399 |
| 2010 | 5.0 | 4.8 | 474 | 14,722 |
| 2011 | 5.2 | 4.7 | 498 | 14,661 |
| 2012 | 4.9 | 4.7 | 479 | 14,856 |
| 2013 | 4.7 | 4.5 | 463 | 14,319 |
| 2014 | 5.0 | 4.4 | 498 | 14,164 |
| 2015 | 5.2 | 4.9 | 517 | 15,883 |
| 2016 | 6.7 | 5.4 | 678 | 17,413 |
| 2017 | 6.1 | 5.3 | 622 | 17,294 |
| 2018 | 5.5 | 5.0 | 574 | 16,374 |
| 2019 | 6.2 | 5.1 | 653 | 16,669 |
| 2020 | 8.0 | 6.5 | 852 | 21,570 |
Retirement planning doesn’t have to feel overwhelming. The key is finding expert guidance—and SmartAsset’s simple quiz makes it easier than ever for you to connect with a vetted financial advisor.
Here’s how it works:
Why wait? Start building the retirement you’ve always dreamed of. Click here to get started today!
Thank you for reading! Have some feedback for us?
Contact the 24/7 Wall St. editorial team.


Our expert who first called NVIDIA in 2009 is predicting 2025 will see a historic AI breakthrough.
You can follow him investing $500,000 of his own money on our top AI stocks for free.