Special Report
The Number of Homicides in New Jersey Every Year Since 1995

Published:
The number of reported homicides in the U.S. surged by a record-breaking 30% in 2020, topping 20,000 for the first time since 1995. When incidents of deadly violence jump, there is rarely only one cause.
Crime rates in the United States are affected by a number of social and economic variables. According to the FBI, these include, but are not limited to, financial security, family cohesiveness, population density, law enforcement efficacy, and public attitudes toward crime. Both at an individual level, and across broad populations, these and other factors can have a meaningful impact on rates of every type of criminal activity — including homicide.
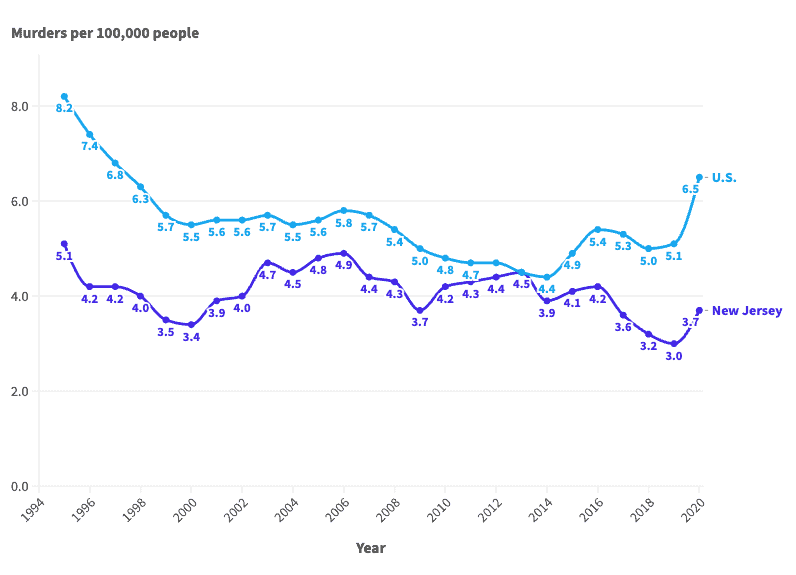
In the 26 years from 1995 to 2020, the number of murders reported annually in the U.S. ranged from about 14,200 to nearly 22,000. Over the same period, the national population adjusted homicide rate varied from 4.4 murders for every 100,000 people, to 8.2 per 100,000.
Similar fluctuations in rates of violence are also evident in New Jersey. Since 1995, New Jersey’s annual murder rate has gone as high as 5.1 homicides per 100,000 people, down to 3.0 per 100,000. Meanwhile, the annual number of murders in the state peaked at 427, and fell as low as 263 over the same 26 year period.
New Jersey’s homicide rate has been lower than that of most other states for much of the last two and a half decades. However, for several years in the mid 2000s and early 2010s, the population adjusted murder rate in New Jersey ranked among the 25 highest of the 50 states.


| Year | Murders per 100,000 people in New Jersey | Murders per 100,000 people in U.S. | Total murders in New Jersey | Total murders in U.S. |
|---|---|---|---|---|
| 1995 | 5.1 | 8.2 | 409 | 21,606 |
| 1996 | 4.2 | 7.4 | 338 | 19,645 |
| 1997 | 4.2 | 6.8 | 337 | 18,211 |
| 1998 | 4.0 | 6.3 | 325 | 16,974 |
| 1999 | 3.5 | 5.7 | 287 | 15,522 |
| 2000 | 3.4 | 5.5 | 289 | 15,586 |
| 2001 | 3.9 | 5.6 | 336 | 16,037 |
| 2002 | 4.0 | 5.6 | 339 | 16,229 |
| 2003 | 4.7 | 5.7 | 406 | 16,528 |
| 2004 | 4.5 | 5.5 | 392 | 16,148 |
| 2005 | 4.8 | 5.6 | 417 | 16,740 |
| 2006 | 4.9 | 5.8 | 427 | 17,309 |
| 2007 | 4.4 | 5.7 | 381 | 17,128 |
| 2008 | 4.3 | 5.4 | 376 | 16,465 |
| 2009 | 3.7 | 5.0 | 319 | 15,399 |
| 2010 | 4.2 | 4.8 | 371 | 14,722 |
| 2011 | 4.3 | 4.7 | 380 | 14,661 |
| 2012 | 4.4 | 4.7 | 388 | 14,856 |
| 2013 | 4.5 | 4.5 | 404 | 14,319 |
| 2014 | 3.9 | 4.4 | 352 | 14,164 |
| 2015 | 4.1 | 4.9 | 363 | 15,883 |
| 2016 | 4.2 | 5.4 | 378 | 17,413 |
| 2017 | 3.6 | 5.3 | 324 | 17,294 |
| 2018 | 3.2 | 5.0 | 285 | 16,374 |
| 2019 | 3.0 | 5.1 | 263 | 16,669 |
| 2020 | 3.7 | 6.5 | 329 | 21,570 |
After two decades of reviewing financial products I haven’t seen anything like this. Credit card companies are at war, handing out free rewards and benefits to win the best customers.
A good cash back card can be worth thousands of dollars a year in free money, not to mention other perks like travel, insurance, and access to fancy lounges.
Our top pick today pays up to 5% cash back, a $200 bonus on top, and $0 annual fee. Click here to apply before they stop offering rewards this generous.
Flywheel Publishing has partnered with CardRatings for our coverage of credit card products. Flywheel Publishing and CardRatings may receive a commission from card issuers.
Thank you for reading! Have some feedback for us?
Contact the 24/7 Wall St. editorial team.


Our expert who first called NVIDIA in 2009 is predicting 2025 will see a historic AI breakthrough.
You can follow him investing $500,000 of his own money on our top AI stocks for free.