Special Report

California's Crime Rate Has Been Worse Than Average For Decades

pavelscapture / Flickr

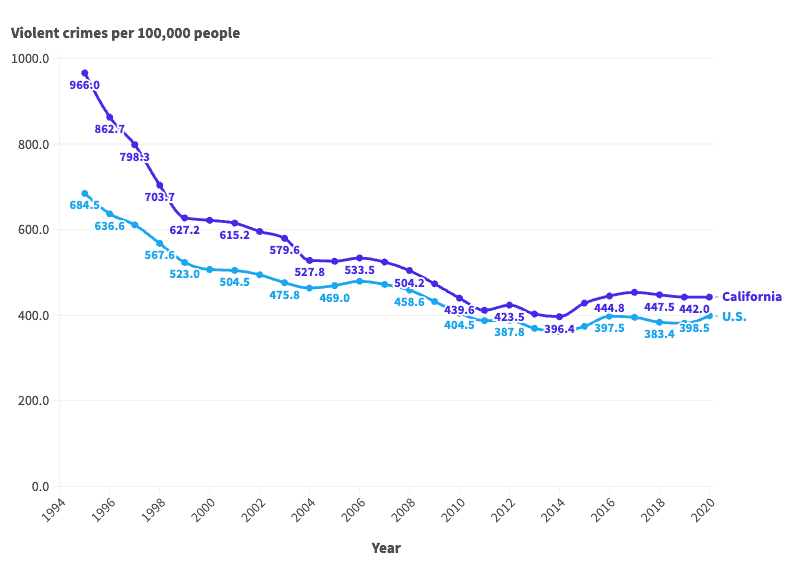
Violent crime has been trending downward in the United States for decades. According to the FBI, the U.S. violent crime rate — a population-adjusted measure that includes incidents of robbery, homicide, and aggravated assault — fell by nearly 90% between the mid-1990s and mid-2010s. Though a historic surge in homicides helped drive the violent crime rate up in 2020, the U.S. remains far safer than it was at any point in the 1990s.

Over the 26 year period of comprehensive FBI data, beginning in 1995 and going through 2020, the number of violent crimes reported annually in the U.S. ranged from about 1.8 million, down to less than 1.2 million. Over the same period, the violent crime rate peaked at 684 incidents for every 100,000 people in 1995, and hit a multi-decade low of 362 per 100,000 in 2014.

The FBI also tracks violent crime rates at the state level, and in California, criminal violence tends to be more concentrated than it is nationwide. Every year between 1995 and 2020, the violent crime rate in California exceeded the national rate, often by a wide margin.

Still, like the U.S. as a whole, California is much safer now than it was in the 1990s. As of 2020, California’s violent crime rate was 46% lower than it was in 1995.

While some factors that led to the reduction of criminal violence remain unknown, experts have identified several likely underlying causes. According to a report from the Brennan Center for Justice, a non-profit policy institute, these include an aging population, declining alcohol use, increased policing and incarceration, and several economic conditions related to inflation, unemployment, and consumer confidence.

While homicide is the most serious violent offense in the FBI’s hierarchy of violent offenses, it is also the least common. In the last 26 years, homicides have never accounted for more than 1.3% of all violent crimes reported in California. In contrast, aggravated assault has accounted for over half of all violent offenses reported in California every year.

1995: 966.0 violent crimes per 100,000 people

DianeBentleyRaymond / iStock via Getty Images
  • California’s violent crime rate in 1995: 966.0 per 100,000 people (6th highest among the 50 states)
  • U.S. violent crime rate in 1995: 684.5 per 100,000 people
  • Total violent crimes reported in California in 1995: 305,154
  • Total violent crimes reported in U.S. in 1995: 1,798,792

1996: 862.7 violent crimes per 100,000 people

bluejayphoto / iStock via Getty Images
  • California’s violent crime rate in 1996: 862.7 per 100,000 people (6th highest among the 50 states)
  • U.S. violent crime rate in 1996: 636.6 per 100,000 people
  • Total violent crimes reported in California in 1996: 274,996
  • Total violent crimes reported in U.S. in 1996: 1,688,540

1997: 798.3 violent crimes per 100,000 people

f11photo / iStock via Getty Images
  • California’s violent crime rate in 1997: 798.3 per 100,000 people (8th highest among the 50 states)
  • U.S. violent crime rate in 1997: 611.0 per 100,000 people
  • Total violent crimes reported in California in 1997: 257,582
  • Total violent crimes reported in U.S. in 1997: 1,636,099

1998: 703.7 violent crimes per 100,000 people

f1monaco31 / Getty Images
  • California’s violent crime rate in 1998: 703.7 per 100,000 people (9th highest among the 50 states)
  • U.S. violent crime rate in 1998: 567.6 per 100,000 people
  • Total violent crimes reported in California in 1998: 229,883
  • Total violent crimes reported in U.S. in 1998: 1,533,887

1999: 627.2 violent crimes per 100,000 people

MattGush / iStock via Getty Images
  • California’s violent crime rate in 1999: 627.2 per 100,000 people (10th highest among the 50 states)
  • U.S. violent crime rate in 1999: 523.0 per 100,000 people
  • Total violent crimes reported in California in 1999: 207,879
  • Total violent crimes reported in U.S. in 1999: 1,426,044

2000: 621.6 violent crimes per 100,000 people

Davel5957 / iStock via Getty Images
  • California’s violent crime rate in 2000: 621.6 per 100,000 people (9th highest among the 50 states)
  • U.S. violent crime rate in 2000: 506.5 per 100,000 people
  • Total violent crimes reported in California in 2000: 210,531
  • Total violent crimes reported in U.S. in 2000: 1,425,486

2001: 615.2 violent crimes per 100,000 people

ivanastar / iStock Unreleased via Getty Images
  • California’s violent crime rate in 2001: 615.2 per 100,000 people (8th highest among the 50 states)
  • U.S. violent crime rate in 2001: 504.5 per 100,000 people
  • Total violent crimes reported in California in 2001: 212,867
  • Total violent crimes reported in U.S. in 2001: 1,439,480

2002: 595.4 violent crimes per 100,000 people

Ken Levine / Getty Images
  • California’s violent crime rate in 2002: 595.4 per 100,000 people (10th highest among the 50 states)
  • U.S. violent crime rate in 2002: 494.4 per 100,000 people
  • Total violent crimes reported in California in 2002: 208,388
  • Total violent crimes reported in U.S. in 2002: 1,423,677

2003: 579.6 violent crimes per 100,000 people

DianeBentleyRaymond / iStock via Getty Images
  • California’s violent crime rate in 2003: 579.6 per 100,000 people (10th highest among the 50 states)
  • U.S. violent crime rate in 2003: 475.8 per 100,000 people
  • Total violent crimes reported in California in 2003: 205,551
  • Total violent crimes reported in U.S. in 2003: 1,383,676

2004: 527.8 violent crimes per 100,000 people

bluejayphoto / iStock via Getty Images
  • California’s violent crime rate in 2004: 527.8 per 100,000 people (12th highest among the 50 states)
  • U.S. violent crime rate in 2004: 463.2 per 100,000 people
  • Total violent crimes reported in California in 2004: 189,175
  • Total violent crimes reported in U.S. in 2004: 1,360,088

2005: 526.0 violent crimes per 100,000 people

f11photo / iStock via Getty Images
  • California’s violent crime rate in 2005: 526.0 per 100,000 people (14th highest among the 50 states)
  • U.S. violent crime rate in 2005: 469.0 per 100,000 people
  • Total violent crimes reported in California in 2005: 190,178
  • Total violent crimes reported in U.S. in 2005: 1,390,745

2006: 533.5 violent crimes per 100,000 people

f1monaco31 / Getty Images
  • California’s violent crime rate in 2006: 533.5 per 100,000 people (15th highest among the 50 states)
  • U.S. violent crime rate in 2006: 479.3 per 100,000 people
  • Total violent crimes reported in California in 2006: 194,483
  • Total violent crimes reported in U.S. in 2006: 1,435,123

2007: 524.1 violent crimes per 100,000 people

MattGush / iStock via Getty Images
  • California’s violent crime rate in 2007: 524.1 per 100,000 people (14th highest among the 50 states)
  • U.S. violent crime rate in 2007: 471.8 per 100,000 people
  • Total violent crimes reported in California in 2007: 191,561
  • Total violent crimes reported in U.S. in 2007: 1,422,970

2008: 504.2 violent crimes per 100,000 people

Davel5957 / iStock via Getty Images
  • California’s violent crime rate in 2008: 504.2 per 100,000 people (15th highest among the 50 states)
  • U.S. violent crime rate in 2008: 458.6 per 100,000 people
  • Total violent crimes reported in California in 2008: 185,329
  • Total violent crimes reported in U.S. in 2008: 1,394,461

2009: 473.3 violent crimes per 100,000 people

ivanastar / iStock Unreleased via Getty Images
  • California’s violent crime rate in 2009: 473.3 per 100,000 people (16th highest among the 50 states)
  • U.S. violent crime rate in 2009: 431.9 per 100,000 people
  • Total violent crimes reported in California in 2009: 174,934
  • Total violent crimes reported in U.S. in 2009: 1,325,896

2010: 439.6 violent crimes per 100,000 people

Ken Levine / Getty Images
  • California’s violent crime rate in 2010: 439.6 per 100,000 people (17th highest among the 50 states)
  • U.S. violent crime rate in 2010: 404.5 per 100,000 people
  • Total violent crimes reported in California in 2010: 164,133
  • Total violent crimes reported in U.S. in 2010: 1,251,248

2011: 411.2 violent crimes per 100,000 people

DianeBentleyRaymond / iStock via Getty Images
  • California’s violent crime rate in 2011: 411.2 per 100,000 people (18th highest among the 50 states)
  • U.S. violent crime rate in 2011: 387.1 per 100,000 people
  • Total violent crimes reported in California in 2011: 154,943
  • Total violent crimes reported in U.S. in 2011: 1,206,031

2012: 423.5 violent crimes per 100,000 people

bluejayphoto / iStock via Getty Images
  • California’s violent crime rate in 2012: 423.5 per 100,000 people (16th highest among the 50 states)
  • U.S. violent crime rate in 2012: 387.8 per 100,000 people
  • Total violent crimes reported in California in 2012: 160,944
  • Total violent crimes reported in U.S. in 2012: 1,217,057

2013: 402.6 violent crimes per 100,000 people

f11photo / iStock via Getty Images
  • California’s violent crime rate in 2013: 402.6 per 100,000 people (19th highest among the 50 states)
  • U.S. violent crime rate in 2013: 369.1 per 100,000 people
  • Total violent crimes reported in California in 2013: 154,739
  • Total violent crimes reported in U.S. in 2013: 1,168,298

2014: 396.4 violent crimes per 100,000 people

f1monaco31 / Getty Images
  • California’s violent crime rate in 2014: 396.4 per 100,000 people (16th highest among the 50 states)
  • U.S. violent crime rate in 2014: 361.6 per 100,000 people
  • Total violent crimes reported in California in 2014: 153,763
  • Total violent crimes reported in U.S. in 2014: 1,153,022

2015: 428.0 violent crimes per 100,000 people

MattGush / iStock via Getty Images
  • California’s violent crime rate in 2015: 428.0 per 100,000 people (14th highest among the 50 states)
  • U.S. violent crime rate in 2015: 373.7 per 100,000 people
  • Total violent crimes reported in California in 2015: 166,883
  • Total violent crimes reported in U.S. in 2015: 1,199,310

2016: 444.8 violent crimes per 100,000 people

Davel5957 / iStock via Getty Images
  • California’s violent crime rate in 2016: 444.8 per 100,000 people (15th highest among the 50 states)
  • U.S. violent crime rate in 2016: 397.5 per 100,000 people
  • Total violent crimes reported in California in 2016: 174,796
  • Total violent crimes reported in U.S. in 2016: 1,285,606

2017: 453.3 violent crimes per 100,000 people

ivanastar / iStock Unreleased via Getty Images
  • California’s violent crime rate in 2017: 453.3 per 100,000 people (14th highest among the 50 states)
  • U.S. violent crime rate in 2017: 394.9 per 100,000 people
  • Total violent crimes reported in California in 2017: 178,597
  • Total violent crimes reported in U.S. in 2017: 1,283,875

2018: 447.5 violent crimes per 100,000 people

Ken Levine / Getty Images
  • California’s violent crime rate in 2018: 447.5 per 100,000 people (14th highest among the 50 states)
  • U.S. violent crime rate in 2018: 383.4 per 100,000 people
  • Total violent crimes reported in California in 2018: 176,604
  • Total violent crimes reported in U.S. in 2018: 1,252,399

2019: 442.1 violent crimes per 100,000 people

DianeBentleyRaymond / iStock via Getty Images
  • California’s violent crime rate in 2019: 442.1 per 100,000 people (12th highest among the 50 states)
  • U.S. violent crime rate in 2019: 380.8 per 100,000 people
  • Total violent crimes reported in California in 2019: 174,341
  • Total violent crimes reported in U.S. in 2019: 1,250,393

2020: 442.0 violent crimes per 100,000 people

bluejayphoto / iStock via Getty Images
  • California’s violent crime rate in 2020: 442.0 per 100,000 people (16th highest among the 50 states)
  • U.S. violent crime rate in 2020: 398.5 per 100,000 people
  • Total violent crimes reported in California in 2020: 174,026
  • Total violent crimes reported in U.S. in 2020: 1,313,105

Courtesy of: 24/7 Wall St.


Year Violent crimes per 100,000 people in California Violent crimes per 100,000 people in U.S. Total violent crimes in California Total violent crimes in U.S.
1995 966.0 684.5 305,154 1,798,792
1996 862.7 636.6 274,996 1,688,540
1997 798.3 611.0 257,582 1,636,099
1998 703.7 567.6 229,883 1,533,887
1999 627.2 523.0 207,879 1,426,044
2000 621.6 506.5 210,531 1,425,486
2001 615.2 504.5 212,867 1,439,480
2002 595.4 494.4 208,388 1,423,677
2003 579.6 475.8 205,551 1,383,676
2004 527.8 463.2 189,175 1,360,088
2005 526.0 469.0 190,178 1,390,745
2006 533.5 479.3 194,483 1,435,123
2007 524.1 471.8 191,561 1,422,970
2008 504.2 458.6 185,329 1,394,461
2009 473.3 431.9 174,934 1,325,896
2010 439.6 404.5 164,133 1,251,248
2011 411.2 387.1 154,943 1,206,031
2012 423.5 387.8 160,944 1,217,057
2013 402.6 369.1 154,739 1,168,298
2014 396.4 361.6 153,763 1,153,022
2015 428.0 373.7 166,883 1,199,310
2016 444.8 397.5 174,796 1,285,606
2017 453.3 394.9 178,597 1,283,875
2018 447.5 383.4 176,604 1,252,399
2019 442.1 380.8 174,341 1,250,393
2020 442.0 398.5 174,026 1,313,105

Essential Tips for Investing (Sponsored)

A financial advisor can help you understand the advantages and disadvantages of investment properties. Finding a qualified financial advisor doesn’t have to be hard. SmartAsset’s free tool matches you with up to three financial advisors who serve your area, and you can interview your advisor matches at no cost to decide which one is right for you. If you’re ready to find an advisor who can help you achieve your financial goals, get started now.

Investing in real estate can diversify your portfolio. But expanding your horizons may add additional costs. If you’re an investor looking to minimize expenses, consider checking out online brokerages. They often offer low investment fees, helping you maximize your profit.

Thank you for reading! Have some feedback for us?
Contact the 24/7 Wall St. editorial team.