The income gap has been increasingly growing between the top wage earners and those who make significantly less. Wealth is progressively concentrated among the highest earners and with a steep reduction of well-paying jobs that do not require a college degree, the ranks of the American middle class have been wearing away for decades. Though the consumer price index has cooled recently, two years of relentless inflation has further squeezed the middle class.
According to the United States Census Bureau, the real median household income in the U.S. — which accounts for the cost of living — fell by 2.3% from 2021 to 2022, going from $76,330 to $74,580. As a result, many middle-class households are struggling to afford basic necessities. The U.S. Census Bureau’s recent survey illustrates that 72% of households earning between $50,000 and $99,999 a year reported at least some difficulty paying for usual household expenses in the last week, compared to 63% of all U.S. households.
The socioeconomic group that falls between the working class and the upper class, although there is no strict definition, is the American middle class who typically are those that earn between two-thirds and twice the median American household income. Middle-class households generally have some disposable income for certain luxuries like vacations and eating at restaurants and can put away money for savings and retirement. However, in much of the country, households that fall in the middle of the income spectrum may no longer meet some of these established benchmarks of middle-class status. (Here is a look at the poorest city in every state.)
24/7 Wall St. identified the city in each state with the poorest middle class using area data from the U.S. Census Bureau’s 2022 American Community Survey. We reviewed the average income among the middle 20% of households by earnings in each of the 384 U.S. metro areas with available data. In each state, the metro area with the lowest average income among the middle quintile of earners ranks as having the poorest middle class.
It should be noted that there is only one metro area in four states — Delaware, New Hampshire, Rhode Island, and Vermont. As a result, the city listed for each of these states ranks as having the poorest middle class by default only. All but four of the 50 metro areas on this list have a poorer middle class than the state as a whole. In most of these cities, the average middle-class household earns at least $10,000 less per year than the average for the middle class statewide.
Today, the vast majority of well-paying jobs in the U.S. require a college education, unlike previous decades. In all but six metro areas on this list with available data, the share of adults with at least a bachelor’s degree is below the share of adults with a bachelor’s degree across the state as a whole. (Here is a look at the colleges with the most upward mobility.)
Here is the city in each state with the poorest middle class.
Alabama: Anniston-Oxford
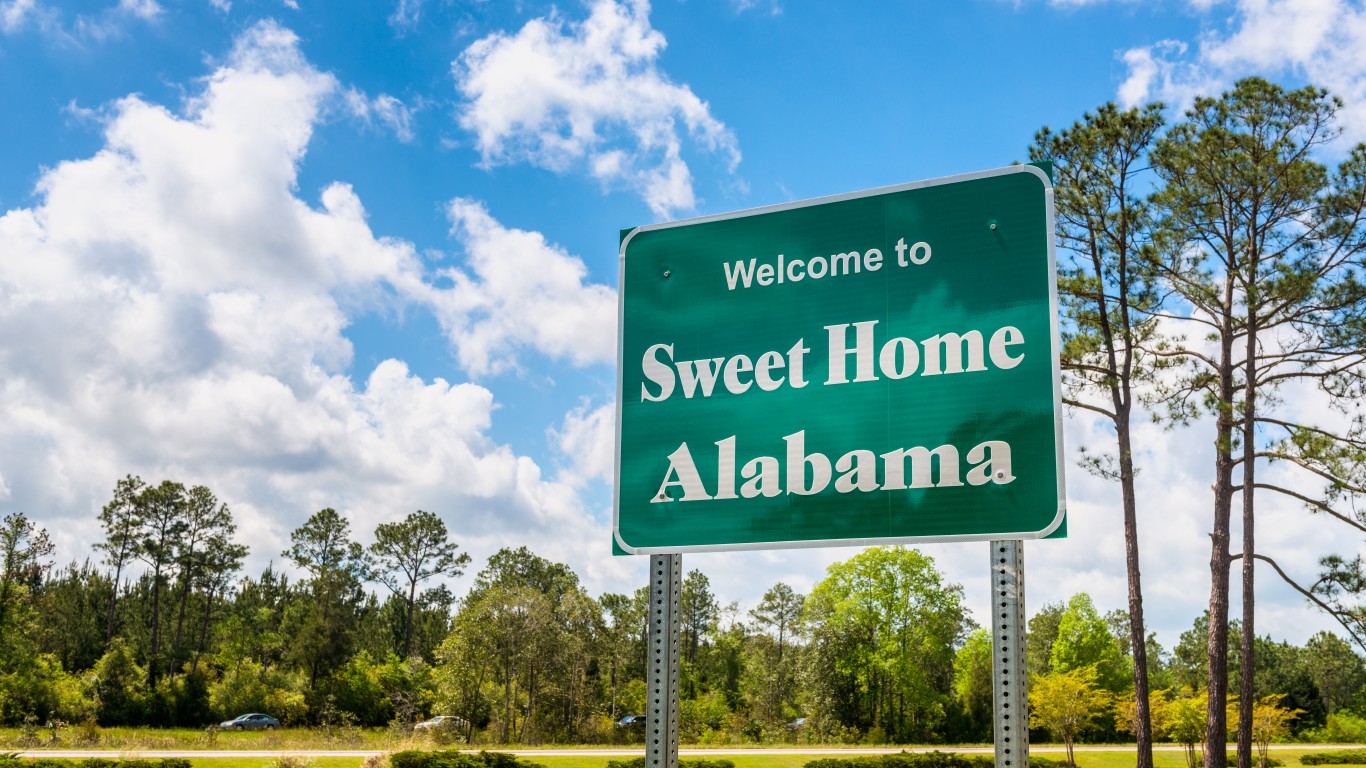
- Avg. household income among middle 20% of earners: $51,947 (Alabama: $60,096)
- Middle-income range: $40,807 – $64,348 (Alabama: $46,221 – $75,810)
- Median income among all households: $52,819 (Alabama: $59,674)
- Adults with a bachelor’s degree or higher: 21.1% (Alabama: 28.8%)
- Metro areas considered in state: 12
Alaska: Fairbanks

- Avg. household income among middle 20% of earners: $83,132 (Alaska: $88,660)
- Middle-income range: $67,387 – $101,414 (Alaska: $70,740 – $106,786)
- Median income among all households: $83,519 (Alaska: $88,121)
- Adults with a bachelor’s degree or higher: N/A% (Alaska: 30.6%)
- Metro areas considered in state: 2
Arizona: Yuma

- Avg. household income among middle 20% of earners: $54,680 (Arizona: $74,923)
- Middle-income range: $43,894 – $66,198 (Arizona: $59,413 – $92,087)
- Median income among all households: $53,994 (Arizona: $74,568)
- Adults with a bachelor’s degree or higher: 16.6% (Arizona: 33.0%)
- Metro areas considered in state: 7
Arkansas: Pine Bluff

- Avg. household income among middle 20% of earners: $44,319 (Arkansas: $55,886)
- Middle-income range: $34,082 – $57,693 (Arkansas: $43,623 – $69,297)
- Median income among all households: $44,263 (Arkansas: $55,432)
- Adults with a bachelor’s degree or higher: 19.1% (Arkansas: 25.4%)
- Metro areas considered in state: 6
California: El Centro
- Avg. household income among middle 20% of earners: $56,788 (California: $92,068)
- Middle-income range: $43,556 – $70,411 (California: $71,848 – $114,669)
- Median income among all households: $57,310 (California: $91,551)
- Adults with a bachelor’s degree or higher: 16.8% (California: 37.0%)
- Metro areas considered in state: 26
Colorado: Pueblo

- Avg. household income among middle 20% of earners: $59,288 (Colorado: $89,472)
- Middle-income range: $47,506 – $72,682 (Colorado: $71,401 – $108,616)
- Median income among all households: $58,723 (Colorado: $89,302)
- Adults with a bachelor’s degree or higher: 23.8% (Colorado: 45.9%)
- Metro areas considered in state: 7
Connecticut: New Haven-Milford

- Avg. household income among middle 20% of earners: $82,146 (Connecticut: $89,379)
- Middle-income range: $62,877 – $102,968 (Connecticut: $69,974 – $110,671)
- Median income among all households: $81,998 (Connecticut: $88,429)
- Adults with a bachelor’s degree or higher: 36.8% (Connecticut: 41.9%)
- Metro areas considered in state: 4
Delaware: Dover

- Avg. household income among middle 20% of earners: $73,146 (Delaware: $82,402)
- Middle-income range: $59,669 – $87,131 (Delaware: $65,333 – $100,380)
- Median income among all households: $72,675 (Delaware: $82,174)
- Adults with a bachelor’s degree or higher: 25.3% (Delaware: 36.5%)
- Metro areas considered in state: 1
Florida: Homosassa Springs

- Avg. household income among middle 20% of earners: $51,453 (Florida: $69,655)
- Middle-income range: $40,920 – $62,305 (Florida: $54,733 – $86,103)
- Median income among all households: $51,532 (Florida: $69,303)
- Adults with a bachelor’s degree or higher: 19.4% (Florida: 34.3%)
- Metro areas considered in state: 22
Georgia: Albany
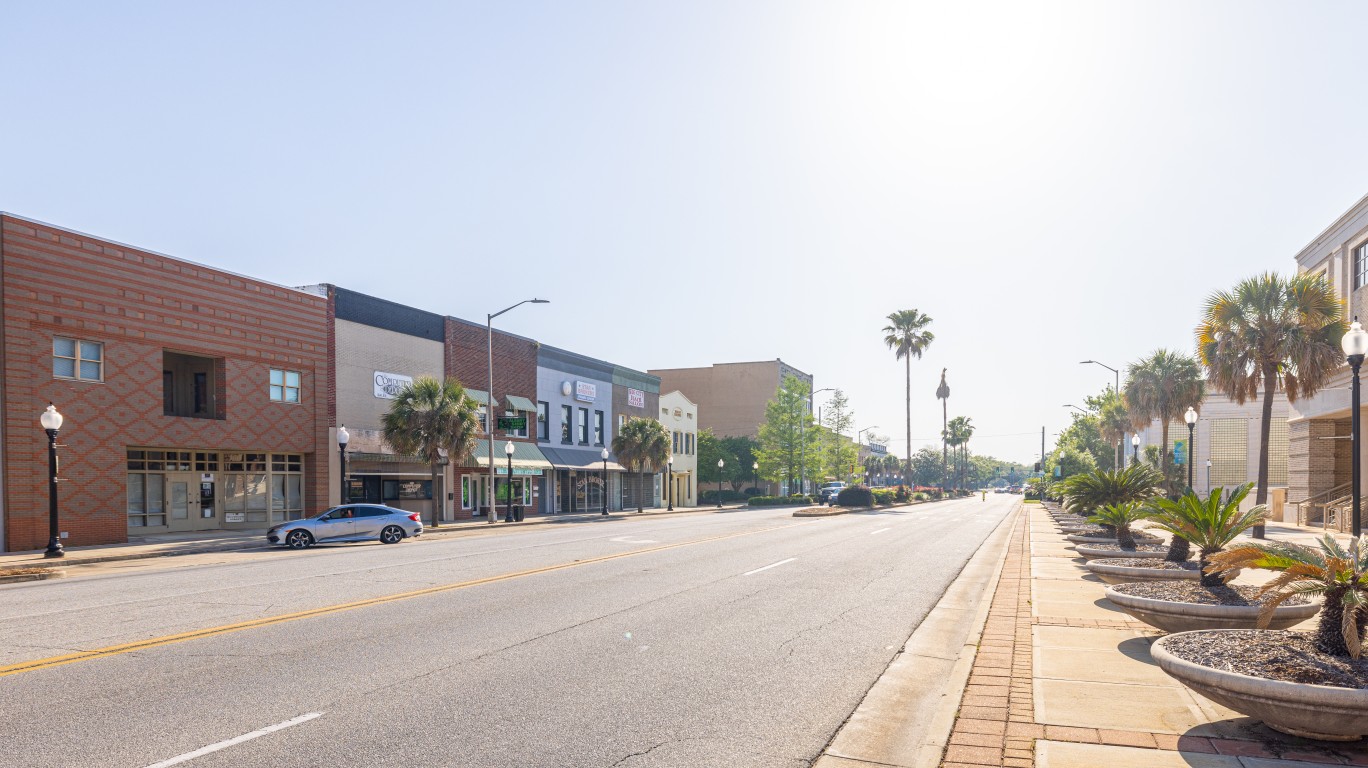
- Avg. household income among middle 20% of earners: $49,188 (Georgia: $73,022)
- Middle-income range: $37,119 – $62,632 (Georgia: $57,501 – $90,252)
- Median income among all households: $48,376 (Georgia: $72,837)
- Adults with a bachelor’s degree or higher: 22.0% (Georgia: 34.7%)
- Metro areas considered in state: 14
Hawaii: Kahului-Wailuku-Lahaina

- Avg. household income among middle 20% of earners: $96,161 (Hawaii: $92,546)
- Middle-income range: $78,443 – $114,903 (Hawaii: $72,639 – $112,336)
- Median income among all households: $94,760 (Hawaii: $92,458)
- Adults with a bachelor’s degree or higher: 29.0% (Hawaii: 35.4%)
- Metro areas considered in state: 2
Idaho: Pocatello

- Avg. household income among middle 20% of earners: $62,525 (Idaho: $72,449)
- Middle-income range: $47,845 – $76,305 (Idaho: $57,929 – $87,185)
- Median income among all households: $61,566 (Idaho: $72,785)
- Adults with a bachelor’s degree or higher: 29.0% (Idaho: 32.3%)
- Metro areas considered in state: 6
Illinois: Danville
- Avg. household income among middle 20% of earners: $51,935 (Illinois: $77,144)
- Middle-income range: $42,854 – $64,800 (Illinois: $60,436 – $95,801)
- Median income among all households: $51,515 (Illinois: $76,708)
- Adults with a bachelor’s degree or higher: 15.5% (Illinois: 37.7%)
- Metro areas considered in state: 10
Indiana: Muncie

- Avg. household income among middle 20% of earners: $54,578 (Indiana: $67,195)
- Middle-income range: $42,081 – $68,218 (Indiana: $52,940 – $82,716)
- Median income among all households: $54,087 (Indiana: $66,785)
- Adults with a bachelor’s degree or higher: 26.7% (Indiana: 29.6%)
- Metro areas considered in state: 12
Iowa: Waterloo-Cedar Falls

- Avg. household income among middle 20% of earners: $64,455 (Iowa: $69,999)
- Middle-income range: $51,036 – $77,704 (Iowa: $55,720 – $85,464)
- Median income among all households: $65,061 (Iowa: $69,588)
- Adults with a bachelor’s degree or higher: 32.1% (Iowa: 32.3%)
- Metro areas considered in state: 8
Kansas: Manhattan
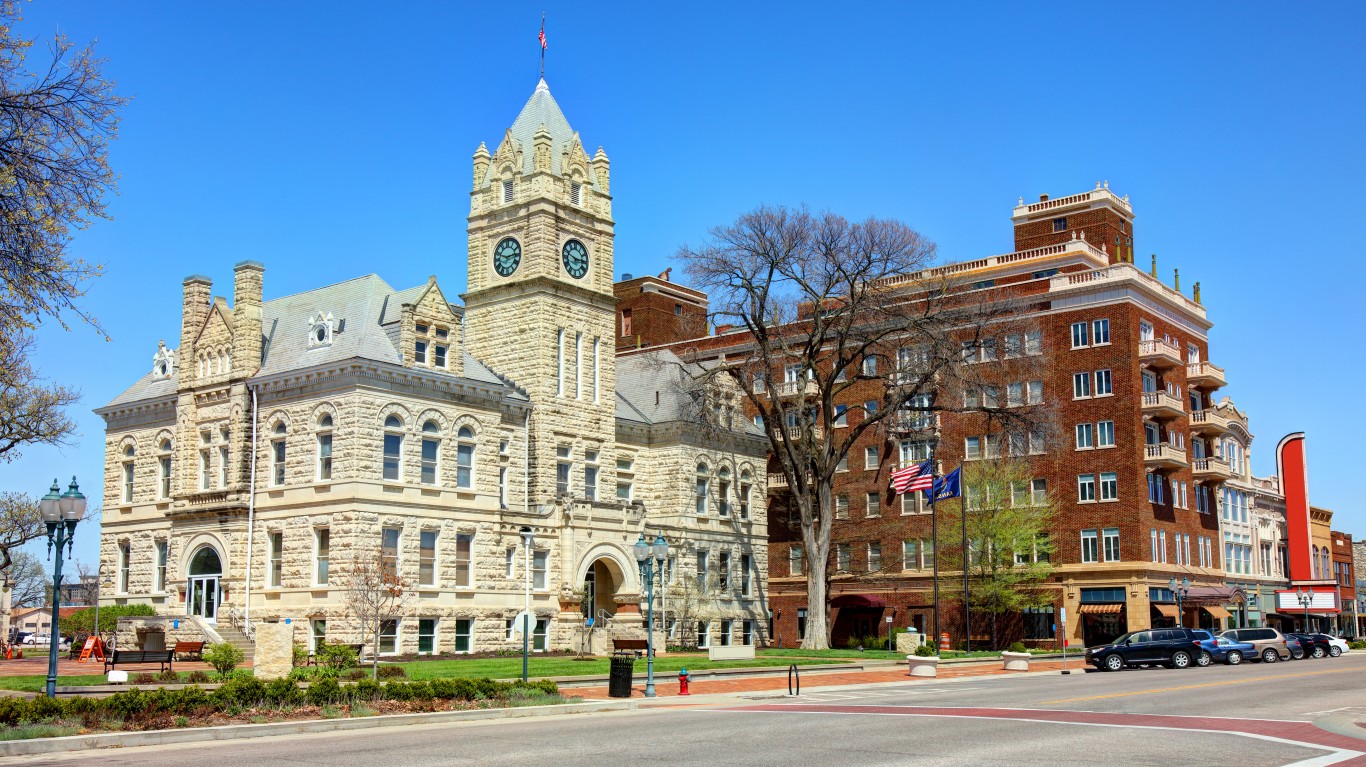
- Avg. household income among middle 20% of earners: $59,963 (Kansas: $69,149)
- Middle-income range: $49,024 – $72,604 (Kansas: $54,481 – $85,353)
- Median income among all households: $58,723 (Kansas: $68,925)
- Adults with a bachelor’s degree or higher: 38.3% (Kansas: 35.6%)
- Metro areas considered in state: 4
Kentucky: Bowling Green
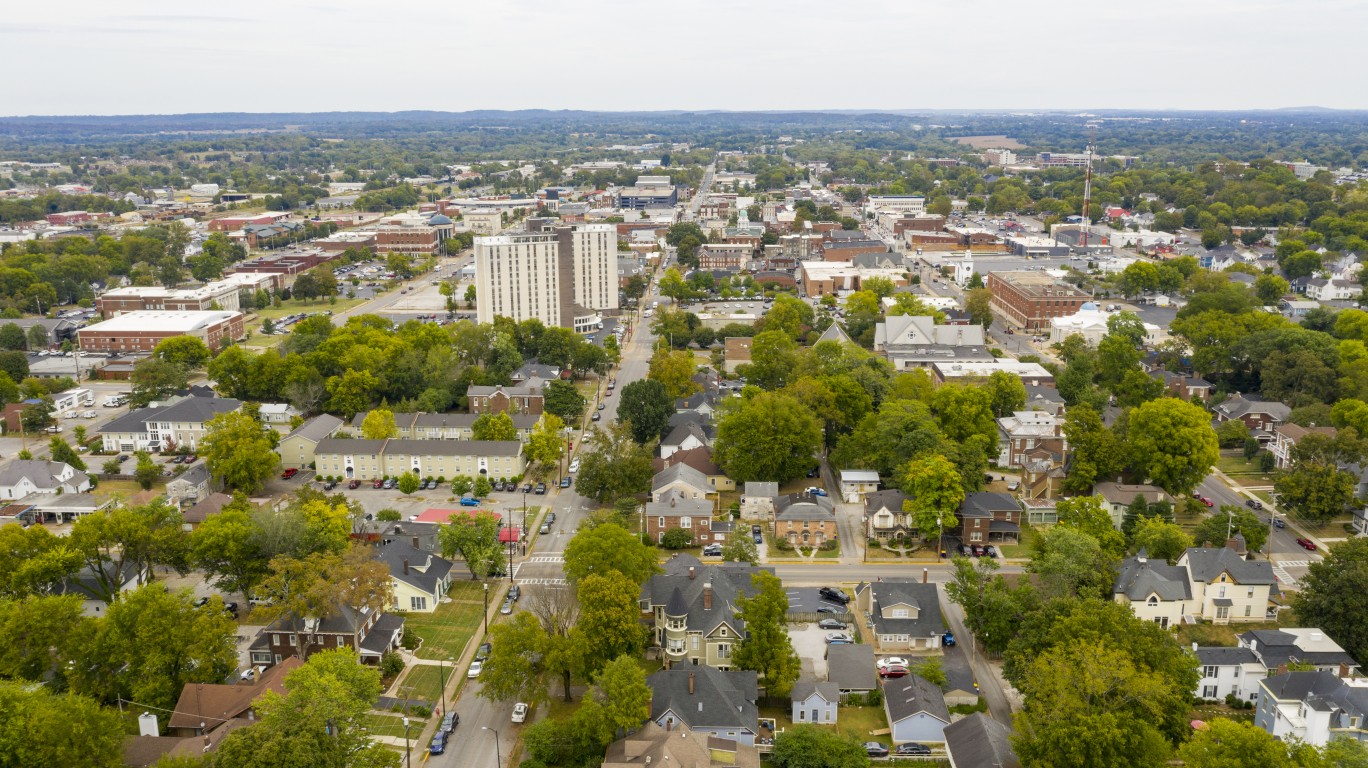
- Avg. household income among middle 20% of earners: $59,554 (Kentucky: $59,612)
- Middle-income range: $46,819 – $72,973 (Kentucky: $46,152 – $74,488)
- Median income among all households: $59,629 (Kentucky: $59,341)
- Adults with a bachelor’s degree or higher: 27.5% (Kentucky: 27.9%)
- Metro areas considered in state: 5
Louisiana: Monroe
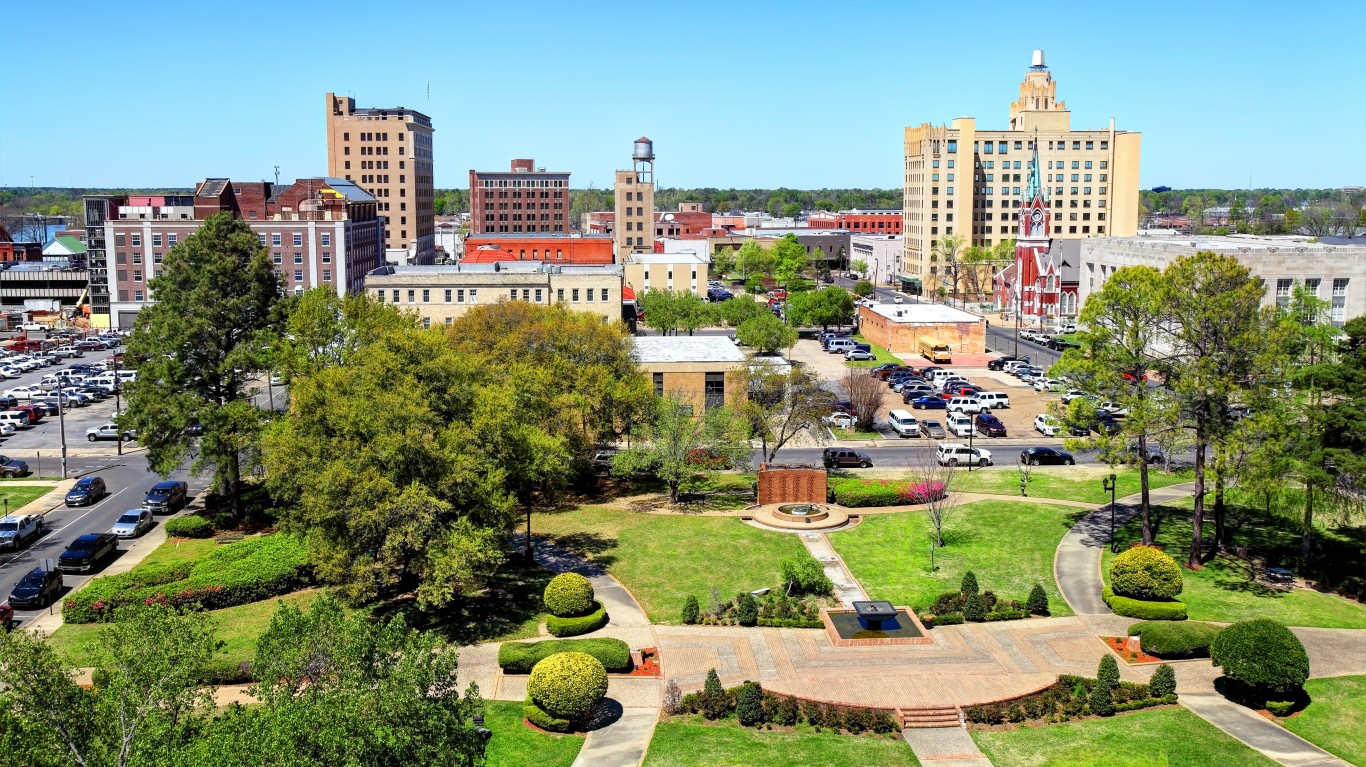
- Avg. household income among middle 20% of earners: $44,531 (Louisiana: $56,007)
- Middle-income range: $33,341 – $59,692 (Louisiana: $42,829 – $71,364)
- Median income among all households: $44,507 (Louisiana: $55,416)
- Adults with a bachelor’s degree or higher: 25.3% (Louisiana: 27.1%)
- Metro areas considered in state: 9
Maine: Bangor

- Avg. household income among middle 20% of earners: $61,163 (Maine: $69,962)
- Middle-income range: $47,314 – $76,833 (Maine: $55,291 – $86,020)
- Median income among all households: $61,134 (Maine: $69,543)
- Adults with a bachelor’s degree or higher: 27.5% (Maine: 36.1%)
- Metro areas considered in state: 3
Maryland: Cumberland

- Avg. household income among middle 20% of earners: $54,045 (Maryland: $95,560)
- Middle-income range: $37,630 – $67,152 (Maryland: $75,460 – $117,911)
- Median income among all households: $54,618 (Maryland: $94,991)
- Adults with a bachelor’s degree or higher: 24.7% (Maryland: 43.8%)
- Metro areas considered in state: 5
Massachusetts: Springfield

- Avg. household income among middle 20% of earners: $68,621 (Massachusetts: $94,908)
- Middle-income range: $51,910 – $85,350 (Massachusetts: $72,967 – $119,408)
- Median income among all households: $68,400 (Massachusetts: $94,488)
- Adults with a bachelor’s degree or higher: 36.1% (Massachusetts: 46.6%)
- Metro areas considered in state: 5
Michigan: Saginaw
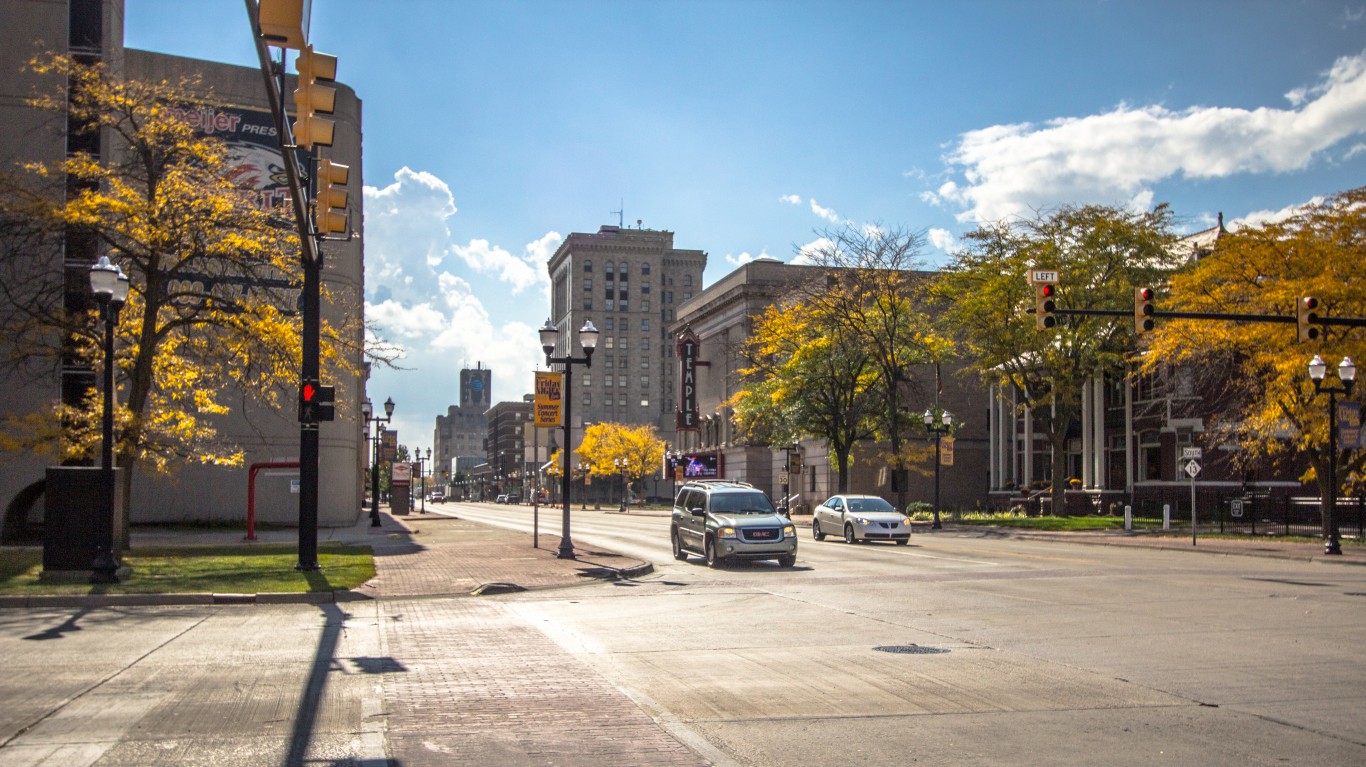
- Avg. household income among middle 20% of earners: $54,676 (Michigan: $67,641)
- Middle-income range: $44,401 – $67,738 (Michigan: $53,112 – $83,938)
- Median income among all households: $53,646 (Michigan: $66,986)
- Adults with a bachelor’s degree or higher: 24.6% (Michigan: 32.1%)
- Metro areas considered in state: 14
Minnesota: Duluth

- Avg. household income among middle 20% of earners: $66,194 (Minnesota: $82,872)
- Middle-income range: $51,686 – $82,574 (Minnesota: $65,973 – $101,320)
- Median income among all households: $65,963 (Minnesota: $82,338)
- Adults with a bachelor’s degree or higher: 30.0% (Minnesota: 39.1%)
- Metro areas considered in state: 5
Mississippi: Hattiesburg
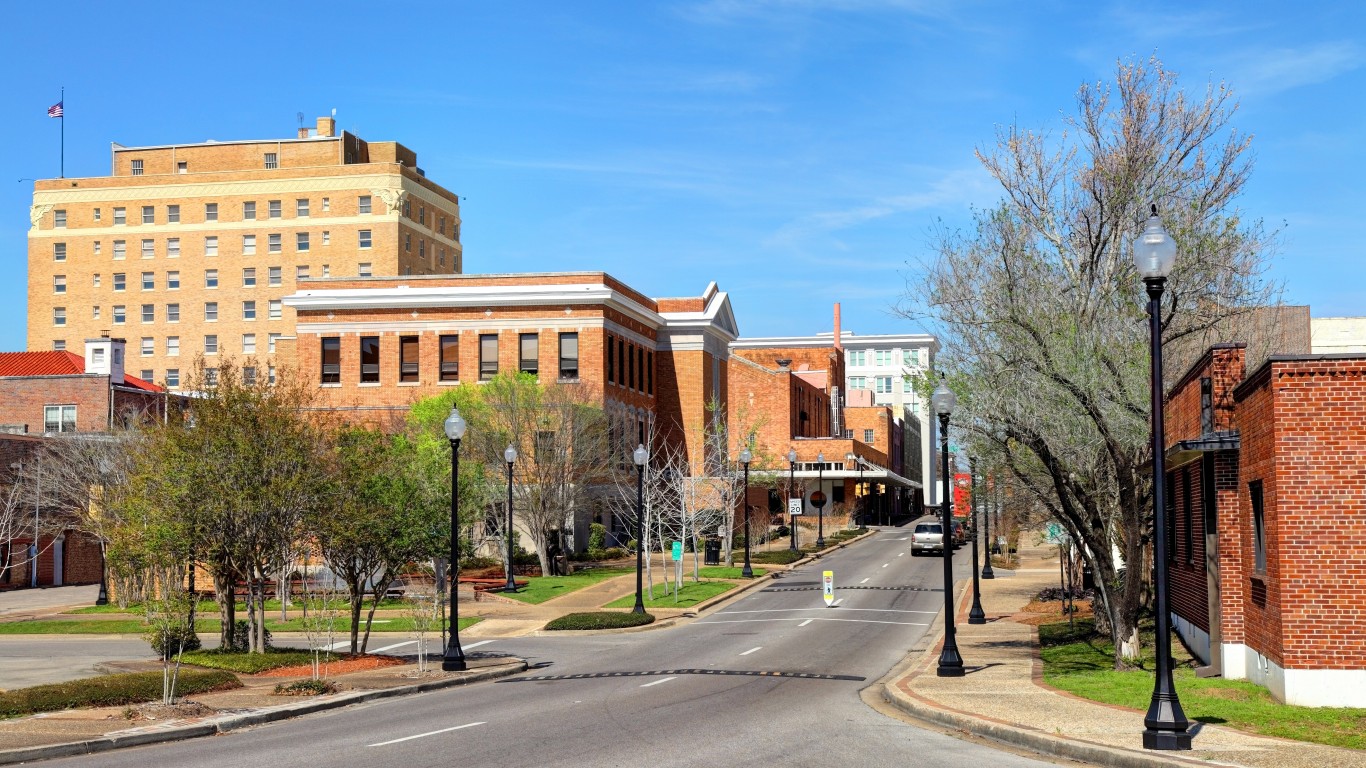
- Avg. household income among middle 20% of earners: $54,503 (Mississippi: $52,845)
- Middle-income range: $42,807 – $65,423 (Mississippi: $40,913 – $65,726)
- Median income among all households: $54,560 (Mississippi: $52,719)
- Adults with a bachelor’s degree or higher: 29.3% (Mississippi: 24.8%)
- Metro areas considered in state: 3
Missouri: Joplin
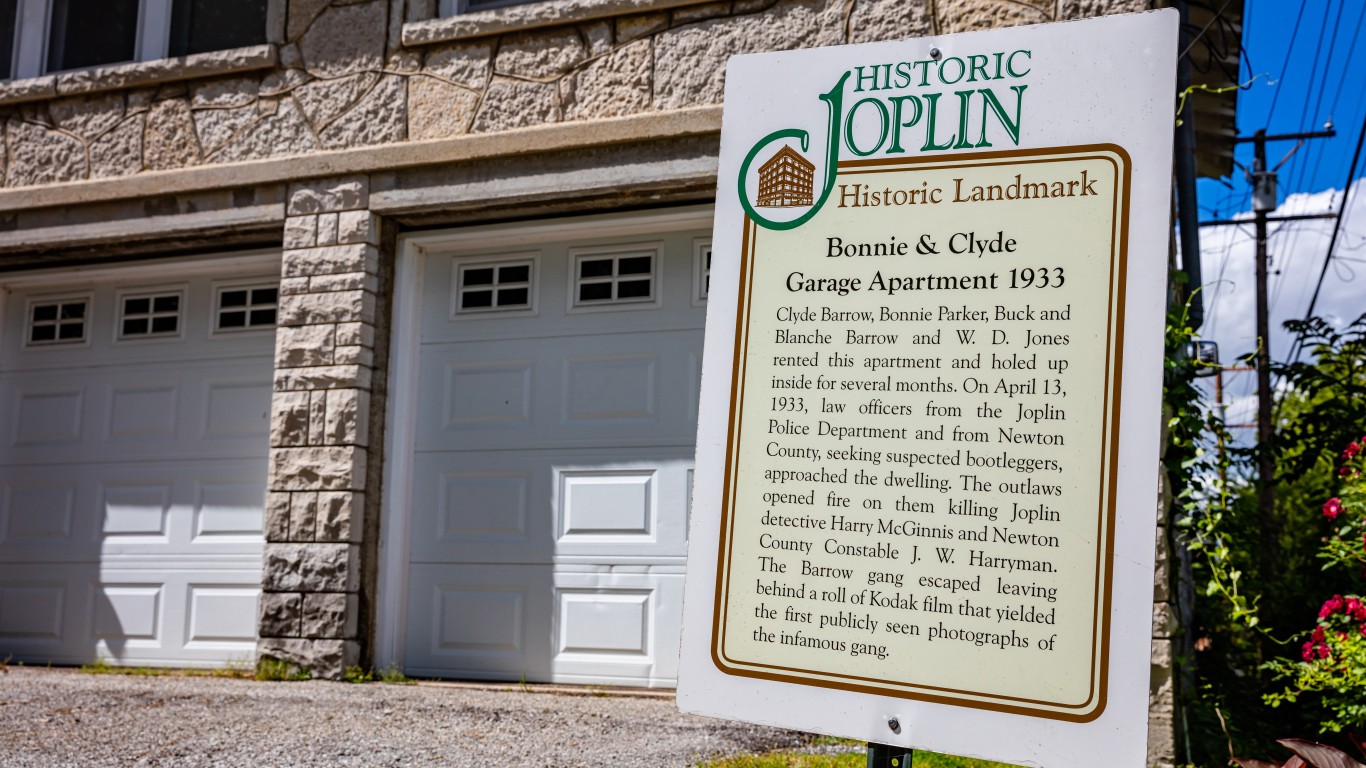
- Avg. household income among middle 20% of earners: $55,085 (Missouri: $65,334)
- Middle-income range: $43,656 – $68,251 (Missouri: $51,607 – $80,613)
- Median income among all households: $54,041 (Missouri: $64,811)
- Adults with a bachelor’s degree or higher: 24.8% (Missouri: 32.2%)
- Metro areas considered in state: 8
Montana: Great Falls
- Avg. household income among middle 20% of earners: $60,145 (Montana: $67,919)
- Middle-income range: $49,264 – $73,325 (Montana: $54,044 – $82,048)
- Median income among all households: $58,698 (Montana: $67,631)
- Adults with a bachelor’s degree or higher: 28.0% (Montana: 34.6%)
- Metro areas considered in state: 3
Nebraska: Grand Island
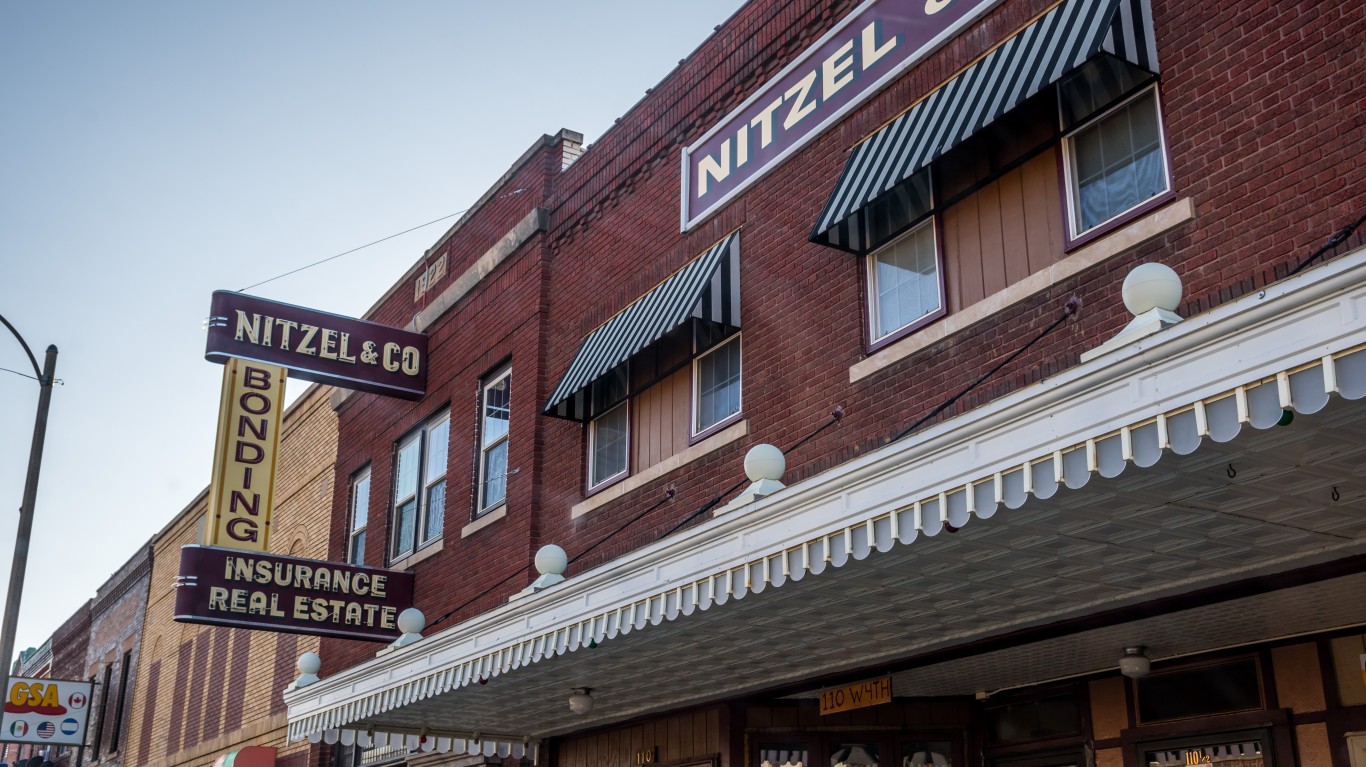
- Avg. household income among middle 20% of earners: $67,939 (Nebraska: $70,317)
- Middle-income range: $51,539 – $84,651 (Nebraska: $55,405 – $87,098)
- Median income among all households: $67,646 (Nebraska: $69,597)
- Adults with a bachelor’s degree or higher: 23.3% (Nebraska: 34.7%)
- Metro areas considered in state: 3
Nevada: Carson City
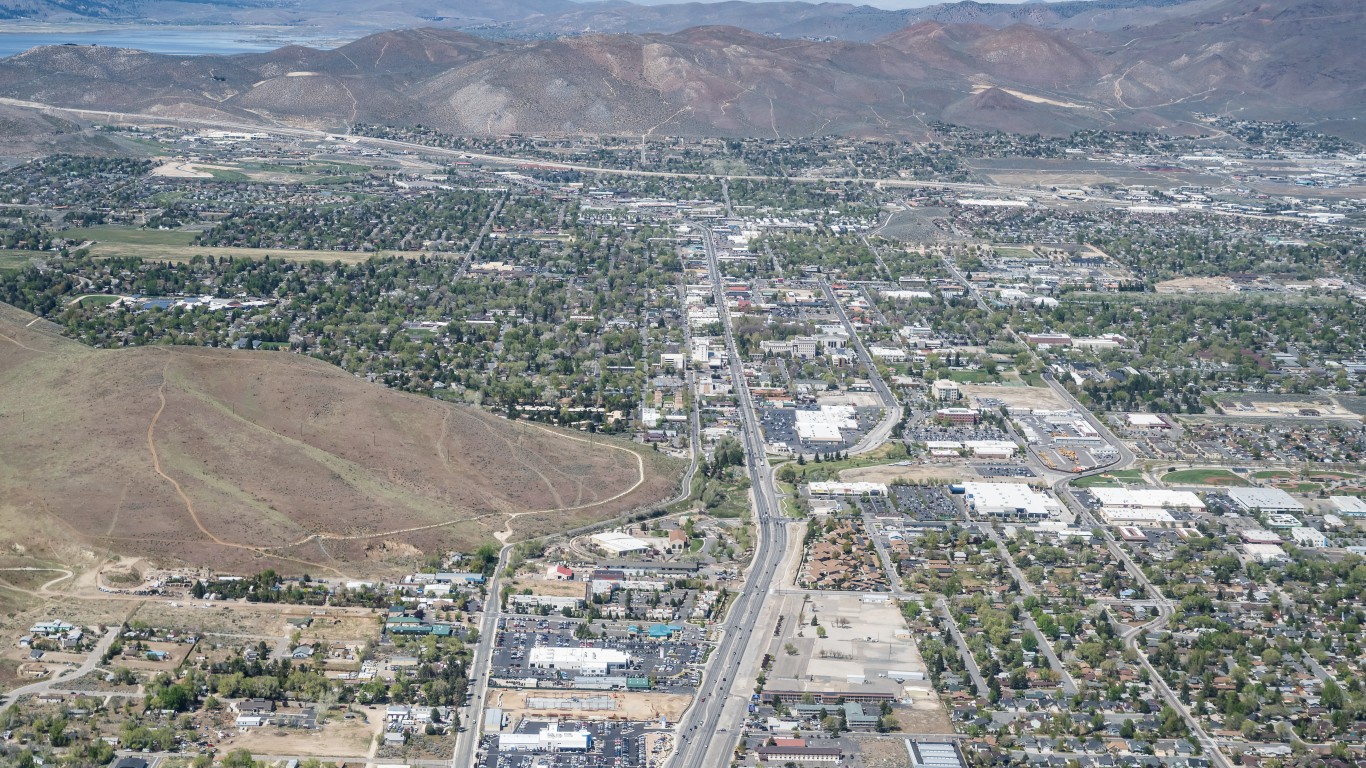
- Avg. household income among middle 20% of earners: $60,850 (Nevada: $72,629)
- Middle-income range: $51,323 – $72,917 (Nevada: $57,914 – $88,971)
- Median income among all households: $59,042 (Nevada: $72,333)
- Adults with a bachelor’s degree or higher: 24.0% (Nevada: 27.0%)
- Metro areas considered in state: 3
New Hampshire: Manchester-Nashua

- Avg. household income among middle 20% of earners: $97,016 (New Hampshire: $90,431)
- Middle-income range: $77,249 – $120,114 (New Hampshire: $72,050 – $110,461)
- Median income among all households: $96,921 (New Hampshire: $89,992)
- Adults with a bachelor’s degree or higher: 40.7% (New Hampshire: 41.3%)
- Metro areas considered in state: 1
New Jersey: Vineland-Bridgeton

- Avg. household income among middle 20% of earners: $60,922 (New Jersey: $96,732)
- Middle-income range: $50,343 – $73,594 (New Jersey: $75,301 – $120,887)
- Median income among all households: $60,755 (New Jersey: $96,346)
- Adults with a bachelor’s degree or higher: 19.0% (New Jersey: 43.5%)
- Metro areas considered in state: 4
New Mexico: Farmington

- Avg. household income among middle 20% of earners: $50,467 (New Mexico: $60,150)
- Middle-income range: $38,716 – $65,752 (New Mexico: $46,035 – $76,206)
- Median income among all households: $50,264 (New Mexico: $59,726)
- Adults with a bachelor’s degree or higher: 18.1% (New Mexico: 30.5%)
- Metro areas considered in state: 4
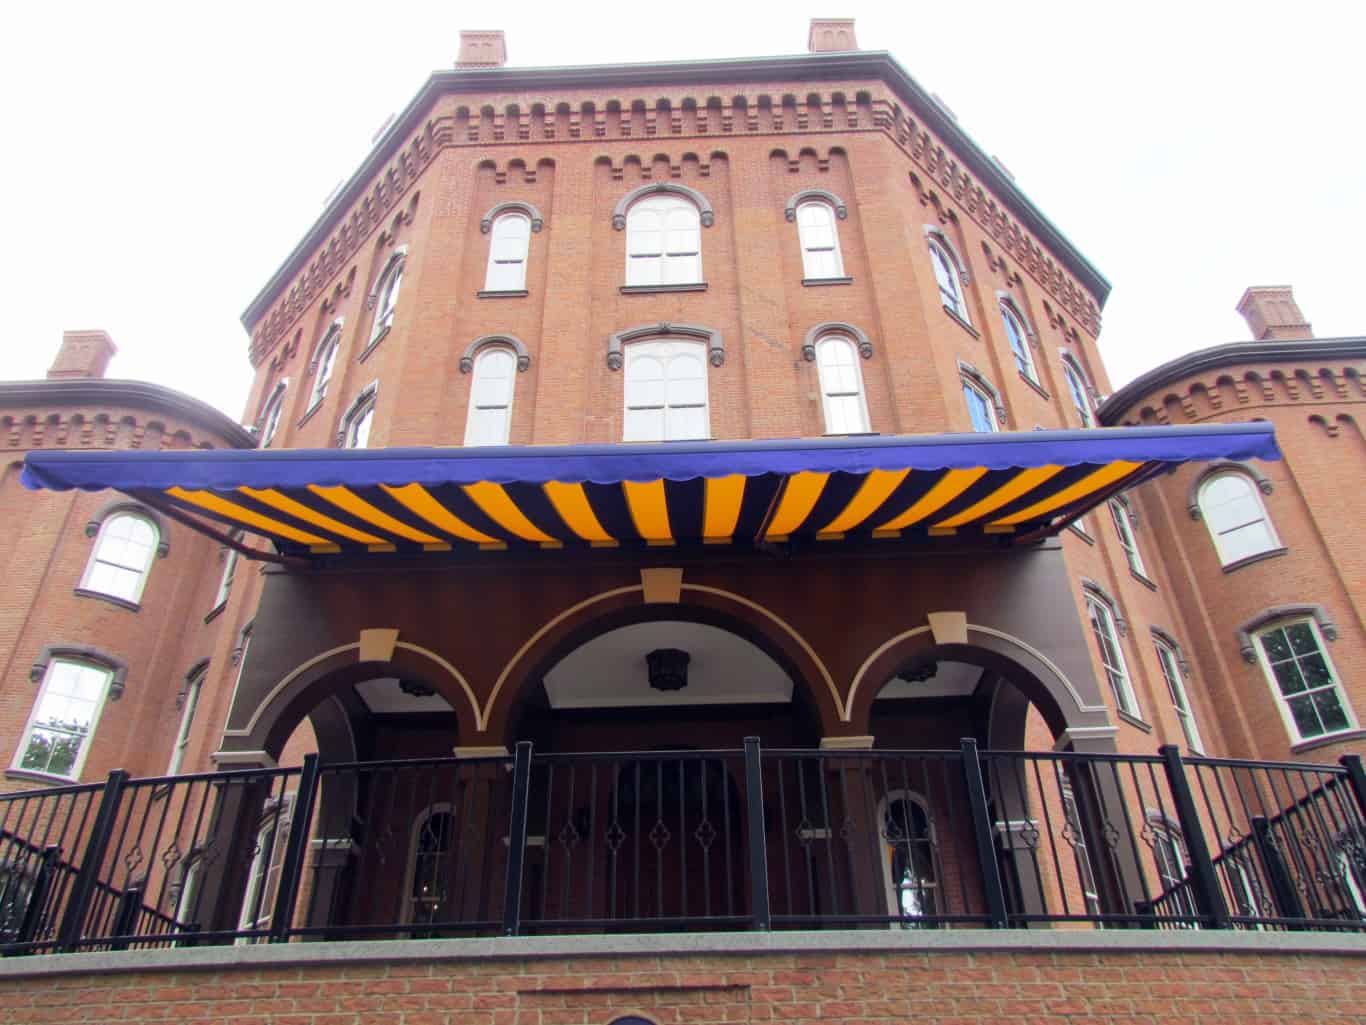
New York: Elmira
- Avg. household income among middle 20% of earners: $56,203 (New York: $80,086)
- Middle-income range: $45,933 – $67,223 (New York: $61,198 – $101,521)
- Median income among all households: $55,845 (New York: $79,557)
- Adults with a bachelor’s degree or higher: 27.0% (New York: 40.0%)
- Metro areas considered in state: 13
North Carolina: Rocky Mount
- Avg. household income among middle 20% of earners: $53,578 (North Carolina: $67,852)
- Middle-income range: $42,564 – $64,311 (North Carolina: $53,314 – $83,902)
- Median income among all households: $53,896 (North Carolina: $67,481)
- Adults with a bachelor’s degree or higher: 21.0% (North Carolina: 35.9%)
- Metro areas considered in state: 15
North Dakota: Grand Forks

- Avg. household income among middle 20% of earners: $65,347 (North Dakota: $72,530)
- Middle-income range: $51,523 – $82,042 (North Dakota: $57,556 – $88,516)
- Median income among all households: $65,413 (North Dakota: $71,970)
- Adults with a bachelor’s degree or higher: 35.1% (North Dakota: 31.8%)
- Metro areas considered in state: 3
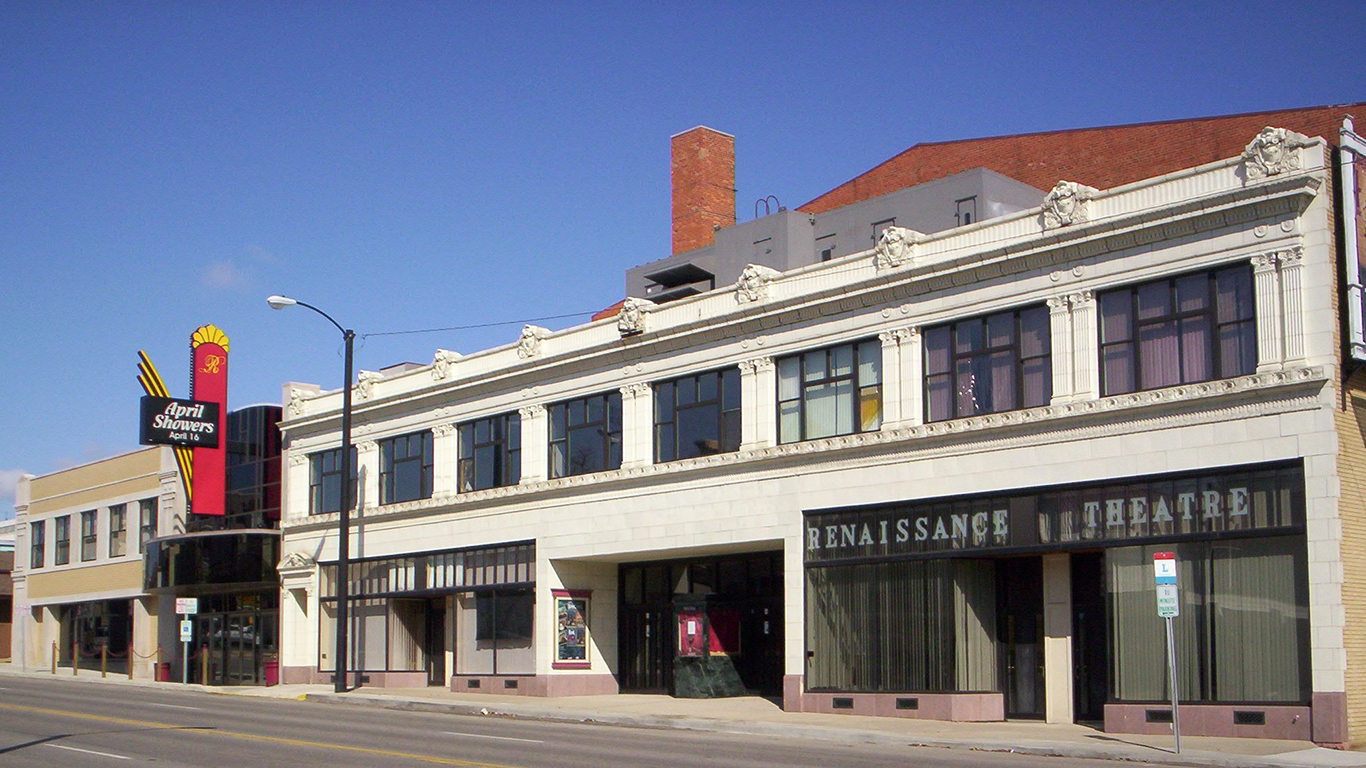
Ohio: Mansfield
- Avg. household income among middle 20% of earners: $52,830 (Ohio: $66,381)
- Middle-income range: $42,387 – $64,262 (Ohio: $52,303 – $82,246)
- Median income among all households: $53,047 (Ohio: $65,720)
- Adults with a bachelor’s degree or higher: 17.9% (Ohio: 32.0%)
- Metro areas considered in state: 11
Oklahoma: Enid
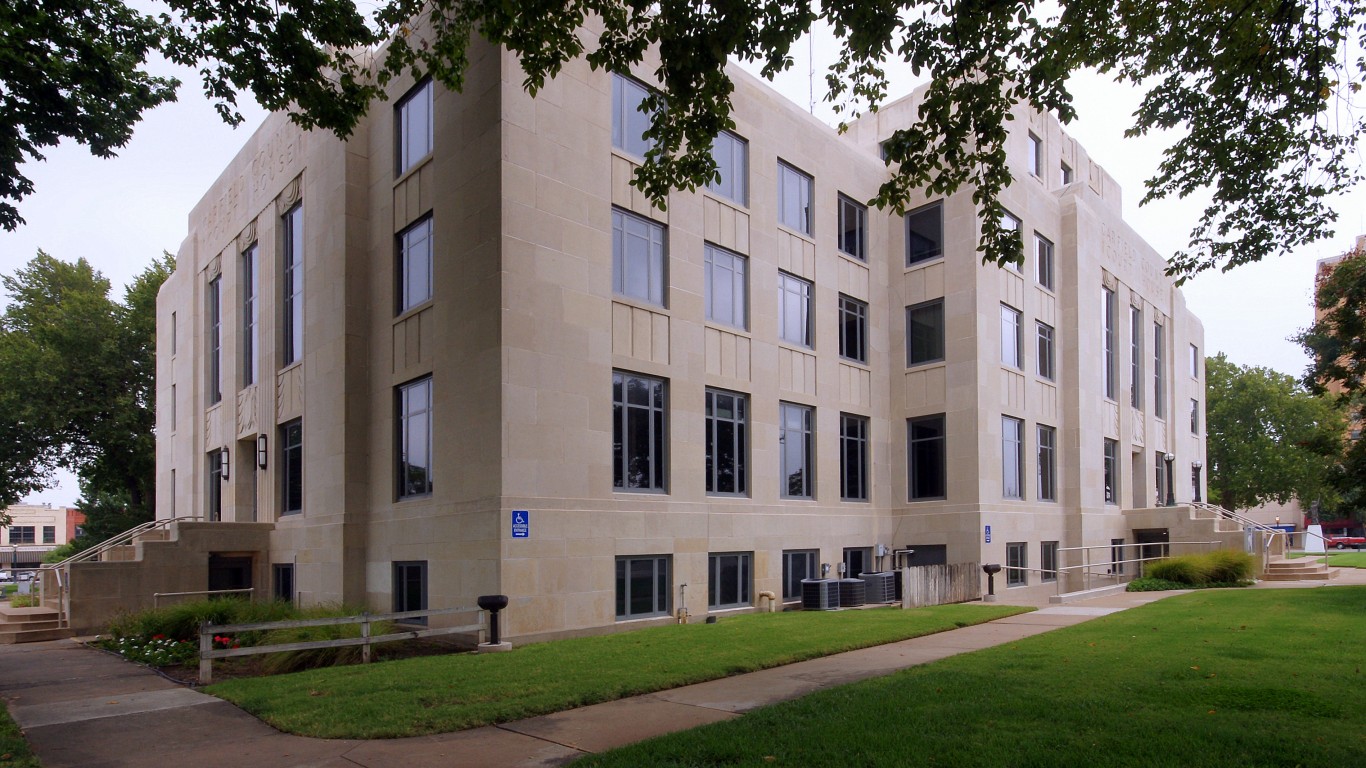
- Avg. household income among middle 20% of earners: $54,913 (Oklahoma: $59,995)
- Middle-income range: $46,709 – $62,878 (Oklahoma: $47,234 – $74,521)
- Median income among all households: $55,131 (Oklahoma: $59,673)
- Adults with a bachelor’s degree or higher: 22.6% (Oklahoma: 28.5%)
- Metro areas considered in state: 4
Oregon: Grants Pass
- Avg. household income among middle 20% of earners: $54,850 (Oregon: $76,158)
- Middle-income range: $40,809 – $72,639 (Oregon: $60,274 – $93,712)
- Median income among all households: $53,838 (Oregon: $75,657)
- Adults with a bachelor’s degree or higher: 21.3% (Oregon: 36.3%)
- Metro areas considered in state: 8
Pennsylvania: Johnstown

- Avg. household income among middle 20% of earners: $55,497 (Pennsylvania: $72,280)
- Middle-income range: $43,311 – $67,373 (Pennsylvania: $56,650 – $89,845)
- Median income among all households: $54,905 (Pennsylvania: $71,798)
- Adults with a bachelor’s degree or higher: 23.3% (Pennsylvania: 35.1%)
- Metro areas considered in state: 18
Rhode Island: Providence-Warwick
- Avg. household income among middle 20% of earners: $82,213 (Rhode Island: $82,368)
- Middle-income range: $63,719 – $102,920 (Rhode Island: $64,544 – $102,587)
- Median income among all households: $81,784 (Rhode Island: $81,854)
- Adults with a bachelor’s degree or higher: 36.7% (Rhode Island: 39.6%)
- Metro areas considered in state: 1
South Carolina: Florence

- Avg. household income among middle 20% of earners: $50,940 (South Carolina: $64,544)
- Middle-income range: $39,550 – $66,252 (South Carolina: $50,604 – $79,729)
- Median income among all households: $50,219 (South Carolina: $64,115)
- Adults with a bachelor’s degree or higher: 24.3% (South Carolina: 32.6%)
- Metro areas considered in state: 8
South Dakota: Rapid City
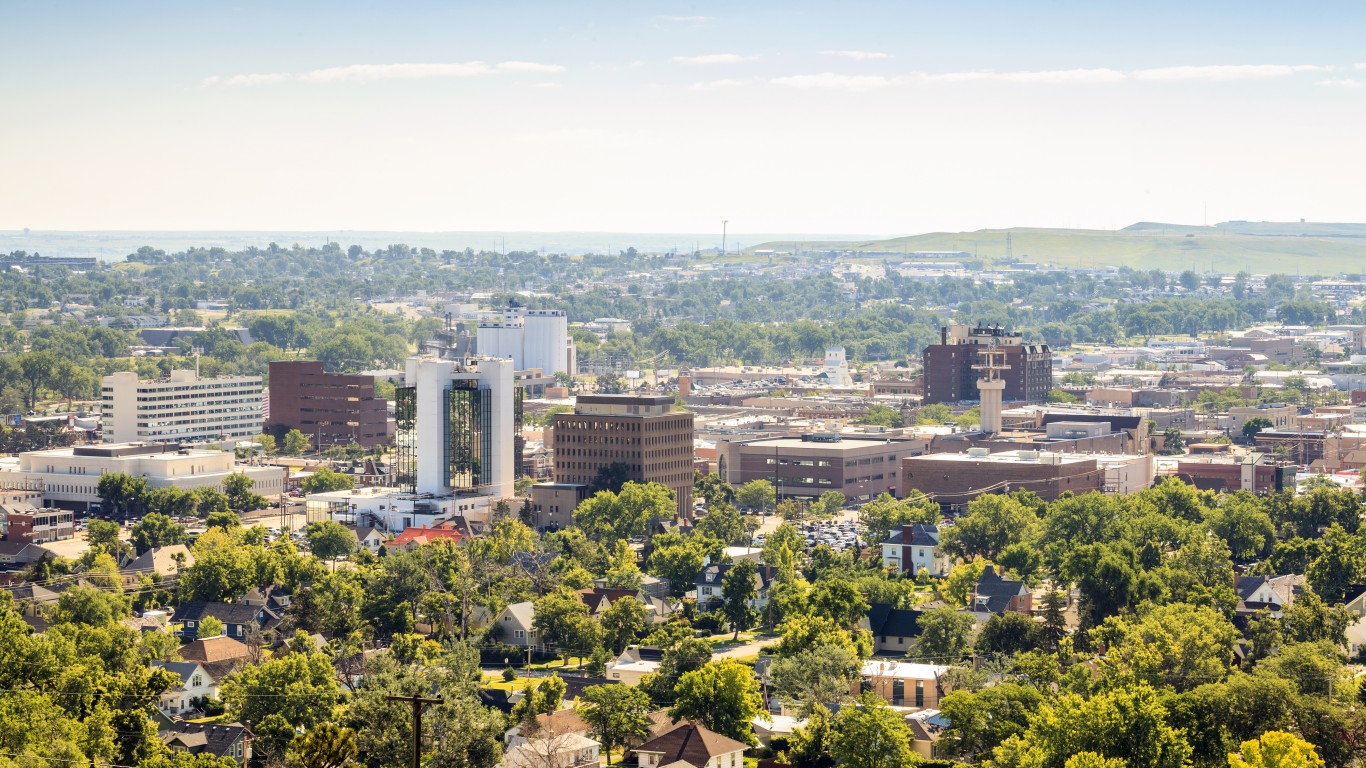
- Avg. household income among middle 20% of earners: $66,702 (South Dakota: $69,936)
- Middle-income range: $52,925 – $79,803 (South Dakota: $55,457 – $85,338)
- Median income among all households: $67,468 (South Dakota: $69,728)
- Adults with a bachelor’s degree or higher: 33.1% (South Dakota: 31.6%)
- Metro areas considered in state: 2
Tennessee: Kingsport-Bristol
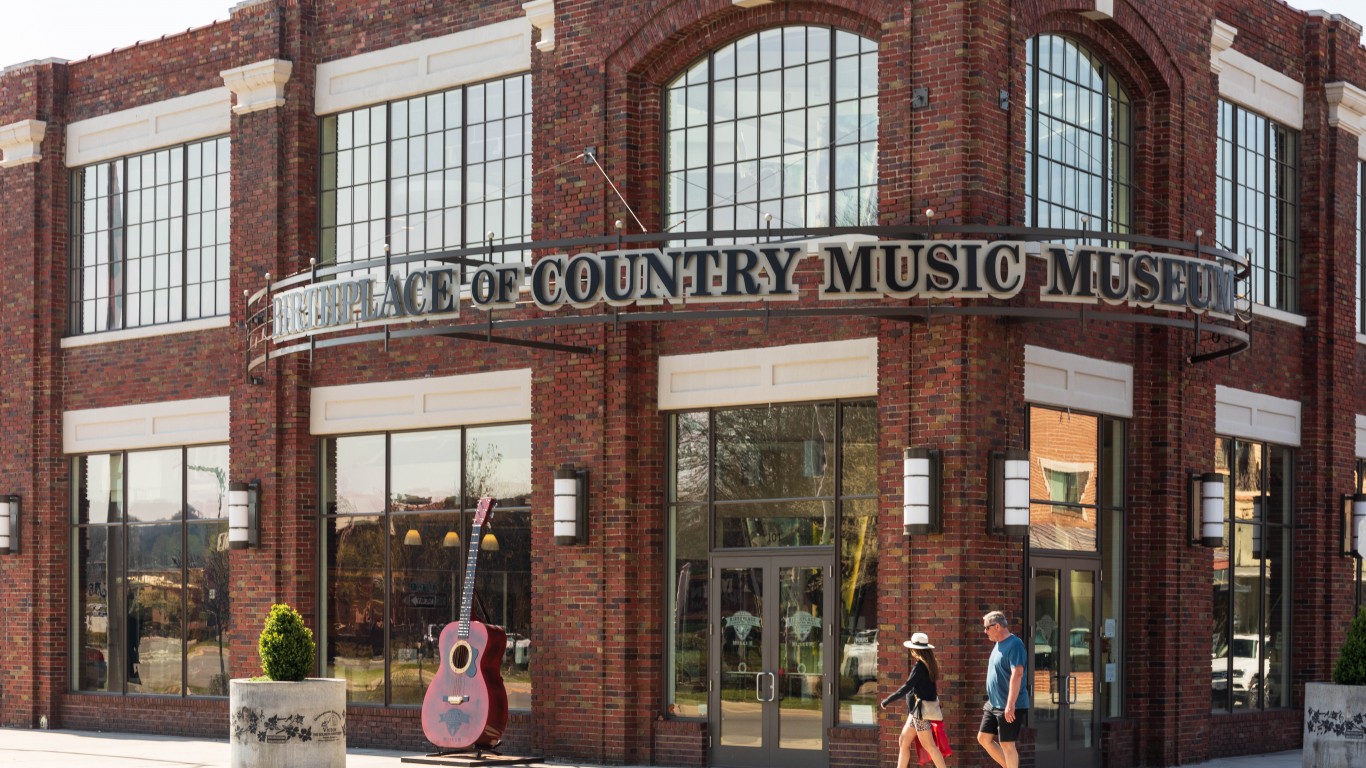
- Avg. household income among middle 20% of earners: $53,261 (Tennessee: $65,757)
- Middle-income range: $41,707 – $67,224 (Tennessee: $51,957 – $80,848)
- Median income among all households: $52,887 (Tennessee: $65,254)
- Adults with a bachelor’s degree or higher: 21.8% (Tennessee: 31.1%)
- Metro areas considered in state: 10
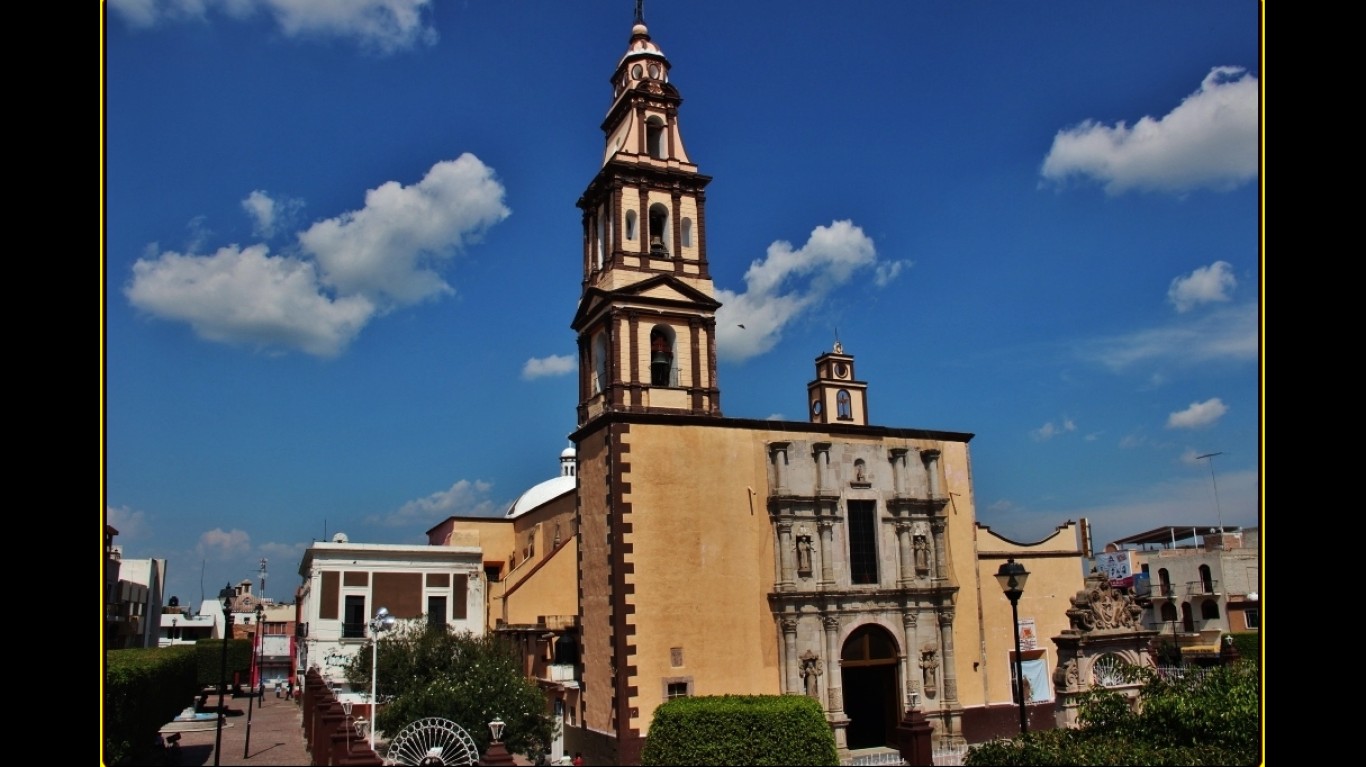
Texas: Texarkana
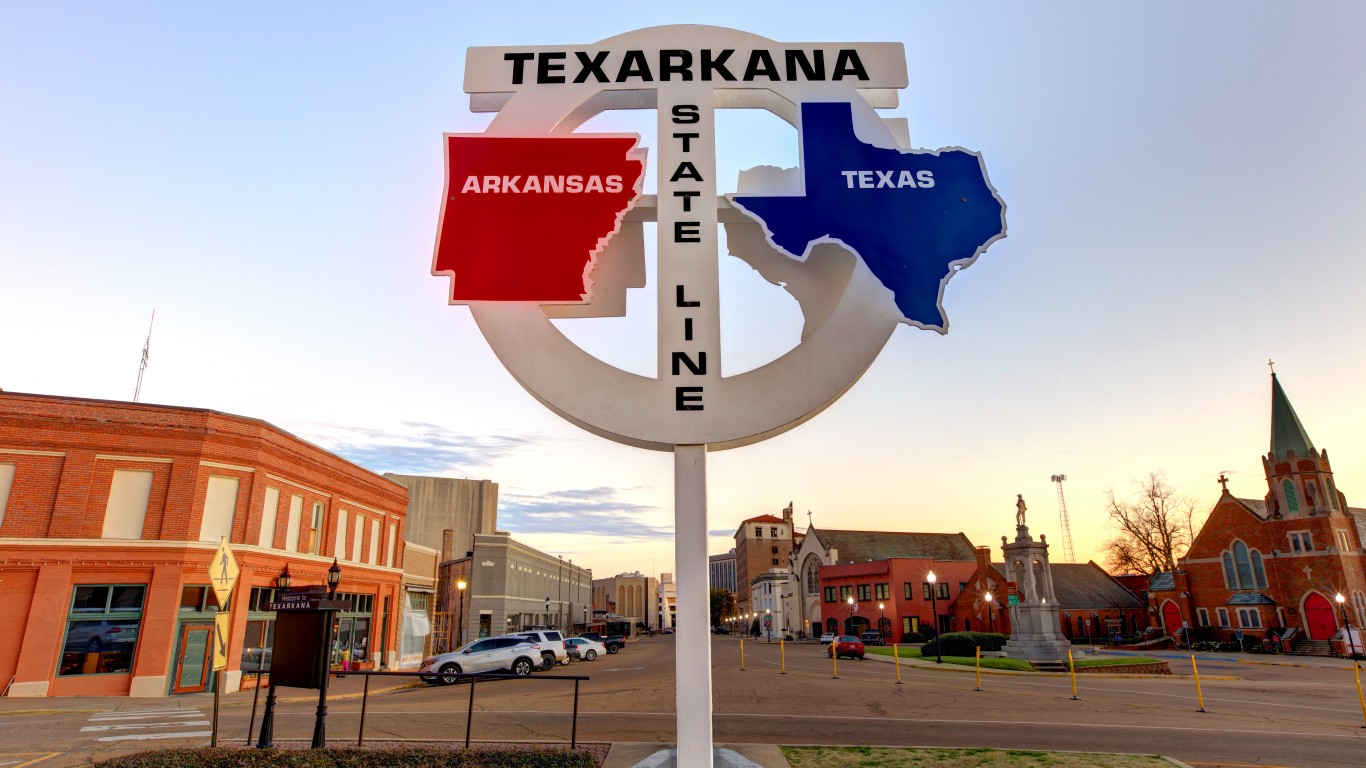
- Avg. household income among middle 20% of earners: $48,651 (Texas: $72,774)
- Middle-income range: $37,949 – $60,209 (Texas: $57,305 – $90,382)
- Median income among all households: $48,230 (Texas: $72,284)
- Adults with a bachelor’s degree or higher: 20.1% (Texas: 33.9%)
- Metro areas considered in state: 25
Utah: St. George

- Avg. household income among middle 20% of earners: $75,769 (Utah: $89,334)
- Middle-income range: $61,246 – $96,638 (Utah: $72,820 – $107,175)
- Median income among all households: $74,543 (Utah: $89,168)
- Adults with a bachelor’s degree or higher: 36.6% (Utah: 37.9%)
- Metro areas considered in state: 5
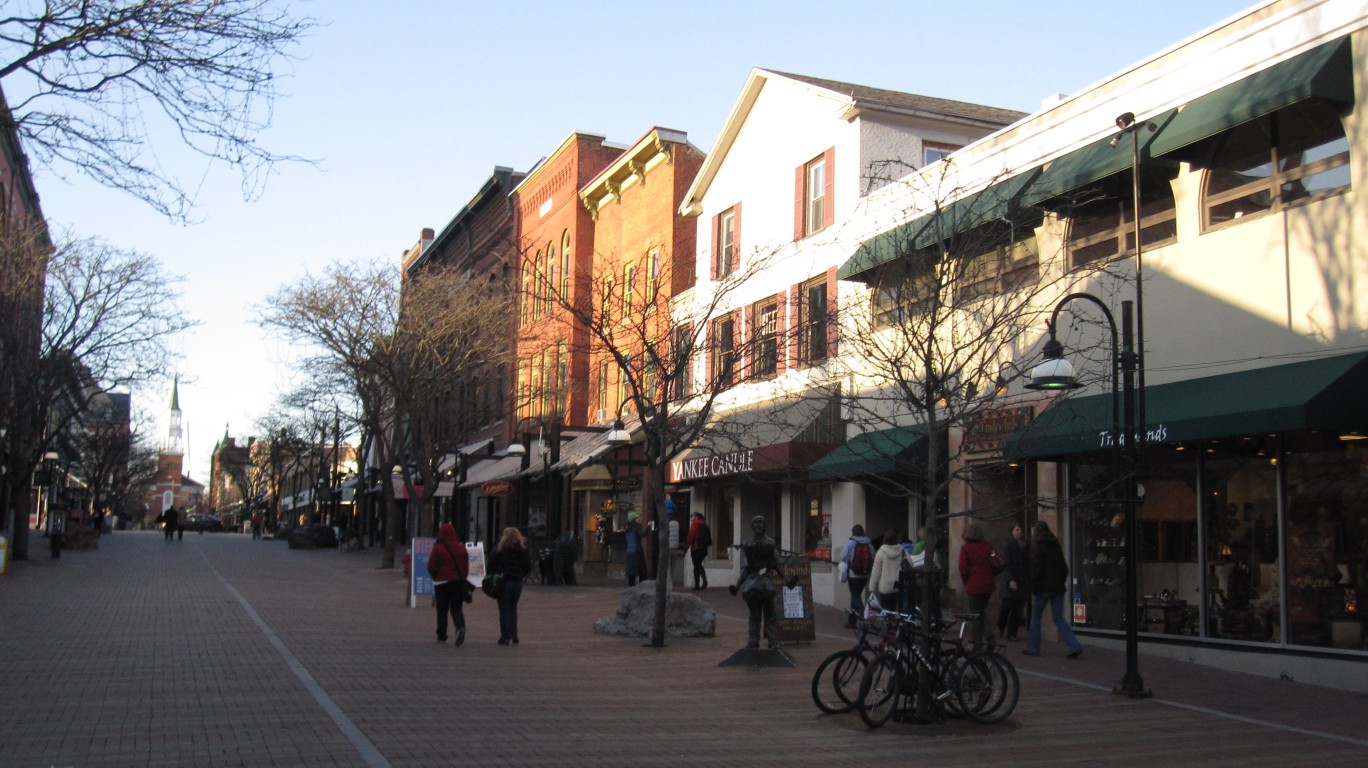
Vermont: Burlington-South Burlington
- Avg. household income among middle 20% of earners: $84,848 (Vermont: $74,558)
- Middle-income range: $67,799 – $103,920 (Vermont: $58,956 – $92,285)
- Median income among all households: $83,707 (Vermont: $73,991)
- Adults with a bachelor’s degree or higher: 52.8% (Vermont: 44.2%)
- Metro areas considered in state: 1
Virginia: Lynchburg

- Avg. household income among middle 20% of earners: $62,170 (Virginia: $86,799)
- Middle-income range: $48,918 – $75,526 (Virginia: $67,585 – $108,091)
- Median income among all households: $62,918 (Virginia: $85,873)
- Adults with a bachelor’s degree or higher: 31.0% (Virginia: 42.2%)
- Metro areas considered in state: 9
Washington: Yakima
- Avg. household income among middle 20% of earners: $64,963 (Washington: $91,550)
- Middle-income range: $51,286 – $82,619 (Washington: $72,798 – $111,855)
- Median income among all households: $63,865 (Washington: $91,306)
- Adults with a bachelor’s degree or higher: 18.9% (Washington: 39.5%)
- Metro areas considered in state: 11
West Virginia: Beckley

- Avg. household income among middle 20% of earners: $52,468 (West Virginia: $54,710)
- Middle-income range: $40,222 – $64,458 (West Virginia: $42,002 – $68,527)
- Median income among all households: $52,633 (West Virginia: $54,329)
- Adults with a bachelor’s degree or higher: 21.0% (West Virginia: 24.8%)
- Metro areas considered in state: 7
Wisconsin: Sheboygan
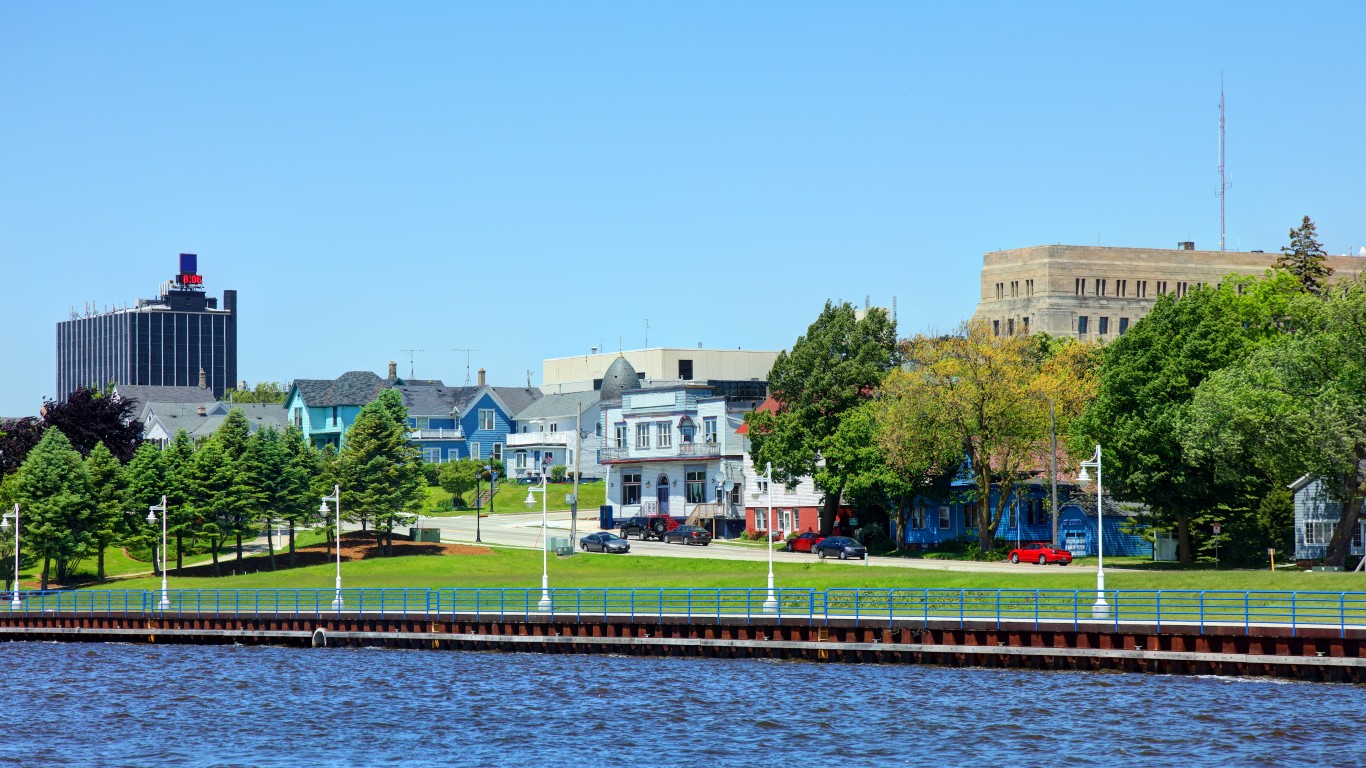
- Avg. household income among middle 20% of earners: $64,516 (Wisconsin: $71,197)
- Middle-income range: $56,008 – $78,644 (Wisconsin: $56,865 – $87,406)
- Median income among all households: $62,978 (Wisconsin: $70,996)
- Adults with a bachelor’s degree or higher: 27.5% (Wisconsin: 33.2%)
- Metro areas considered in state: 12
Wyoming: Casper
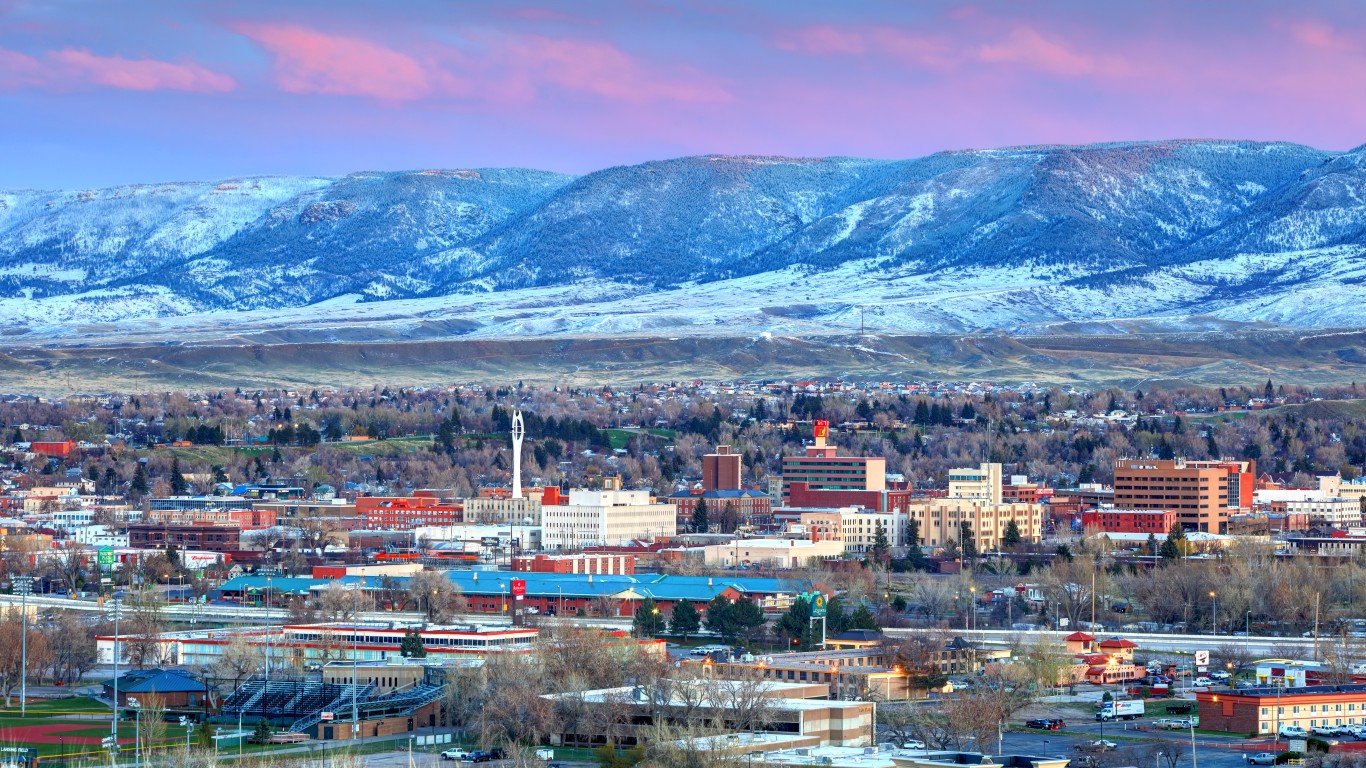
- Avg. household income among middle 20% of earners: $69,931 (Wyoming: $70,275)
- Middle-income range: $60,420 – $83,595 (Wyoming: $56,419 – $85,886)
- Median income among all households: $69,627 (Wyoming: $70,042)
- Adults with a bachelor’s degree or higher: 31.6% (Wyoming: 29.6%)
- Metro areas considered in state: 2
Methodology:
To identify the city in every state with the lowest-income middle class, 24/7 Wall St. reviewed metro area level data from the U.S. Census Bureau’s 2022 American Community Survey. For each of the 384 U.S. metro areas with available data, we reviewed the average income among the middle 20% of households by earnings. In each state, the metro area with the lowest average income among the middle quintile of earners ranks as having the poorest middle class. All supplementary data is also from the 2022 ACS.
In cases where a metro area spans multiple states, the metro area was assigned to its primary state.
It is important to note that Delaware, New Hampshire, Rhode Island, and Vermont are each home to only one metro area. As a result, the city listed for each of these states ranks as having the poorest middle class by default only.
Is Your Money Earning the Best Possible Rate? (Sponsor)
Let’s face it: If your money is just sitting in a checking account, you’re losing value every single day. With most checking accounts offering little to no interest, the cash you worked so hard to save is gradually being eroded by inflation.
However, by moving that money into a high-yield savings account, you can put your cash to work, growing steadily with little to no effort on your part. In just a few clicks, you can set up a high-yield savings account and start earning interest immediately.
There are plenty of reputable banks and online platforms that offer competitive rates, and many of them come with zero fees and no minimum balance requirements. Click here to see if you’re earning the best possible rate on your money!
Thank you for reading! Have some feedback for us?
Contact the 24/7 Wall St. editorial team.
