Special Report
Countries Where Pollution Reduction Would Increase Life Expectancy the Most
Published:
The World Health Organization explains that air pollution is caused by any chemical, physical, or biological agent that modifies the natural characteristics of outdoor or indoor atmospheres. About 99.82% of the global land area is exposed to levels of particulate matter, according to a global study published recently in Lancet Planetary Health, which is above the safety limit recommended by the Word Health Organization. There is just a tiny portion of the world population that breathes suitable air and exposure to air pollution can have both short-term and long-term effects on our health.
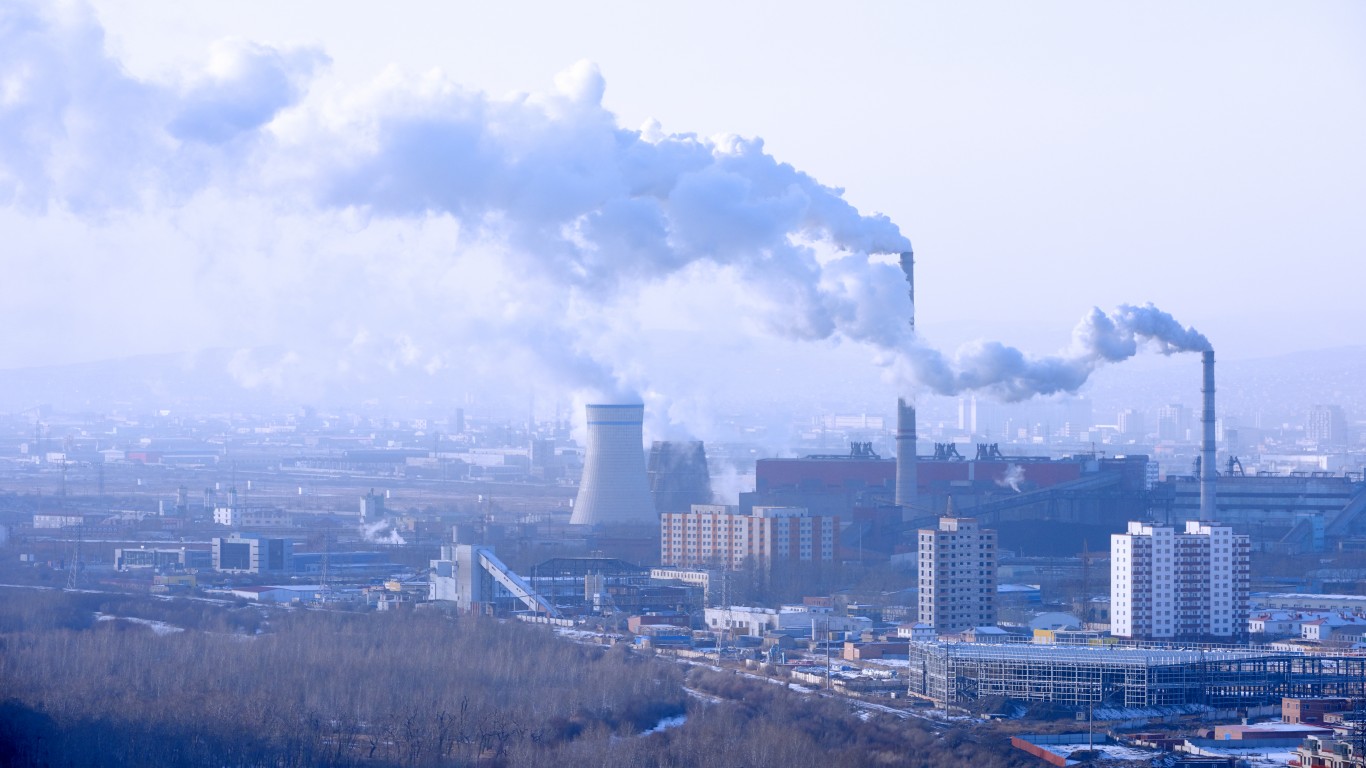
Household combustion devices such as gas or wood-burning stoves, forest fires, and vehicular and industrial emissions are major sources of these contaminants. They release particulate matter, carbon monoxide, ozone, nitrogen dioxide, and sulfur dioxide that cause respiratory and other diseases, increasing illness and death. They are especially harmful to children, older adults, pregnant women, and anyone with heart and lung diseases. Indoor and outdoor air pollution is said to be connected to the early deaths of about 6.7 million people throughout the globe in 2019 alone.
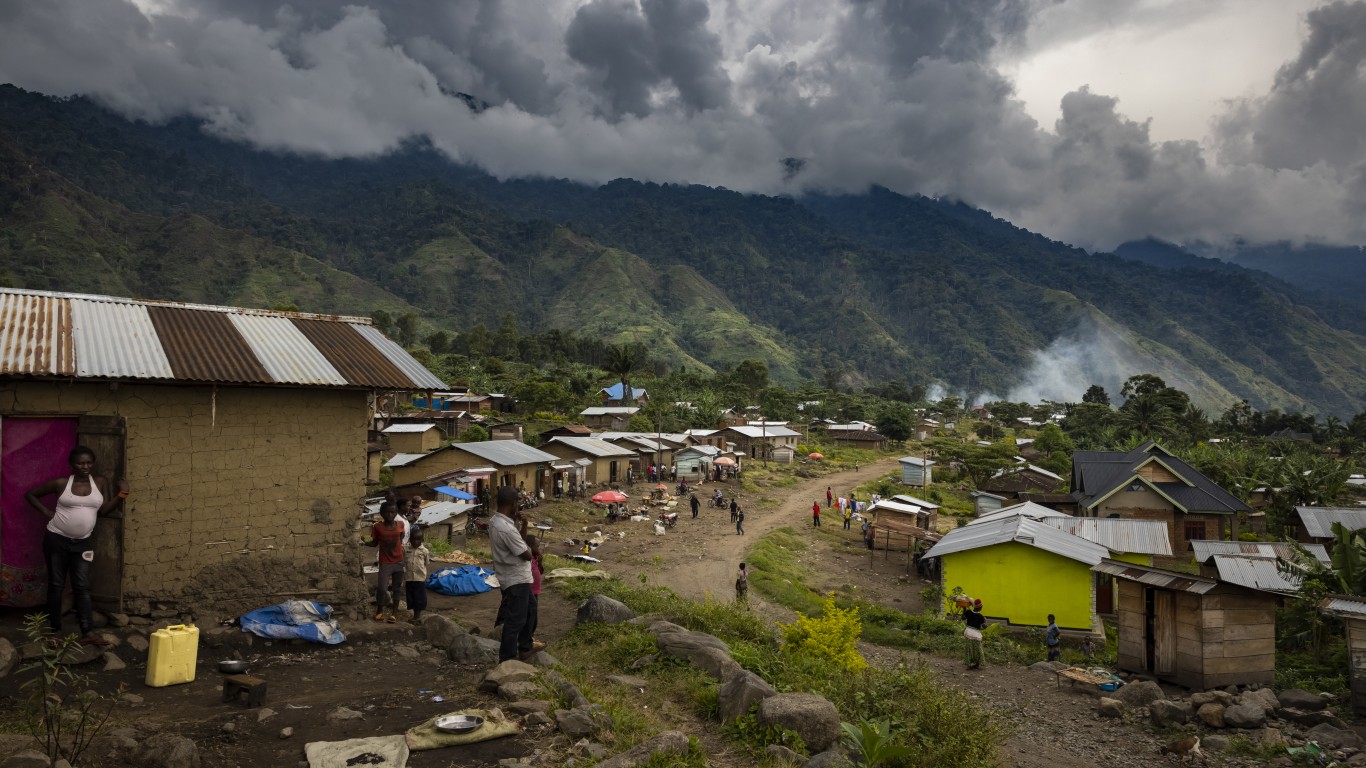
All countries and regions can suffer from bad air days, particularly urban areas, but it is developing countries that suffer the most. People living in these countries can lose years of their lives simply by breathing the surrounding air, especially those living in the most polluted areas. (Also see the 25 countries emitting the most CO2.)
24/7 Wall St. reviewed the University of Chicago’s Energy Policy Institute Air Quality Life Index 2023 Annual Update to identify the countries where pollution reduction would add to life expectancy. We listed here the 20 countries where the average life expectancy would increase by at least two years if PM2.5 air pollution were reduced from 2021 levels to WHO guidelines of 5 micrograms per cubic meter of air. PM2.5 stands for particulate matter that is 2.5 microns in diameter or smaller. See the report’s full methodology here.
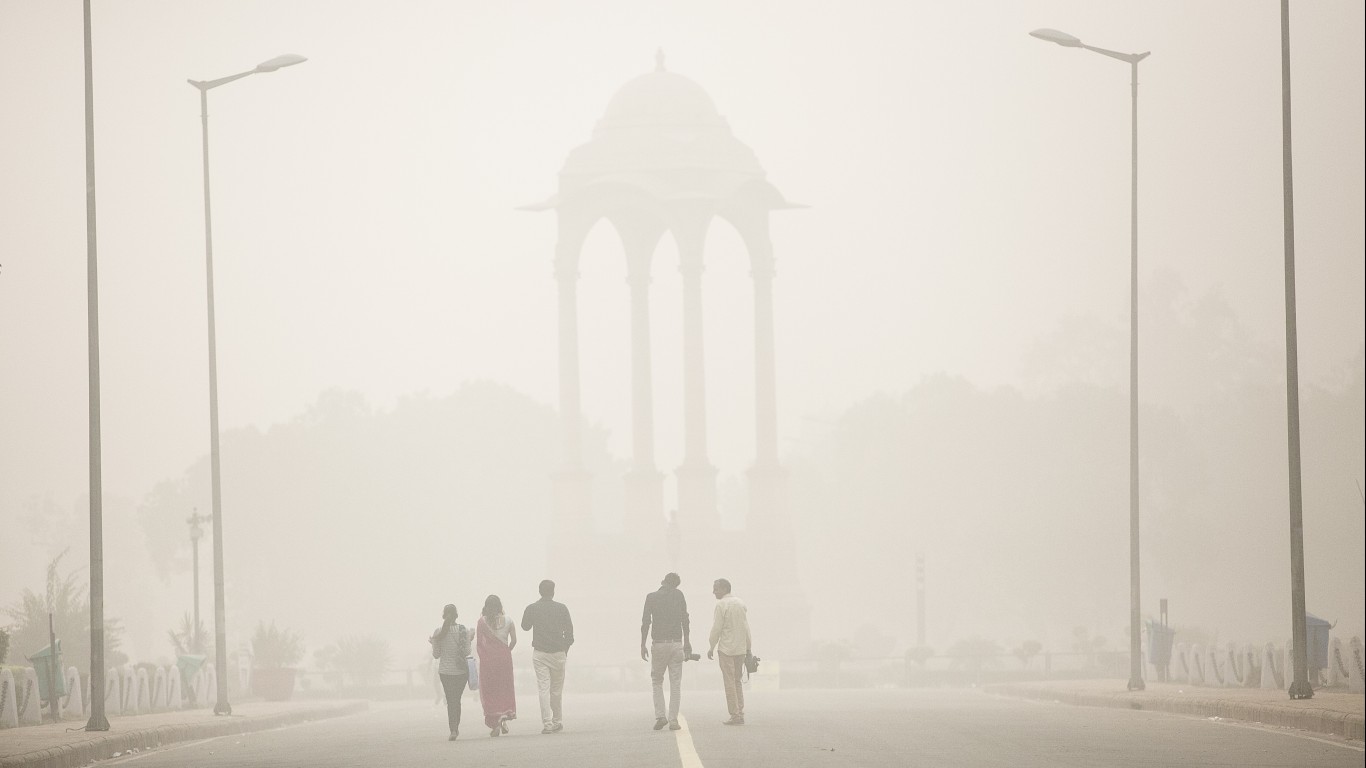
These microparticles, which are often emitted by motor vehicles, are much smaller than the diameter of pollen or 1/30 the diameter of a human hair, penetrating deep into the lungs and entering the bloodstream. According to the report, India and Bangladesh would benefit the most from reducing PM2.5 pollution and would gain an average of 5.3 years and 6.8 years, respectively, in their population’s life expectancy. (In the U.S., these are the 23 places where industrial air pollution is so bad it causes cancer.)
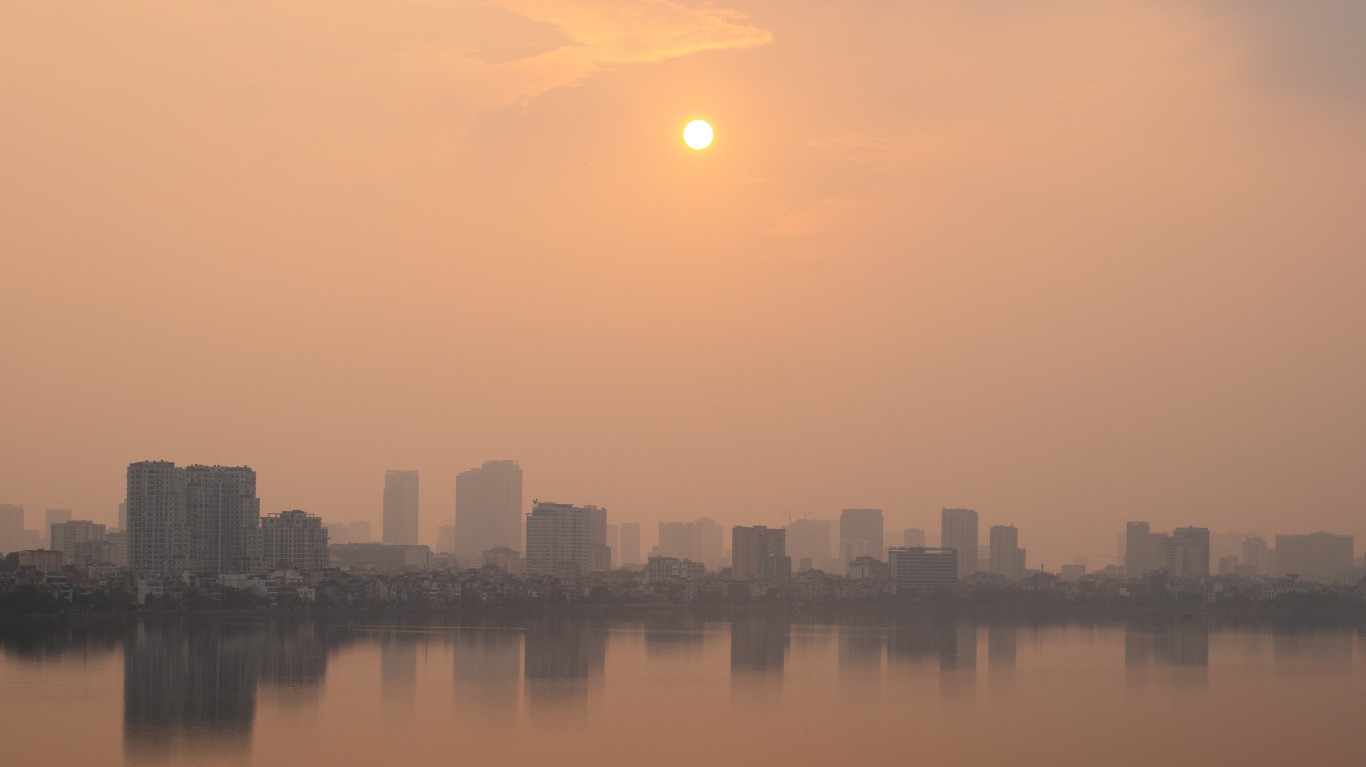
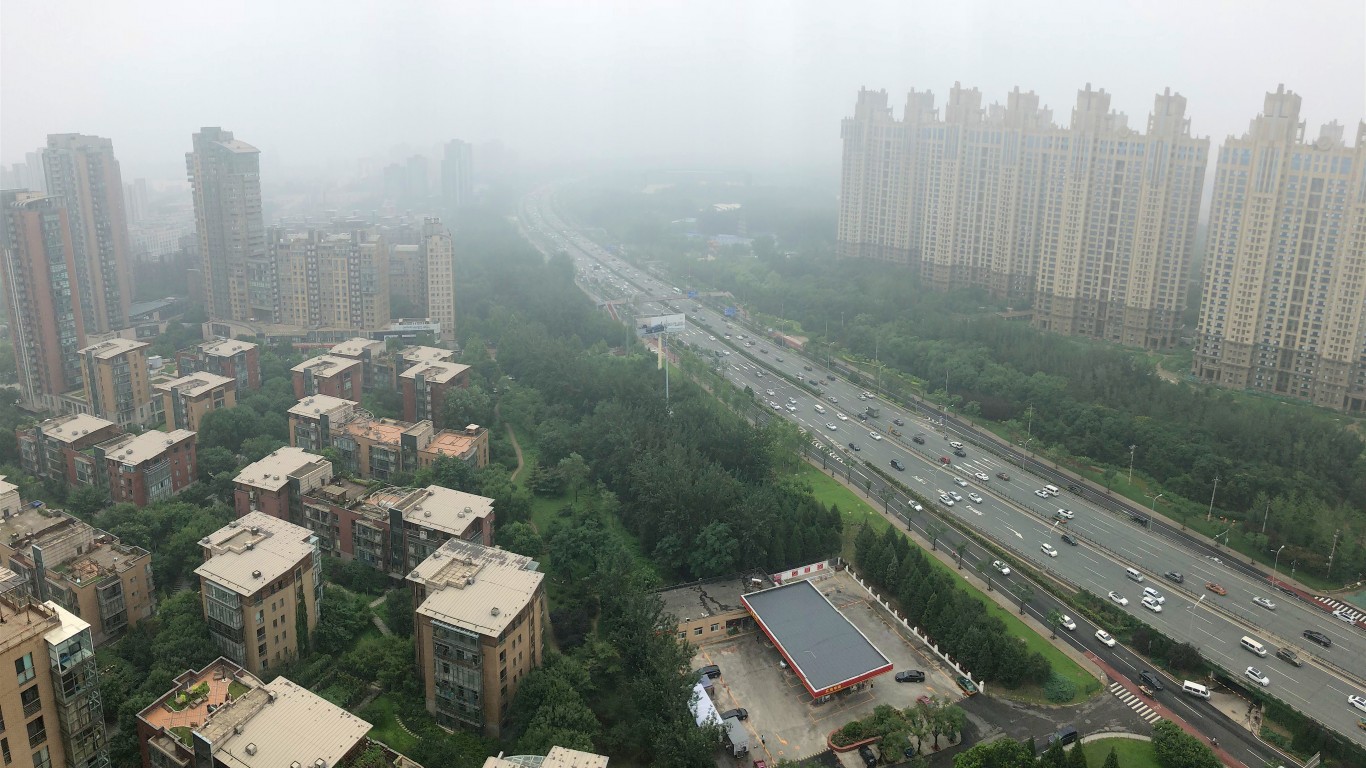
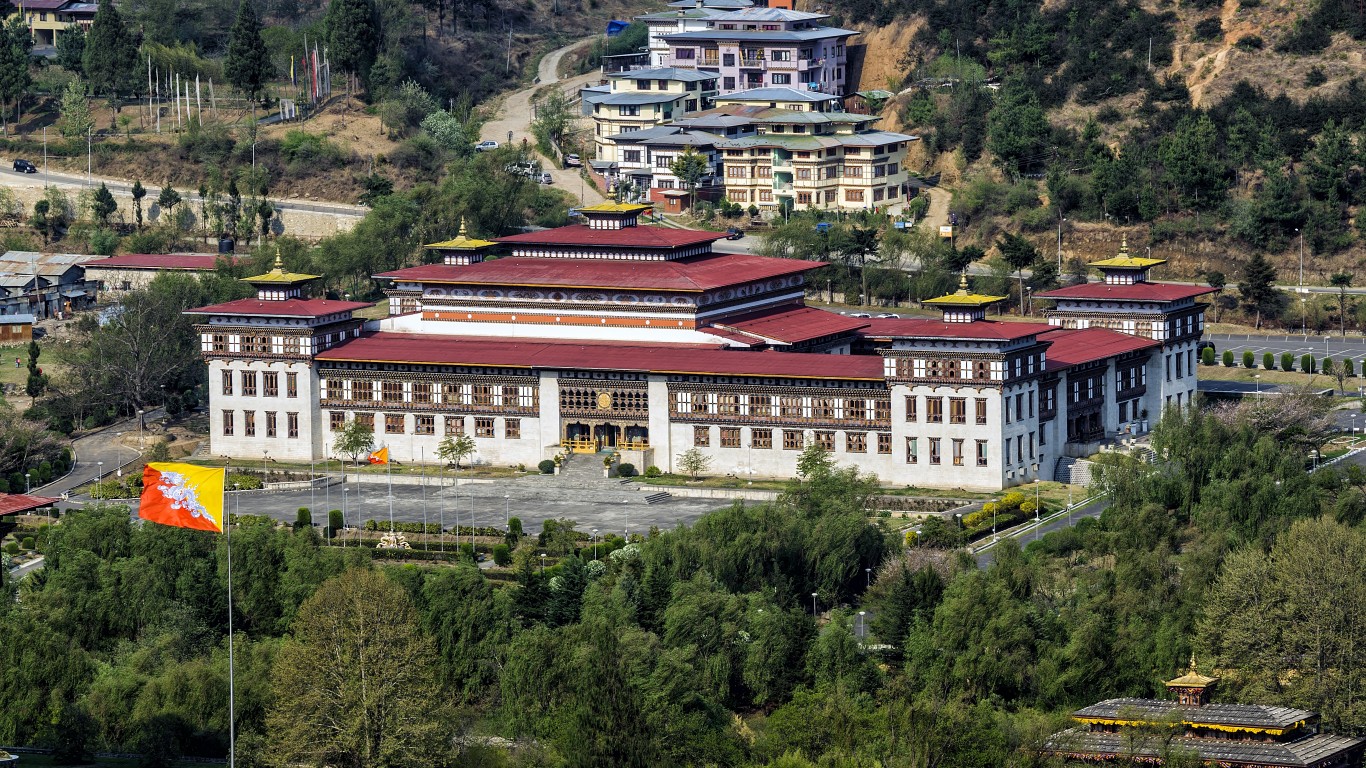
The majority of countries listed here where air pollution takes off the most years of life are in Africa or Asia, including the two largest countries by population — China and India — where about 35% of the global population lives. Six of these countries are among the top 20 most populated in the world, but the list also includes smaller countries like Bhutan, El Salvador, and Rwanda.
Here are the countries where a reduction in pollution would add to life expectancy
See below for our detailed methodology.


Methodology:
24/7 Wall St. reviewed the University of Chicago’s Energy Policy Institute Air Quality Life Index 2023 Annual Update to identify the countries where pollution reduction would add to life expectancy. We listed here the 20 countries where the average life expectancy would increase by at least two years if PM2.5 air pollution were reduced from 2021 levels to WHO guidelines of 5 micrograms per cubic meter of air.
“The life expectancy calculations made by the AQLI are based on a pair of peer-reviewed studies, Chen et al. (2013) and Ebenstein et al. (2017), co-authored by Michael Greenstone, that exploit a unique natural experiment in China. By comparing two subgroups of the population that experienced prolonged exposure to different levels of particulate air pollution, the studies were able to plausibly isolate the effect of particulate air pollution from other factors that affect health. Ebenstein et al. (2017) found that sustained exposure to an additional 10 μg/m3 of PM10 reduces life expectancy by 0.64 years. In terms of PM2.5, this translates to the relationship that an additional 10 μg/m3 of PM2.5 reduces life expectancy by 0.98 years. This metric is then combined with sea-salt and mineral dust removed satellite-derived PM2.5 data.”
See the report’s full methodology here.
Population statistics came from the World Bank and are for 2022.
Choosing the right (or wrong) time to claim Social Security can dramatically change your retirement. So, before making one of the biggest decisions of your financial life, it’s a smart idea to get an extra set of eyes on your complete financial situation.
A financial advisor can help you decide the right Social Security option for you and your family. Finding a qualified financial advisor doesn’t have to be hard. SmartAsset’s free tool matches you with up to three financial advisors who serve your area, and you can interview your advisor matches at no cost to decide which one is right for you.
Click here to match with up to 3 financial pros who would be excited to help you optimize your Social Security outcomes.
Have questions about retirement or personal finance? Email us at [email protected]!
By emailing your questions to 24/7 Wall St., you agree to have them published anonymously on a673b.bigscoots-temp.com.
By submitting your story, you understand and agree that we may use your story, or versions of it, in all media and platforms, including via third parties.
Thank you for reading! Have some feedback for us?
Contact the 24/7 Wall St. editorial team.