Special Report
Ohio Has Ranked Among the Worst States for Gun Crime for Over a Decade

Published:

Firearm sales have hit historic highs in the U.S. in recent years, and the ongoing proliferation of firearms may be fueling a rise in gun crime.
When firearms are recovered at a crime scene or taken from a suspect, they are often reported to the Bureau of Alcohol, Tobacco, Firearms, and Explosives for tracing. In these cases, the ATF assists in criminal investigations by using serial numbers and other markings to determine when and where a firearm was originally purchased — and over the last 12 years, firearm-related offenses have been taking up a growing share of federal resources.
Between 2010 and 2022, the number of guns traced by the ATF surged by 174%, from 145,600 to 399,400, climbing by anywhere from 3% to 18% in a single year. Most homicides in the U.S. are committed with a firearm, and over the same period, the national homicide rate climbed by over 50%.
While not all guns traced by the ATF were used in a crime — and not all firearms used for illicit purposes are traced — federal tracing data offers valuable insight into trends and geographic patterns related to gun violence in the United States.
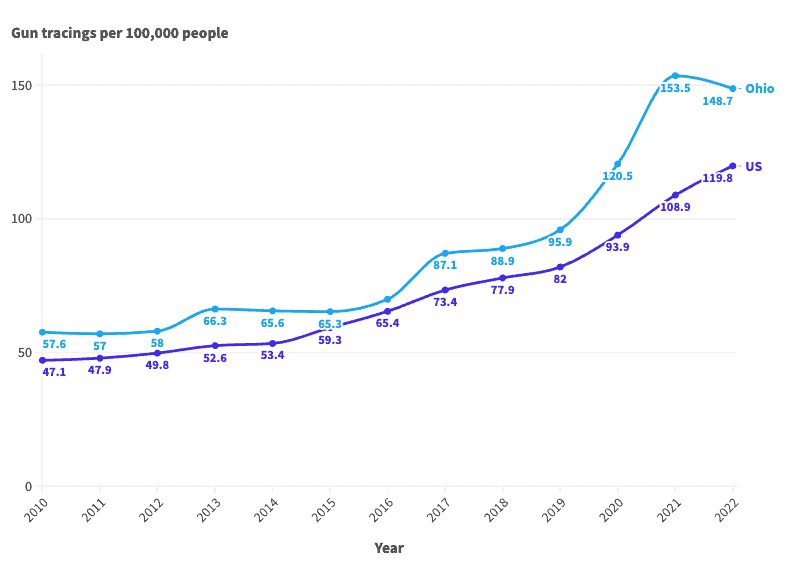
Mirroring the national trend, gun tracings are up sharply in Ohio. The ATF traced 17,477 seized firearms in the state in 2022, compared to 6,646 in 2010. Adjusting for population, gun crime has long been more common in Ohio than it is across the U.S. as a whole. In each of the last 13 years, the number of firearm tracings for every 100,000 people in the state was above the comparable national rate.
As of 2022, the most recent year of available data, the ATF traced 149 seized firearms for every 100,000 people in the state, the 12th highest gun-tracing rate among states.


| Year | Firearm tracings per 100,000 people in Ohio | Firearm tracings per 100,000 people in the US | Total firearms traced by the ATF in Ohio | Total firearms traced by the ATF in the US |
|---|---|---|---|---|
| 2022 | 148.7 | 119.8 | 17,477 | 399,397 |
| 2021 | 153.5 | 108.9 | 18,085 | 361,587 |
| 2020 | 120.5 | 93.9 | 14,072 | 306,686 |
| 2019 | 95.9 | 82.0 | 11,215 | 269,250 |
| 2018 | 88.9 | 77.9 | 10,391 | 254,700 |
| 2017 | 87.1 | 73.4 | 10,154 | 239,175 |
| 2016 | 69.9 | 65.4 | 8,115 | 211,384 |
| 2015 | 65.3 | 59.3 | 7,582 | 190,538 |
| 2014 | 65.6 | 53.4 | 7,602 | 170,344 |
| 2013 | 66.3 | 52.6 | 7,676 | 166,426 |
| 2012 | 58.0 | 49.8 | 6,700 | 156,346 |
| 2011 | 57.0 | 47.9 | 6,575 | 149,276 |
| 2010 | 57.6 | 47.1 | 6,646 | 145,604 |
After two decades of reviewing financial products I haven’t seen anything like this. Credit card companies are at war, handing out free rewards and benefits to win the best customers.
A good cash back card can be worth thousands of dollars a year in free money, not to mention other perks like travel, insurance, and access to fancy lounges.
Our top pick today pays up to 5% cash back, a $200 bonus on top, and $0 annual fee. Click here to apply before they stop offering rewards this generous.
Flywheel Publishing has partnered with CardRatings for our coverage of credit card products. Flywheel Publishing and CardRatings may receive a commission from card issuers.
Thank you for reading! Have some feedback for us?
Contact the 24/7 Wall St. editorial team.