Special Report

Tennessee Has Ranked Among the Worst States for Gun Crime for Over a Decade

Photo By Raymond Boyd / Getty Images

Firearm sales have hit historic highs in the U.S. in recent years, and the ongoing proliferation of firearms may be fueling a rise in gun crime.

When firearms are recovered at a crime scene or taken from a suspect, they are often reported to the Bureau of Alcohol, Tobacco, Firearms, and Explosives for tracing. In these cases, the ATF assists in criminal investigations by using serial numbers and other markings to determine when and where a firearm was originally purchased — and over the last 12 years, firearm-related offenses have been taking up a growing share of federal resources.

Between 2010 and 2022, the number of guns traced by the ATF surged by 174%, from 145,600 to 399,400, climbing by anywhere from 3% to 18% in a single year. Most homicides in the U.S. are committed with a firearm, and over the same period, the national homicide rate climbed by over 50%.

While not all guns traced by the ATF were used in a crime — and not all firearms used for illicit purposes are traced — federal tracing data offers valuable insight into trends and geographic patterns related to gun violence in the United States.

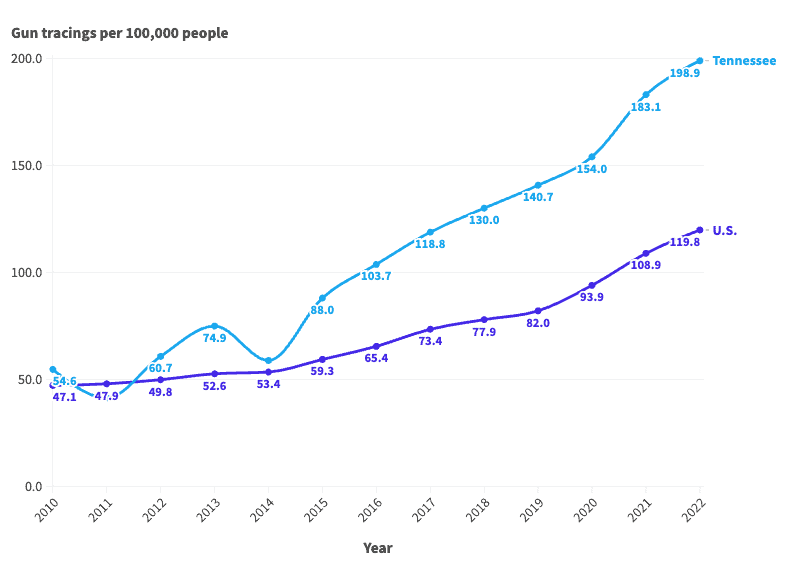
Mirroring the national trend, gun tracings are up sharply in Tennessee. The ATF traced 14,023 seized firearms in the state in 2022, compared to 3,469 in 2010. Adjusting for population, gun crime has long been more common in Tennessee than it is across the U.S. as a whole. In 12 of the last 13 years, the number of firearm tracings for every 100,000 people in the state was above the comparable national rate.

As of 2022, the most recent year of available data, the ATF traced 199 seized firearms for every 100,000 people in the state, the second highest gun-tracing rate among states.

2010: 3,469 firearms traced by the ATF

Mindaugas Dulinskas / iStock Editorial via Getty Images
  • Firearms traced by the ATF in Tennessee, 2010: 54.6 per 100,000 people (14th highest)
  • Firearms traced by the ATF nationwide, 2010: 47.1 per 100,000 people
  • Tennessee homicide rate, 2010: 5.6 per 100,000 people (13th highest)
  • U.S. homicide rate, 2010: 4.8 per 100,000 people

2011: 2,647 firearms traced by the ATF

Sean Pavone / iStock via Getty Images
  • Firearms traced by the ATF in Tennessee, 2011: 41.3 per 100,000 people (23rd highest)
  • Firearms traced by the ATF nationwide, 2011: 47.9 per 100,000 people
  • Tennessee homicide rate, 2011: 5.9 per 100,000 people (11th highest)
  • U.S. homicide rate, 2011: 4.7 per 100,000 people

2012: 3,920 firearms traced by the ATF

Jason Kempin / Getty Images Entertainment via Getty Images
  • Firearms traced by the ATF in Tennessee, 2012: 60.7 per 100,000 people (15th highest)
  • Firearms traced by the ATF nationwide, 2012: 49.8 per 100,000 people
  • Tennessee homicide rate, 2012: 6.2 per 100,000 people (8th highest)
  • U.S. homicide rate, 2012: 4.7 per 100,000 people

2013: 4,863 firearms traced by the ATF

Sean Pavone / iStock via Getty Images
  • Firearms traced by the ATF in Tennessee, 2013: 74.9 per 100,000 people (10th highest)
  • Firearms traced by the ATF nationwide, 2013: 52.6 per 100,000 people
  • Tennessee homicide rate, 2013: 5.2 per 100,000 people (15th highest)
  • U.S. homicide rate, 2013: 4.5 per 100,000 people

2014: 3,849 firearms traced by the ATF

Kruck20 / iStock via Getty Images
  • Firearms traced by the ATF in Tennessee, 2014: 58.8 per 100,000 people (19th highest)
  • Firearms traced by the ATF nationwide, 2014: 53.4 per 100,000 people
  • Tennessee homicide rate, 2014: 5.6 per 100,000 people (10th highest)
  • U.S. homicide rate, 2014: 4.4 per 100,000 people

2015: 5,811 firearms traced by the ATF

f11photo / iStock via Getty Images
  • Firearms traced by the ATF in Tennessee, 2015: 88.0 per 100,000 people (7th highest)
  • Firearms traced by the ATF nationwide, 2015: 59.3 per 100,000 people
  • Tennessee homicide rate, 2015: 6.3 per 100,000 people (10th highest)
  • U.S. homicide rate, 2015: 4.9 per 100,000 people

2016: 6,897 firearms traced by the ATF

Kruck20 / iStock via Getty Images
  • Firearms traced by the ATF in Tennessee, 2016: 103.7 per 100,000 people (5th highest)
  • Firearms traced by the ATF nationwide, 2016: 65.4 per 100,000 people
  • Tennessee homicide rate, 2016: 7.4 per 100,000 people (8th highest)
  • U.S. homicide rate, 2016: 5.4 per 100,000 people

2017: 7,981 firearms traced by the ATF

Jacob Boomsma / iStock via Getty Images
  • Firearms traced by the ATF in Tennessee, 2017: 118.8 per 100,000 people (3rd highest)
  • Firearms traced by the ATF nationwide, 2017: 73.4 per 100,000 people
  • Tennessee homicide rate, 2017: 8.0 per 100,000 people (8th highest)
  • U.S. homicide rate, 2017: 5.3 per 100,000 people

2018: 8,802 firearms traced by the ATF

Mindaugas Dulinskas / iStock Editorial via Getty Images
  • Firearms traced by the ATF in Tennessee, 2018: 130.0 per 100,000 people (2nd highest)
  • Firearms traced by the ATF nationwide, 2018: 77.9 per 100,000 people
  • Tennessee homicide rate, 2018: 7.5 per 100,000 people (6th highest)
  • U.S. homicide rate, 2018: 5.0 per 100,000 people

2019: 9,610 firearms traced by the ATF

Sean Pavone / iStock via Getty Images
  • Firearms traced by the ATF in Tennessee, 2019: 140.7 per 100,000 people (3rd highest)
  • Firearms traced by the ATF nationwide, 2019: 82.0 per 100,000 people
  • Tennessee homicide rate, 2019: 7.5 per 100,000 people (10th highest)
  • U.S. homicide rate, 2019: 5.1 per 100,000 people

2020: 10,427 firearms traced by the ATF

Jason Kempin / Getty Images Entertainment via Getty Images
  • Firearms traced by the ATF in Tennessee, 2020: 154.0 per 100,000 people (5th highest)
  • Firearms traced by the ATF nationwide, 2020: 93.9 per 100,000 people
  • Tennessee homicide rate, 2020: 9.6 per 100,000 people (6th highest)
  • U.S. homicide rate, 2020: 6.5 per 100,000 people

2021: 12,770 firearms traced by the ATF

Sean Pavone / iStock via Getty Images
  • Firearms traced by the ATF in Tennessee, 2021: 183.1 per 100,000 people (2nd highest)
  • Firearms traced by the ATF nationwide, 2021: 108.9 per 100,000 people
  • Tennessee homicide rate, 2021: 10.9 per 100,000 people
  • U.S. homicide rate, 2021: 7.7 per 100,000 people

2022: 14,023 firearms traced by the ATF

Kruck20 / iStock via Getty Images
  • Firearms traced by the ATF in Tennessee, 2022: 198.9 per 100,000 people (2nd highest)
  • Firearms traced by the ATF nationwide, 2022: 119.8 per 100,000 people
  • Tennessee homicide rate, 2022: 9.8 per 100,000 people (10th highest)
  • U.S. homicide rate, 2022: 7.3 per 100,000 people

Sam Stebbins / Courtesy of 24/7 Wall St.
Year Firearm tracings per 100,000 people in Tennessee Firearm tracings per 100,000 people in the US Total firearms traced by the ATF in Tennessee Total firearms traced by the ATF in the US
2022 198.9 119.8 14,023 399,397
2021 183.1 108.9 12,770 361,587
2020 154.0 93.9 10,427 306,686
2019 140.7 82.0 9,610 269,250
2018 130.0 77.9 8,802 254,700
2017 118.8 73.4 7,981 239,175
2016 103.7 65.4 6,897 211,384
2015 88.0 59.3 5,811 190,538
2014 58.8 53.4 3,849 170,344
2013 74.9 52.6 4,863 166,426
2012 60.7 49.8 3,920 156,346
2011 41.3 47.9 2,647 149,276
2010 54.6 47.1 3,469 145,604


Thank you for reading! Have some feedback for us?
Contact the 24/7 Wall St. editorial team.