Special Report
Where People From Washington Are Moving to the Most
Published:
Last Updated:

Even in the best possible circumstances, moving to a new home can be stressful. Perhaps in no small part for this reason, in recent decades Americans have become increasingly likely to stay put. Fewer than 30 million people moved within the U.S. in each of the last three years, compared to over 40 million per year for much of the 1980s and throughout the 1990s, according to the U.S. Census Bureau.
While a small minority of moves in the U.S. are necessitated by an eviction or natural disaster, most are voluntary — most often for reasons related to housing. These include wanting a larger home, a more affordable home, or a home in a better neighborhood. Other commonly cited explanations include work and family.
No matter the reason, most Americans do not have to go far to get what they want. Since record keeping began in 1948, over 60% of movers remained in the same county, and over 80% in the same state. Lately, however, a larger share of American movers are crossing state lines.
According to estimates from the Census Bureau’s American Community Survey, the number of Americans who moved to a different state has been steadily rising for over a decade. More than 8.2 million Americans moved to a different state in 2022, the most of any year since at least 2010.
The historic number of moves across state lines in 2022 was driven, in part, by moves out of Washington state. An estimated 257,800 Americans left Washington in 2022 for a different part of the country.
While reasons any given individual or family may decide to move are often personal, some circumstances unique to Washington may have pushed many out. For one, the overall cost of living in Washington is about 10% higher than the national average. Additionally, the typical home in Washington is worth $569,500, about $248,600 more than the national median — and proceeds from a home sale in the state would likely go much further in other housing markets.
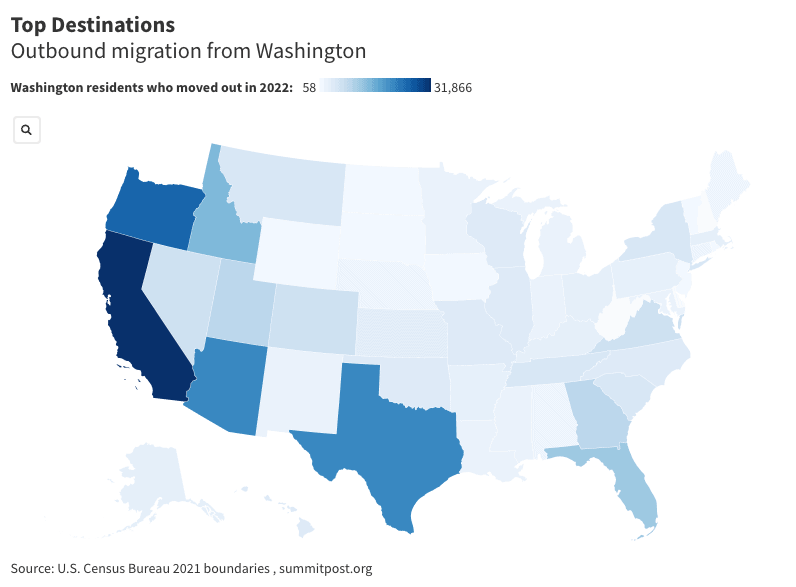
Some states are much more popular destinations for former-Washington residents than others. People from Washington moved to every state in the country in 2022, with the exception of West Virginia. Among the 48 remaining states and Washington, D.C., the influx of former-Washington residents ranged from about 60 to nearly 31,900.






















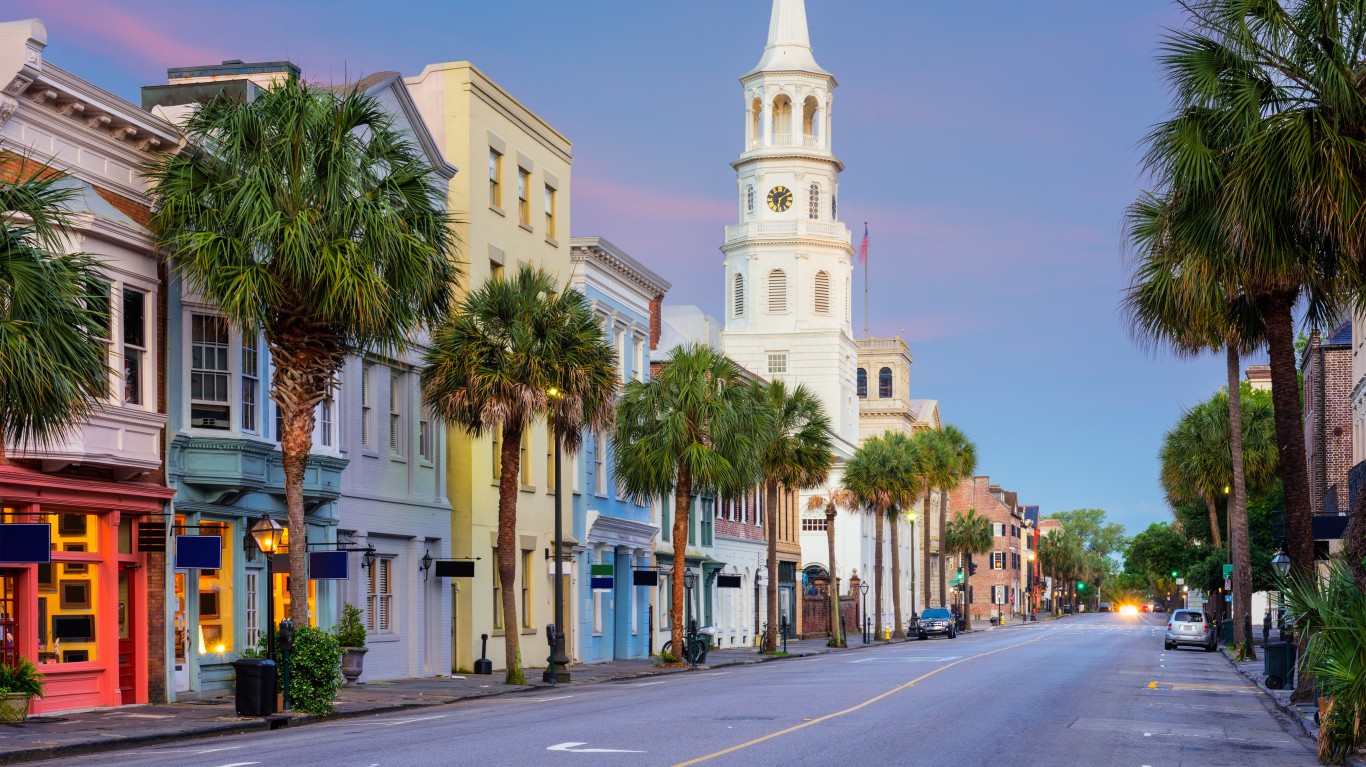


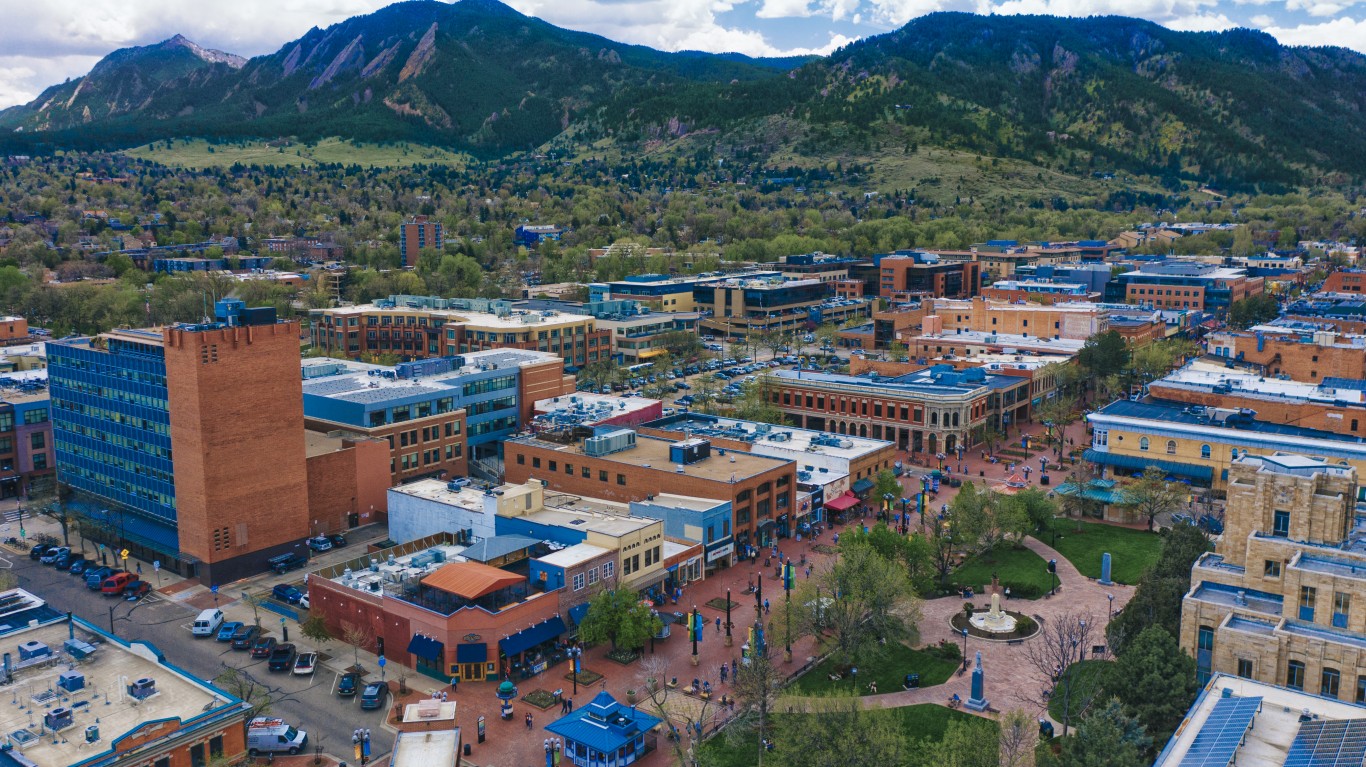




| Rank | Geography | New residents from Washington in 2022 | Share of all outbound moves from Washington in 2022 (%) | Share of all inbound moves from Washington in 2022 (%) |
|---|---|---|---|---|
| 50 | West Virginia | 0 | 0.00 | 0.00 |
| 49 | New Hampshire | 58 | 0.02 | 0.12 |
| 48 | Delaware | 171 | 0.07 | 0.37 |
| 47 | Vermont | 646 | 0.25 | 2.47 |
| 46 | Rhode Island | 662 | 0.26 | 1.64 |
| 45 | Iowa | 786 | 0.30 | 1.09 |
| 44 | South Dakota | 1,001 | 0.39 | 3.20 |
| 43 | North Dakota | 1,040 | 0.40 | 3.01 |
| 42 | New Jersey | 1,179 | 0.46 | 0.67 |
| 41 | District of Columbia | 1,216 | 0.47 | 1.89 |
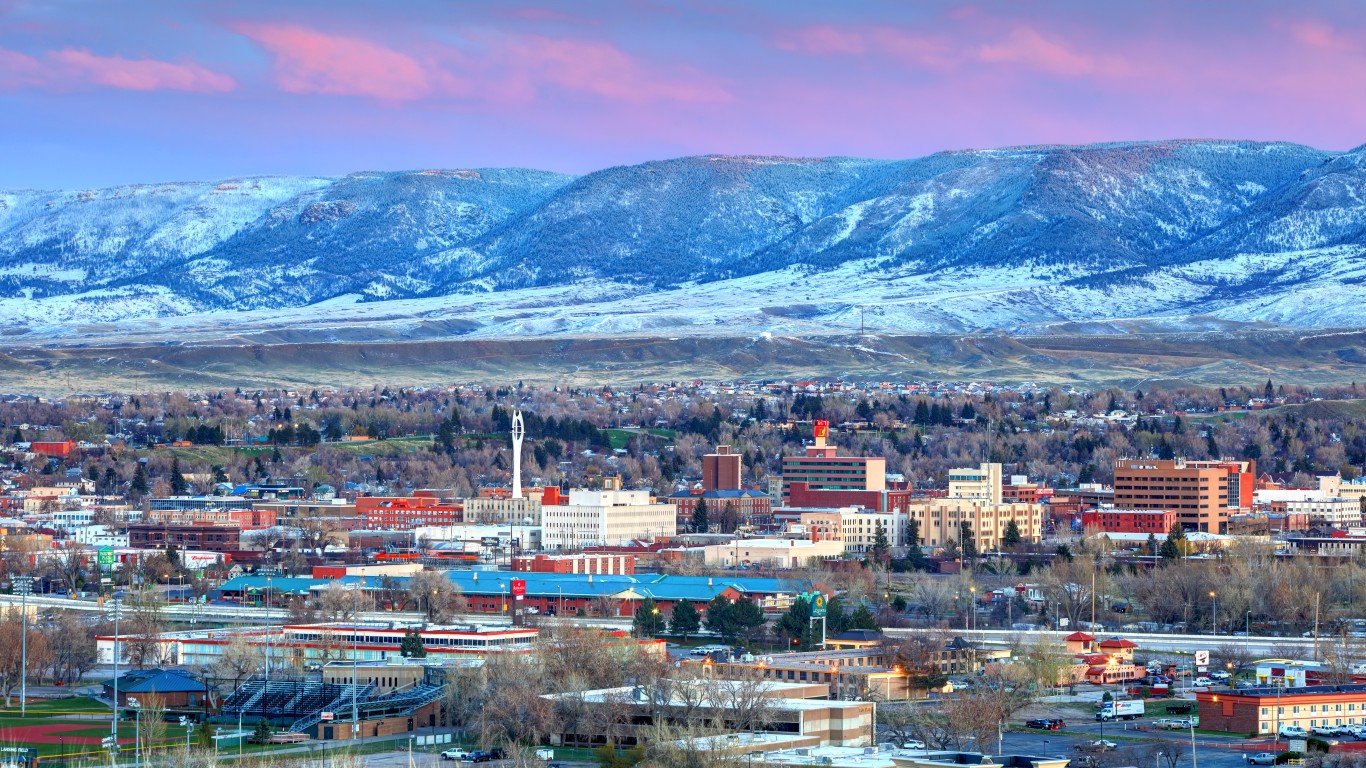
| 40 | Wyoming | 1,225 | 0.48 | 4.23 |
| 39 | Maine | 1,514 | 0.59 | 3.64 |
| 38 | Nebraska | 1,630 | 0.63 | 3.32 |
| 37 | Alabama | 1,639 | 0.64 | 1.18 |
| 36 | Connecticut | 1,670 | 0.65 | 1.15 |
| 35 | Maryland | 1,774 | 0.69 | 1.27 |
| 34 | Michigan | 1,983 | 0.77 | 1.26 |
| 33 | Louisiana | 2,021 | 0.78 | 2.68 |
| 32 | Mississippi | 2,090 | 0.81 | 2.99 |
| 31 | Minnesota | 2,255 | 0.87 | 1.93 |
| 30 | Indiana | 2,282 | 0.89 | 1.53 |
| 29 | New Mexico | 2,468 | 0.96 | 3.42 |
| 28 | Pennsylvania | 2,687 | 1.04 | 1.02 |
| 27 | Arkansas | 2,703 | 1.05 | 3.13 |
| 26 | Ohio | 2,929 | 1.14 | 1.46 |
| 25 | Massachusetts | 3,006 | 1.17 | 1.76 |
| 24 | Alaska | 3,076 | 1.19 | 8.41 |
| 23 | Kentucky | 3,235 | 1.25 | 2.86 |
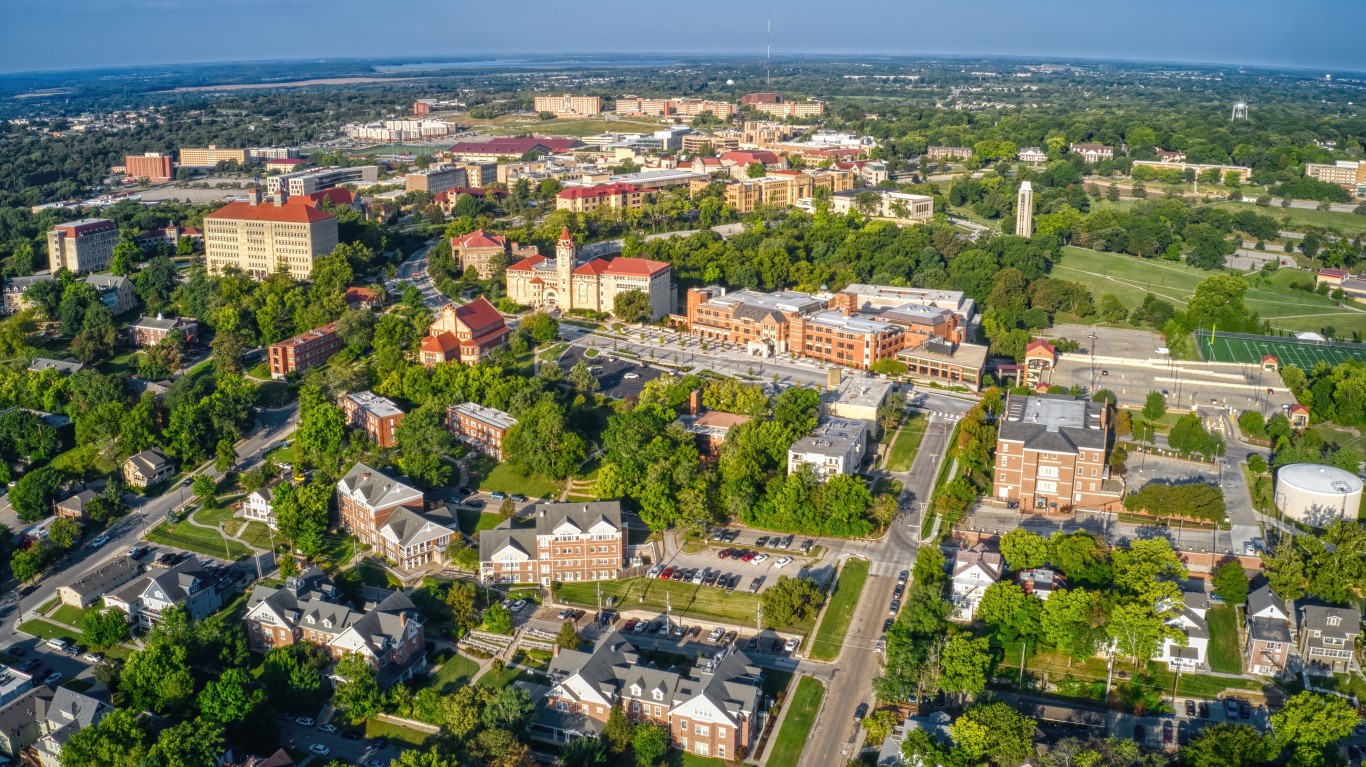
| 22 | Kansas | 3,475 | 1.35 | 3.69 |
| 21 | Oklahoma | 3,811 | 1.48 | 3.24 |
| 20 | North Carolina | 3,962 | 1.54 | 1.16 |
| 19 | Illinois | 3,965 | 1.54 | 1.74 |
| 18 | Hawaii | 4,090 | 1.59 | 7.28 |
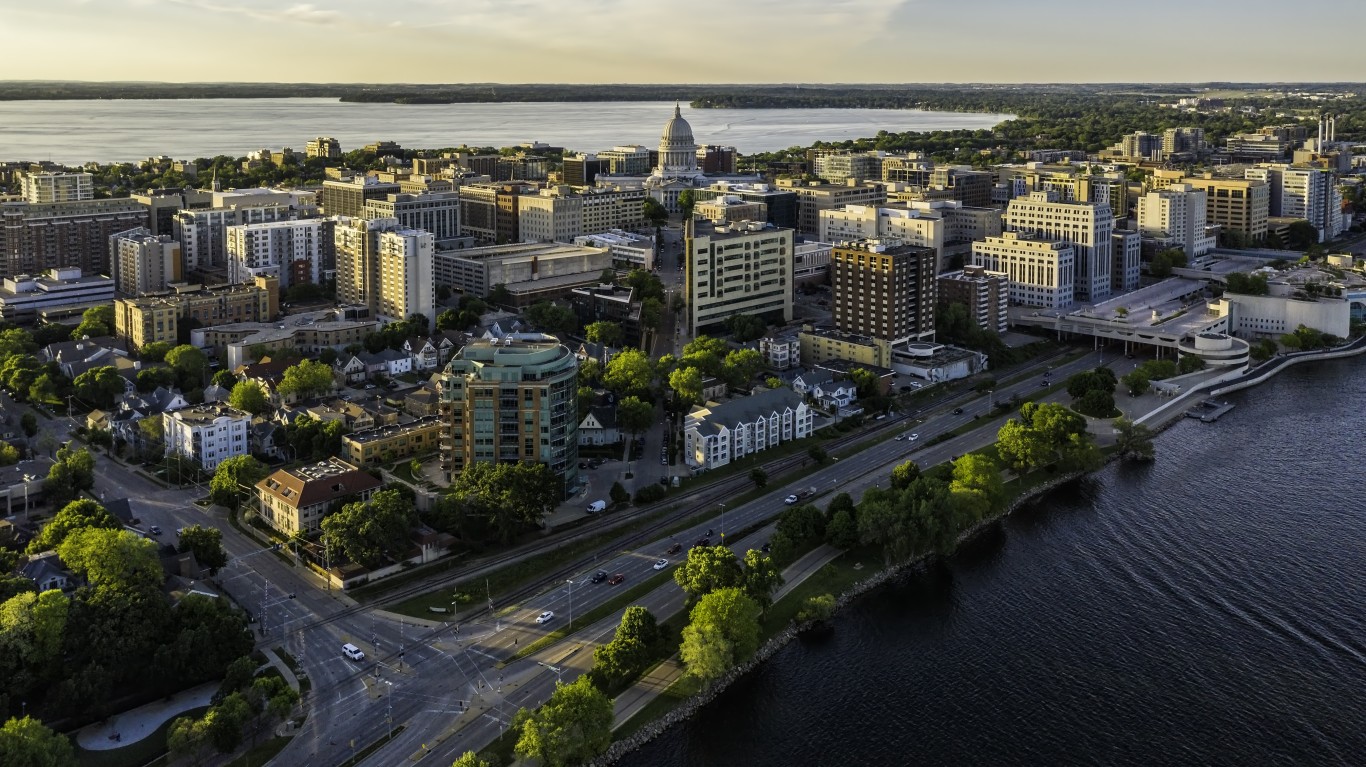
| 17 | Wisconsin | 4,207 | 1.63 | 3.49 |
| 16 | Missouri | 4,333 | 1.68 | 2.65 |
| 15 | Tennessee | 4,661 | 1.81 | 2.06 |
| 14 | New York | 4,683 | 1.82 | 1.55 |
| 13 | South Carolina | 5,097 | 1.98 | 2.32 |
| 12 | Montana | 5,225 | 2.03 | 10.85 |
| 11 | Nevada | 6,212 | 2.41 | 4.88 |
| 10 | Colorado | 6,796 | 2.64 | 2.96 |
| 9 | Virginia | 6,877 | 2.67 | 2.58 |
| 8 | Georgia | 8,761 | 3.40 | 2.67 |
| 7 | Utah | 8,845 | 3.43 | 9.68 |
| 6 | Florida | 11,804 | 4.58 | 1.60 |
| 5 | Idaho | 14,387 | 5.58 | 16.36 |
| 4 | Texas | 21,083 | 8.18 | 3.15 |
| 3 | Arizona | 21,242 | 8.24 | 7.51 |
| 2 | Oregon | 25,457 | 9.88 | 19.83 |
| 1 | California | 31,866 | 12.36 | 6.70 |
The thought of burdening your family with a financial disaster is most Americans’ nightmare. However, recent studies show that over 100 million Americans still don’t have proper life insurance in the event they pass away.
Life insurance can bring peace of mind – ensuring your loved ones are safeguarded against unforeseen expenses and debts. With premiums often lower than expected and a variety of plans tailored to different life stages and health conditions, securing a policy is more accessible than ever.
A quick, no-obligation quote can provide valuable insight into what’s available and what might best suit your family’s needs. Life insurance is a simple step you can take today to help secure peace of mind for your loved ones tomorrow.
Click here to learn how to get a quote in just a few minutes.
Thank you for reading! Have some feedback for us?
Contact the 24/7 Wall St. editorial team.