
Many of the most commonly cited economic indicators — including unemployment, gross domestic product, and industrial output — are useful gauges of prosperity and productive capacity at the national level. But when it comes to determining overall quality of life in a given country, any single social or economic metric inevitably falls short.
In the absence of a comprehensive measure of financial and social well-being across broad populations, the United Nations Development Programme created the Human Development Index, or HDI. The HDI has three main components — life expectancy at birth, educational attainment, and financial stability. When combined, these indicators offer insight into living standards for individuals within a given country or region.
According to the latest HDI report, the United States ranks 21st, behind Australia, Canada, and several European and Asian countries. But while the U.S. as a whole trails many other highly developed parts of the world, in communities across the country, overall quality of life is on par with the highest ranking nations in the HDI report. (This is how America’s 20 richest cities compare to China’s.)
Using an index inspired by the HDI, 24/7 Wall St. identified the best county or county equivalent to live in in each state. Counties are ranked on a combination of three measures – average life expectancy at birth, the share of adults with a bachelor’s degree, and the poverty rate. Data used to calculate rankings are five-year averages from the U.S. Census Bureau’s 2022 American Community Survey and County Health Rankings & Roadmaps, a joint program of the Robert Wood Johnson Foundation and the University of Wisconsin Population Health Institute. Due to recent changes in county distinctions, all ACS data for Connecticut is current as of 2021. Counties with incomplete data were excluded from analysis.
Nationwide, 34.3% of adults have a bachelor’s degree or higher, 12.5% of the population live below the poverty line, and average life expectancy at birth stands at 78.5 years. In the vast majority of states – even those where these indicators lag well behind the national average – there is at least one county, or county equivalent, where the population is healthier, better educated, and more financially secure than the U.S. population as a whole.
While independent of one another, the measures used to calculate this ranking are strongly correlated. Americans with a college education are far less likely to experience poverty in their lifetime than those with lower educational attainment. Additionally, well-educated and financially secure populations also tend to report better health outcomes.
In all but four of these places, the median household income exceeds the comparable statewide median, often by tens of thousands of dollars a year. (Here is a look at the richest city in every state.)
Alabama: Shelby County
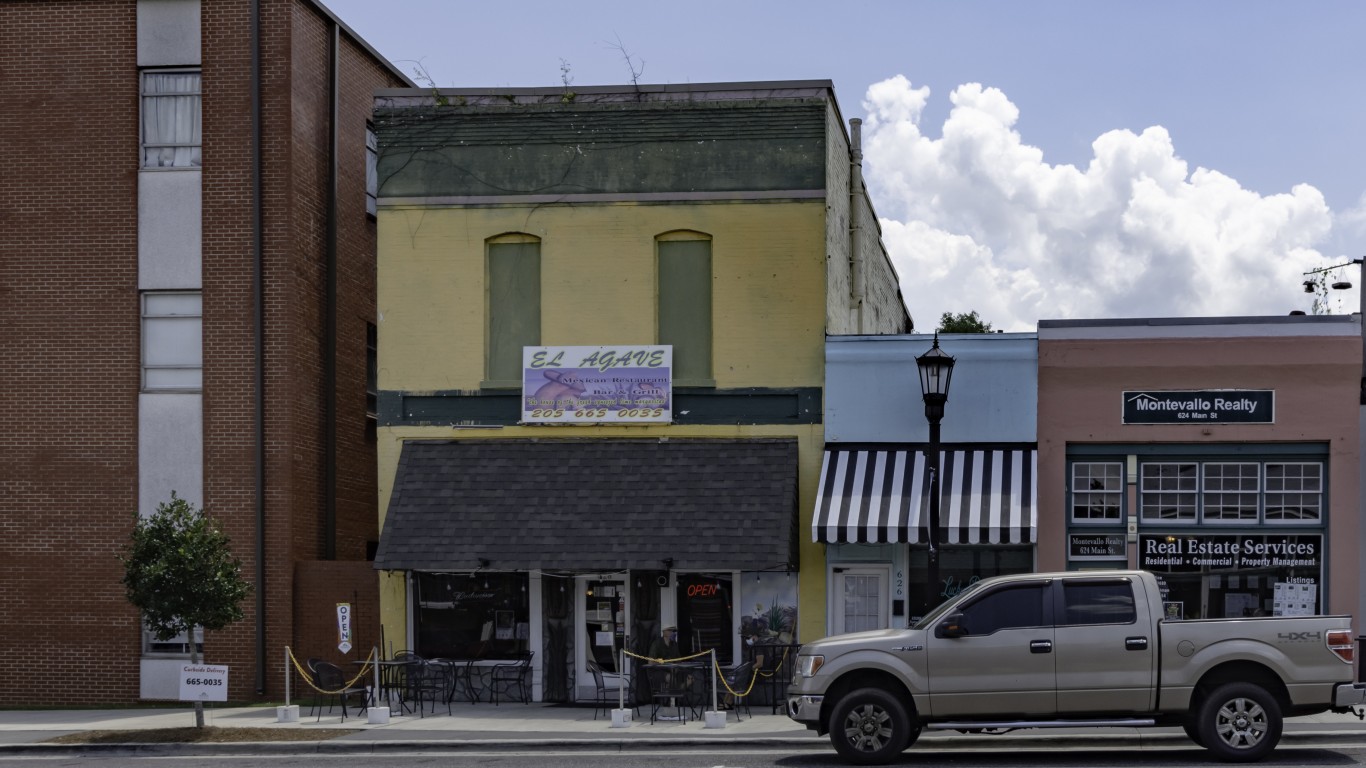
- Avg. life expectancy at birth: 80.3 years (state: 74.8 years)
- Poverty rate: 6.9% (state: 15.7%)
- Adults with a bachelor’s degree: 45.6% (state: 27.2%)
- Median household income: $90,618 (state: $59,609)
- County seat: Columbiana
- Counties considered in state: 67
Alaska: Aleutians East Borough

- Avg. life expectancy at birth: 100+ years (state: 78.6 years)
- Poverty rate: 12.6% (state: 10.5%)
- Adults with a bachelor’s degree: 16.9% (state: 30.7%)
- Median household income: $79,961 (state: $86,370)
- County seat: Sand Point
- Counties considered in state: 24
Arizona: Maricopa County

- Avg. life expectancy at birth: 79.6 years (state: 79.1 years)
- Poverty rate: 11.5% (state: 13.1%)
- Adults with a bachelor’s degree: 35.0% (state: 31.8%)
- Median household income: $80,675 (state: $72,581)
- County seat: Phoenix
- Counties considered in state: 15
Arkansas: Benton County

- Avg. life expectancy at birth: 79.5 years (state: 75.5 years)
- Poverty rate: 7.9% (state: 16.2%)
- Adults with a bachelor’s degree: 35.5% (state: 24.7%)
- Median household income: $85,269 (state: $56,335)
- County seat: Bentonville
- Counties considered in state: 75
California: Marin County

- Avg. life expectancy at birth: 85.3 years (state: 81.0 years)
- Poverty rate: 7.0% (state: 12.1%)
- Adults with a bachelor’s degree: 61.1% (state: 35.9%)
- Median household income: $142,019 (state: $91,905)
- County seat: San Rafael
- Counties considered in state: 57
Colorado: Pitkin County

- Avg. life expectancy at birth: 92.5 years (state: 80.0 years)
- Poverty rate: 6.7% (state: 9.6%)
- Adults with a bachelor’s degree: 63.1% (state: 43.7%)
- Median household income: $96,123 (state: $87,598)
- County seat: Aspen
- Counties considered in state: 59
Connecticut: Fairfield County

- Avg. life expectancy at birth: 82.1 years (state: 80.1 years)
- Poverty rate: 9.2% (state: 10.1%)
- Adults with a bachelor’s degree: 49.2% (state: 41.4%)
- Median household income: $101,194 (state: $90,213)
- County seat: None
- County equivalents considered in state: 8
Delaware: New Castle County
- Avg. life expectancy at birth: 77.9 years (state: 78.0 years)
- Poverty rate: 10.5% (state: 11.1%)
- Adults with a bachelor’s degree: 38.3% (state: 34.5%)
- Median household income: $85,309 (state: $79,325)
- County seat: Wilmington
- Counties considered in state: 3
Florida: St. Johns County

- Avg. life expectancy at birth: 81.9 years (state: 79.7 years)
- Poverty rate: 6.8% (state: 12.9%)
- Adults with a bachelor’s degree: 47.4% (state: 32.3%)
- Median household income: $100,020 (state: $67,917)
- County seat: St. Augustine
- Counties considered in state: 67
Georgia: Forsyth County
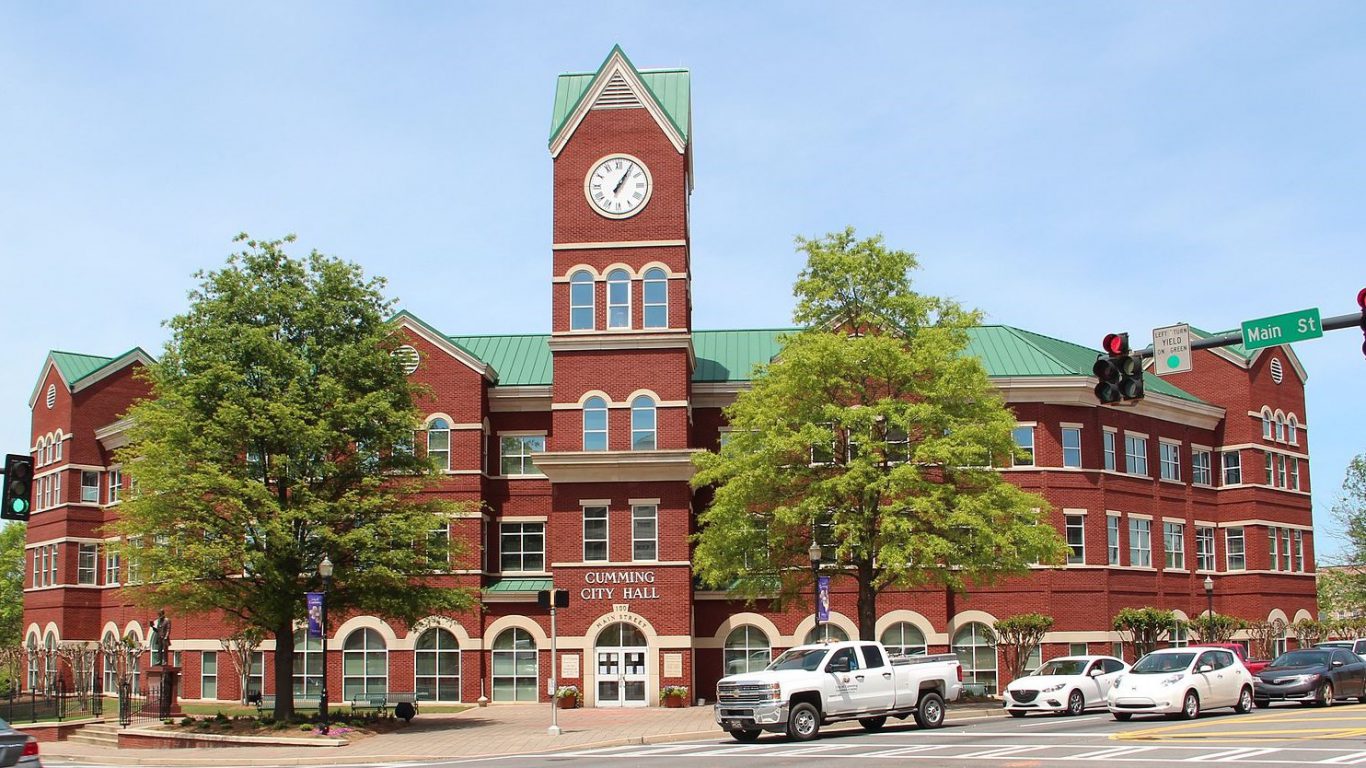
- Avg. life expectancy at birth: 82.3 years (state: 77.3 years)
- Poverty rate: 4.6% (state: 13.5%)
- Adults with a bachelor’s degree: 56.2% (state: 33.6%)
- Median household income: $131,660 (state: $71,355)
- County seat: Cumming
- Counties considered in state: 158
Hawaii: Honolulu County

- Avg. life expectancy at birth: 82.4 years (state: 82.3 years)
- Poverty rate: 8.8% (state: 9.6%)
- Adults with a bachelor’s degree: 36.6% (state: 34.7%)
- Median household income: $99,816 (state: $94,814)
- County seat: Honolulu
- Counties considered in state: 4
Idaho: Blaine County

- Avg. life expectancy at birth: 85.3 years (state: 79.2 years)
- Poverty rate: 6.9% (state: 11.0%)
- Adults with a bachelor’s degree: 44.5% (state: 30.2%)
- Median household income: $81,794 (state: $70,214)
- County seat: Hailey
- Counties considered in state: 42
Illinois: DuPage County
- Avg. life expectancy at birth: 81.9 years (state: 78.6 years)
- Poverty rate: 6.3% (state: 11.8%)
- Adults with a bachelor’s degree: 51.1% (state: 36.7%)
- Median household income: $107,035 (state: $78,433)
- County seat: Wheaton
- Counties considered in state: 102
Indiana: Hamilton County

- Avg. life expectancy at birth: 81.6 years (state: 76.5 years)
- Poverty rate: 4.2% (state: 12.3%)
- Adults with a bachelor’s degree: 60.8% (state: 28.2%)
- Median household income: $114,866 (state: $67,173)
- County seat: Noblesville
- Counties considered in state: 92
Iowa: Dallas County
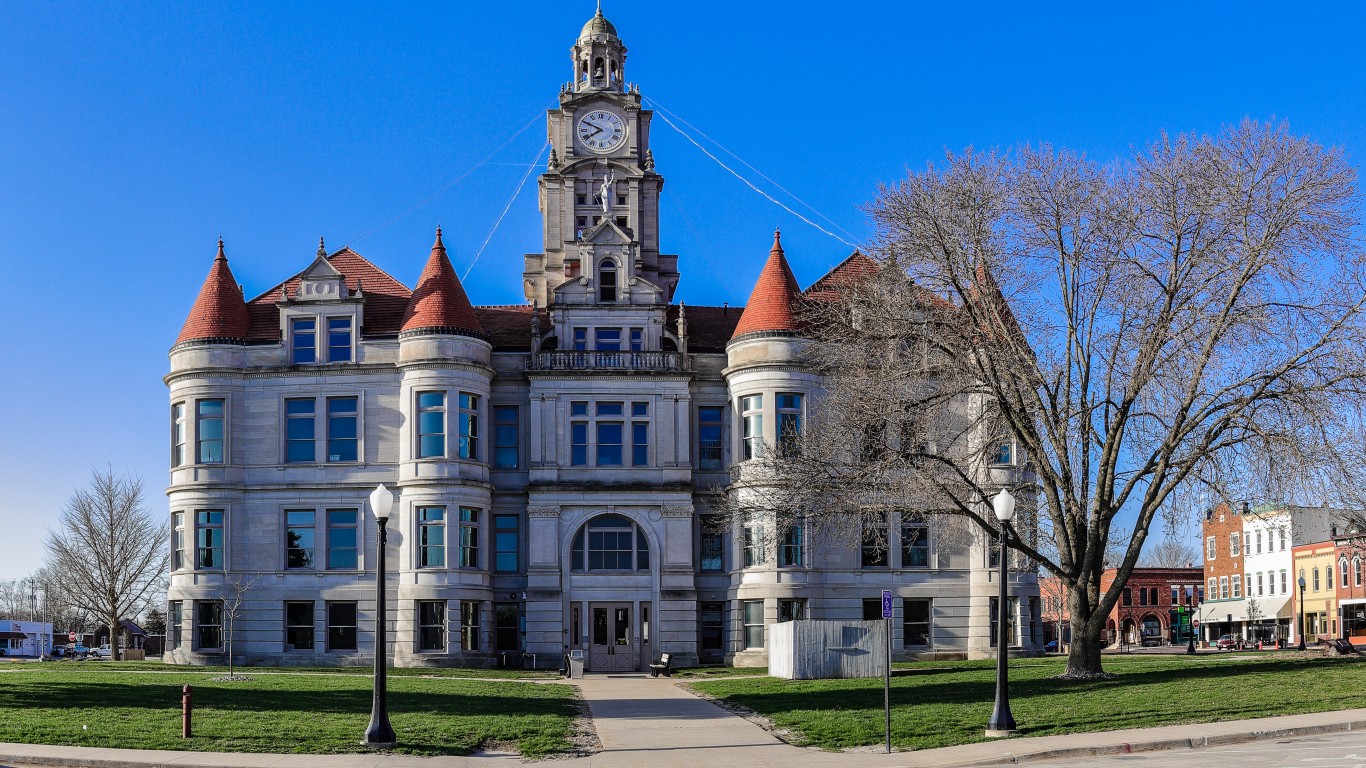
- Avg. life expectancy at birth: 81.8 years (state: 78.7 years)
- Poverty rate: 5.7% (state: 11.1%)
- Adults with a bachelor’s degree: 51.5% (state: 30.3%)
- Median household income: $99,533 (state: $70,571)
- County seat: Adel
- Counties considered in state: 99
Kansas: Johnson County

- Avg. life expectancy at birth: 81.4 years (state: 77.8 years)
- Poverty rate: 5.3% (state: 11.6%)
- Adults with a bachelor’s degree: 56.7% (state: 34.7%)
- Median household income: $103,644 (state: $69,747)
- County seat: Olathe
- Counties considered in state: 102
Kentucky: Oldham County

- Avg. life expectancy at birth: 79.8 years (state: 75.1 years)
- Poverty rate: 4.0% (state: 16.1%)
- Adults with a bachelor’s degree: 45.4% (state: 26.5%)
- Median household income: $117,334 (state: $60,183)
- County seat: La Grange
- Counties considered in state: 120
Louisiana: St. Tammany Parish

- Avg. life expectancy at birth: 77.8 years (state: 75.2 years)
- Poverty rate: 11.7% (state: 18.7%)
- Adults with a bachelor’s degree: 36.4% (state: 26.1%)
- Median household income: $76,914 (state: $57,852)
- Parish seat: Covington
- Parishes considered in state: 64
Maine: Cumberland County

- Avg. life expectancy at birth: 80.2 years (state: 78.6 years)
- Poverty rate: 7.2% (state: 10.9%)
- Adults with a bachelor’s degree: 50.6% (state: 34.1%)
- Median household income: $87,710 (state: $68,251)
- County seat: Portland
- Counties considered in state: 16
Maryland: Howard County

- Avg. life expectancy at birth: 82.7 years (state: 78.6 years)
- Poverty rate: 5.4% (state: 9.3%)
- Adults with a bachelor’s degree: 64.0% (state: 42.2%)
- Median household income: $140,971 (state: $98,461)
- County seat: Ellicott City
- Counties considered in state: 24
Massachusetts: Nantucket County

- Avg. life expectancy at birth: 83.0 years (state: 80.2 years)
- Poverty rate: 4.9% (state: 9.9%)
- Adults with a bachelor’s degree: 57.4% (state: 45.9%)
- Median household income: $135,590 (state: $96,505)
- County seat: Nantucket
- Counties considered in state: 14
Michigan: Leelanau County

- Avg. life expectancy at birth: 82.3 years (state: 77.5 years)
- Poverty rate: 6.7% (state: 13.1%)
- Adults with a bachelor’s degree: 48.6% (state: 31.1%)
- Median household income: $82,345 (state: $68,505)
- County seat: Suttons Bay Township
- Counties considered in state: 83
Minnesota: Carver County

- Avg. life expectancy at birth: 83.2 years (state: 80.4 years)
- Poverty rate: 3.8% (state: 9.3%)
- Adults with a bachelor’s degree: 49.8% (state: 38.2%)
- Median household income: $116,308 (state: $84,313)
- County seat: Chaska
- Counties considered in state: 87
Mississippi: Madison County

- Avg. life expectancy at birth: 76.1 years (state: 73.9 years)
- Poverty rate: 9.8% (state: 19.2%)
- Adults with a bachelor’s degree: 49.5% (state: 23.9%)
- Median household income: $79,105 (state: $52,985)
- County seat: Canton
- Counties considered in state: 81
Missouri: St. Charles County
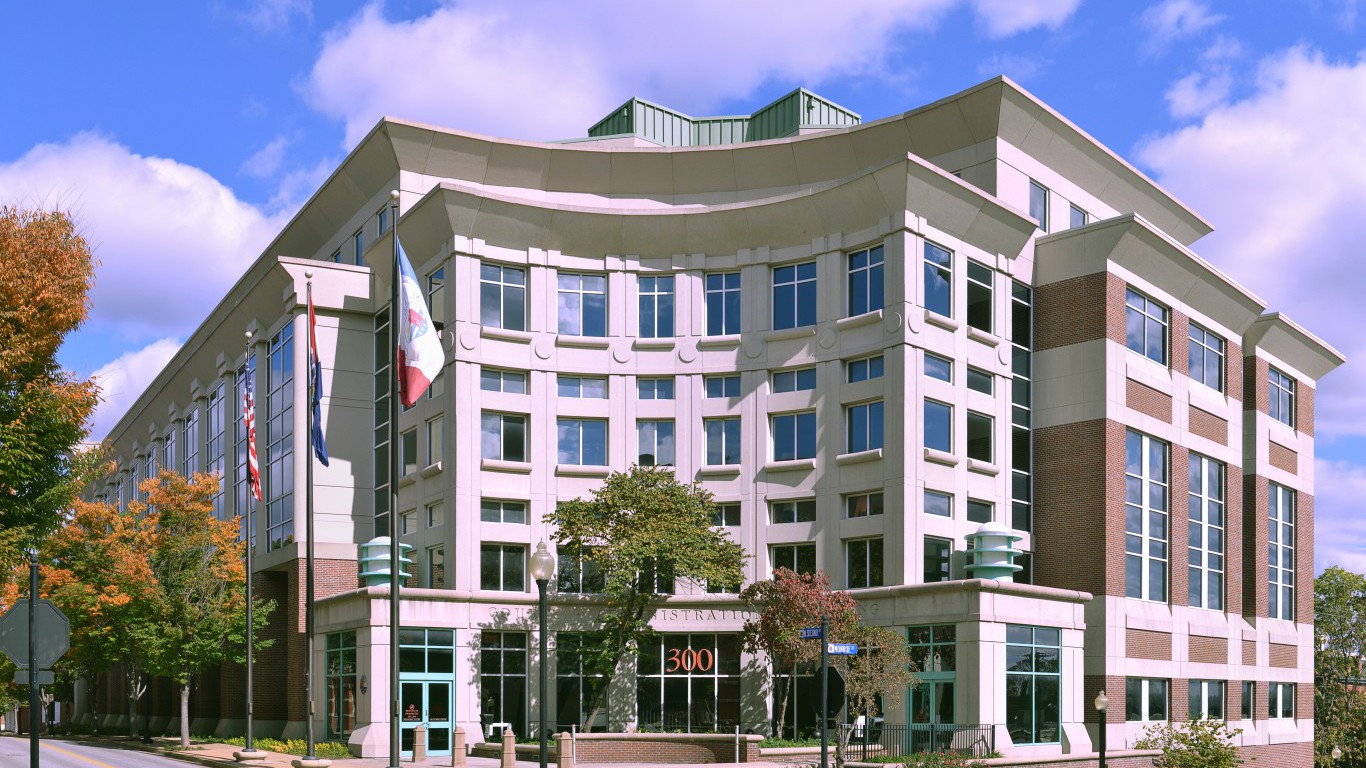
- Avg. life expectancy at birth: 79.6 years (state: 76.6 years)
- Poverty rate: 4.5% (state: 12.8%)
- Adults with a bachelor’s degree: 42.0% (state: 31.2%)
- Median household income: $99,596 (state: $65,920)
- County seat: St. Charles
- Counties considered in state: 115
Montana: Gallatin County

- Avg. life expectancy at birth: 82.7 years (state: 78.4 years)
- Poverty rate: 10.6% (state: 12.4%)
- Adults with a bachelor’s degree: 52.9% (state: 34.0%)
- Median household income: $83,434 (state: $66,341)
- County seat: Bozeman
- Counties considered in state: 48
Nebraska: Sarpy County

- Avg. life expectancy at birth: 80.7 years (state: 79.0 years)
- Poverty rate: 5.5% (state: 10.4%)
- Adults with a bachelor’s degree: 41.2% (state: 33.5%)
- Median household income: $95,911 (state: $71,722)
- County seat: Papillion
- Counties considered in state: 79
Nevada: Storey County

- Avg. life expectancy at birth: 82.9 years (state: 78.1 years)
- Poverty rate: 9.1% (state: 12.7%)
- Adults with a bachelor’s degree: 31.4% (state: 26.5%)
- Median household income: $86,932 (state: $71,646)
- County seat: Virginia City
- Counties considered in state: 16
New Hampshire: Rockingham County

- Avg. life expectancy at birth: 80.8 years (state: 79.6 years)
- Poverty rate: 4.8% (state: 7.3%)
- Adults with a bachelor’s degree: 43.6% (state: 39.0%)
- Median household income: $110,225 (state: $90,845)
- County seat: Brentwood
- Counties considered in state: 10
New Jersey: Hunterdon County
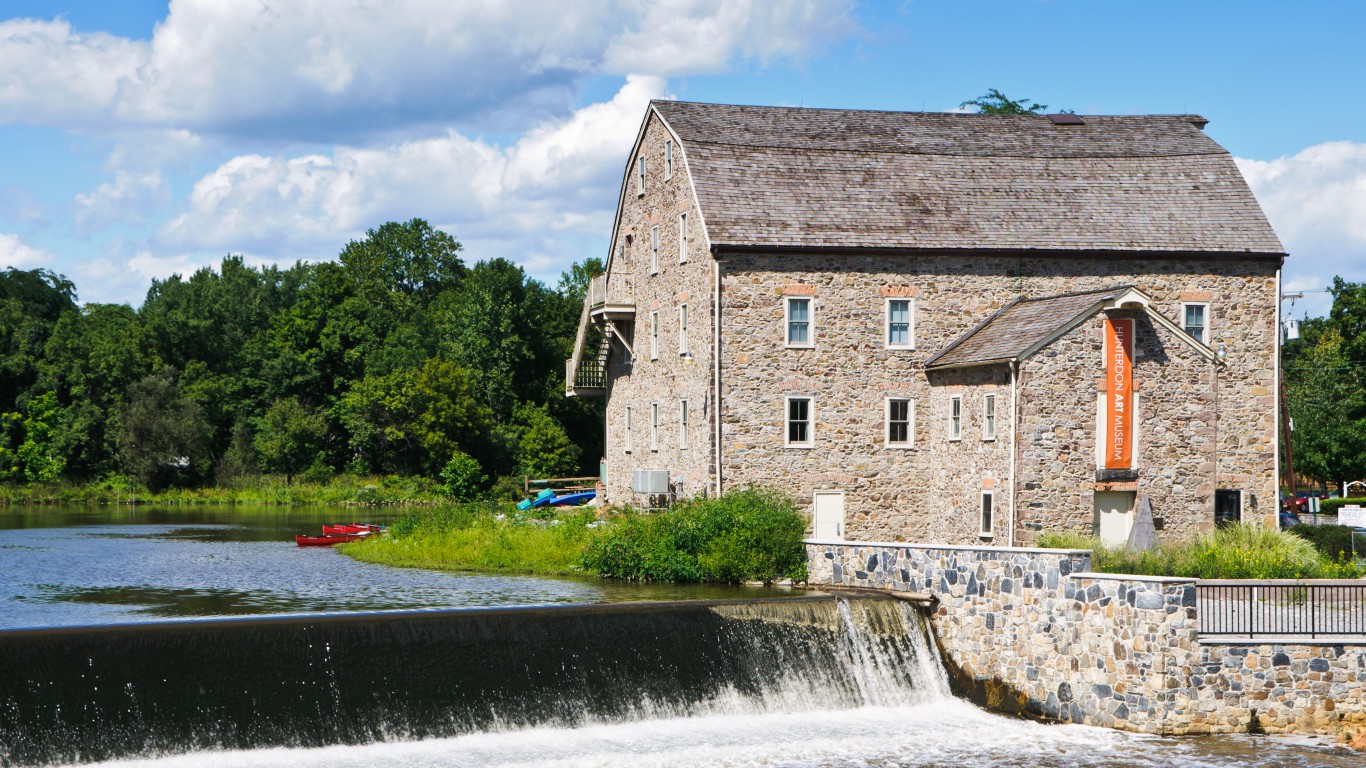
- Avg. life expectancy at birth: 83.2 years (state: 79.5 years)
- Poverty rate: 3.7% (state: 9.7%)
- Adults with a bachelor’s degree: 55.5% (state: 42.3%)
- Median household income: $133,534 (state: $97,126)
- County seat: Flemington
- Counties considered in state: 21
New Mexico: Los Alamos County

- Avg. life expectancy at birth: 83.9 years (state: 76.9 years)
- Poverty rate: 3.7% (state: 18.3%)
- Adults with a bachelor’s degree: 69.7% (state: 29.1%)
- Median household income: $135,801 (state: $58,722)
- County seat: Los Alamos
- Counties considered in state: 32
New York: New York County

- Avg. life expectancy at birth: 83.7 years (state: 80.3 years)
- Poverty rate: 15.8% (state: 13.6%)
- Adults with a bachelor’s degree: 62.8% (state: 38.8%)
- Median household income: $99,880 (state: $81,386)
- County seat: Manhattan
- Counties considered in state: 62
North Carolina: Orange County

- Avg. life expectancy at birth: 82.1 years (state: 77.7 years)
- Poverty rate: 12.3% (state: 13.3%)
- Adults with a bachelor’s degree: 61.7% (state: 33.9%)
- Median household income: $85,785 (state: $66,186)
- County seat: Hillsborough
- Counties considered in state: 100
North Dakota: Cass County
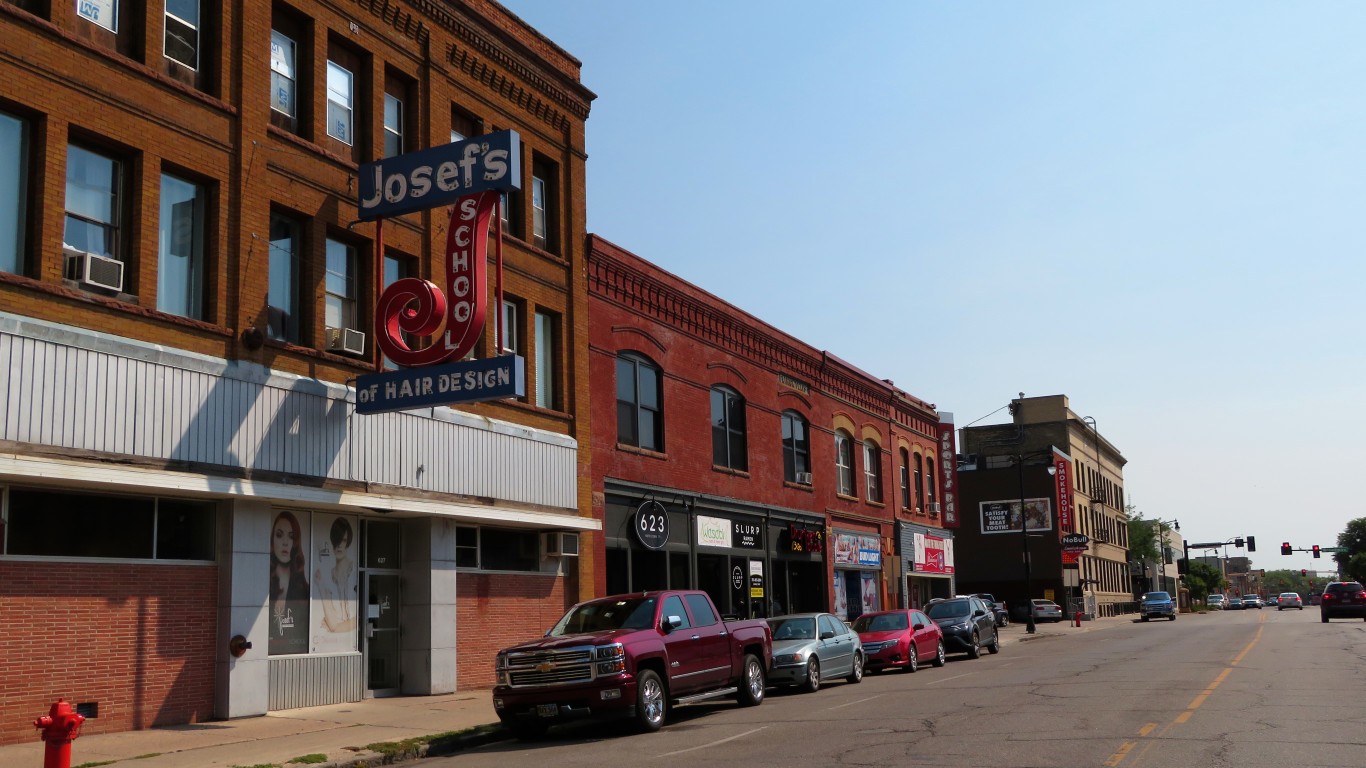
- Avg. life expectancy at birth: 79.9 years (state: 78.8 years)
- Poverty rate: 10.8% (state: 10.8%)
- Adults with a bachelor’s degree: 42.6% (state: 31.4%)
- Median household income: $73,249 (state: $73,959)
- County seat: Fargo
- Counties considered in state: 50
Ohio: Delaware County
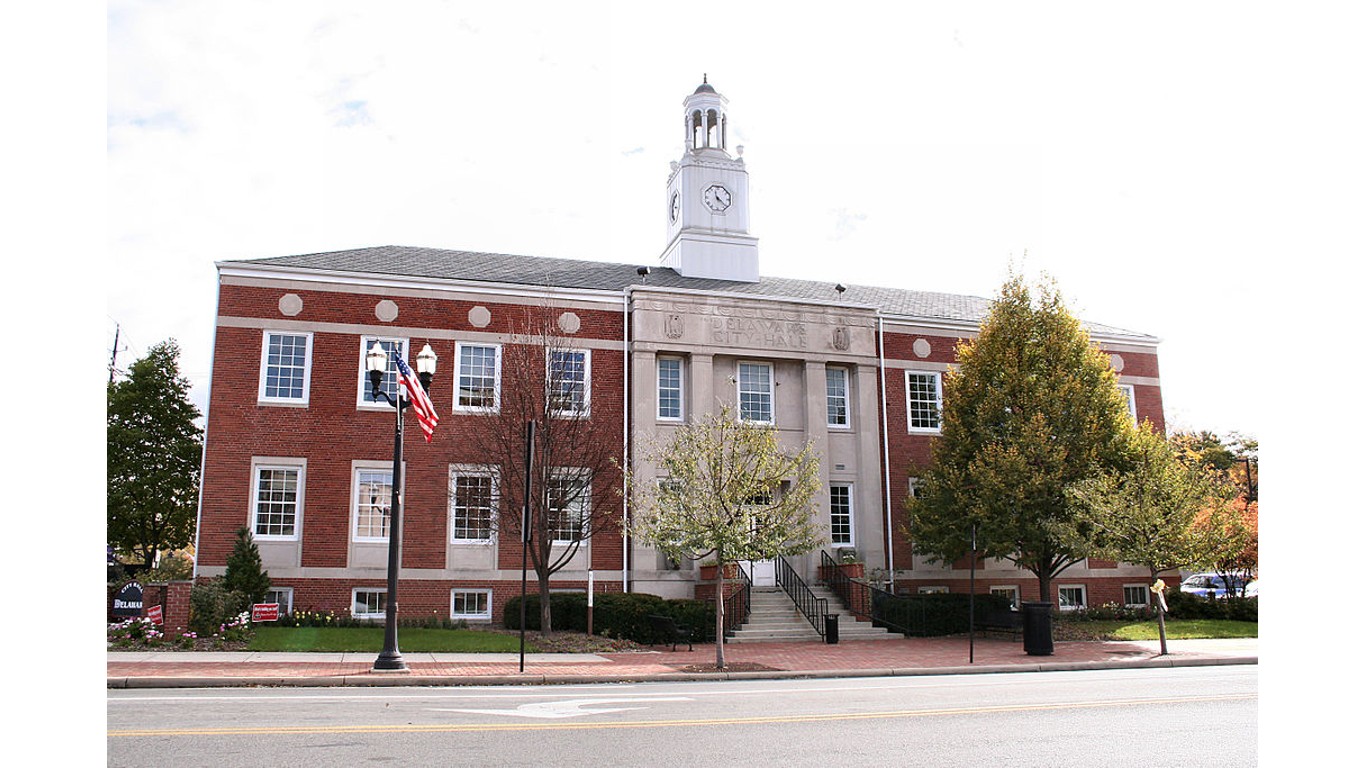
- Avg. life expectancy at birth: 81.7 years (state: 76.5 years)
- Poverty rate: 4.5% (state: 13.3%)
- Adults with a bachelor’s degree: 57.4% (state: 30.4%)
- Median household income: $123,995 (state: $66,990)
- County seat: Delaware
- Counties considered in state: 88
Oklahoma: Cimarron County

- Avg. life expectancy at birth: 81.8 years (state: 75.5 years)
- Poverty rate: 10.9% (state: 15.2%)
- Adults with a bachelor’s degree: 31.7% (state: 27.3%)
- Median household income: $57,100 (state: $61,364)
- County seat: Boise City
- Counties considered in state: 77
Oregon: Washington County

- Avg. life expectancy at birth: 82.7 years (state: 79.7 years)
- Poverty rate: 8.2% (state: 11.9%)
- Adults with a bachelor’s degree: 45.8% (state: 35.5%)
- Median household income: $100,121 (state: $76,632)
- County seat: Hillsboro
- Counties considered in state: 35
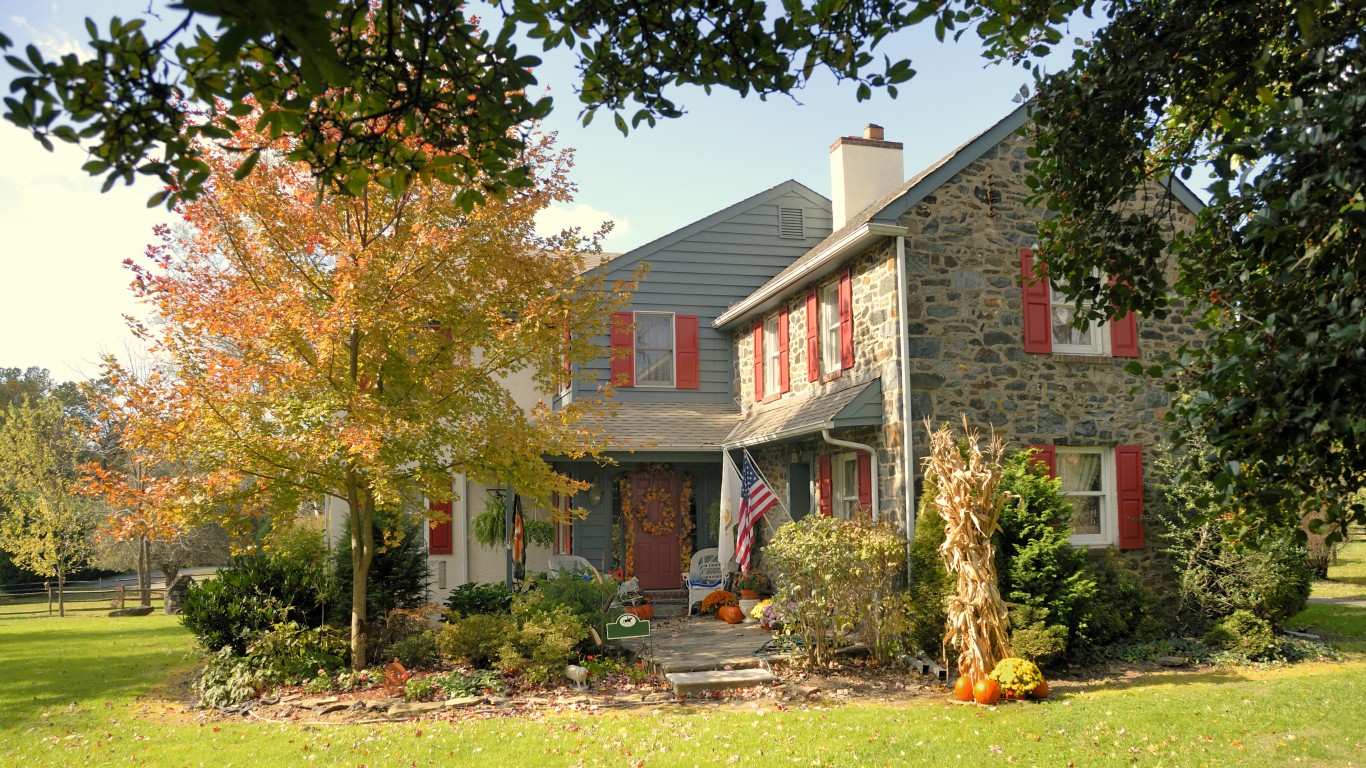
Pennsylvania: Chester County

- Avg. life expectancy at birth: 81.2 years (state: 78.0 years)
- Poverty rate: 6.0% (state: 11.8%)
- Adults with a bachelor’s degree: 56.1% (state: 33.8%)
- Median household income: $118,574 (state: $73,170)
- County seat: West Chester
- Counties considered in state: 67
Rhode Island: Newport County

- Avg. life expectancy at birth: 82.0 years (state: 79.4 years)
- Poverty rate: 7.8% (state: 11.2%)
- Adults with a bachelor’s degree: 52.1% (state: 36.3%)
- Median household income: $96,319 (state: $81,370)
- County seat: Newport
- Counties considered in state: 5
South Carolina: Beaufort County

- Avg. life expectancy at birth: 82.6 years (state: 76.4 years)
- Poverty rate: 10.4% (state: 14.4%)
- Adults with a bachelor’s degree: 43.4% (state: 30.6%)
- Median household income: $81,260 (state: $63,623)
- County seat: Beaufort
- Counties considered in state: 46
South Dakota: Stanley County
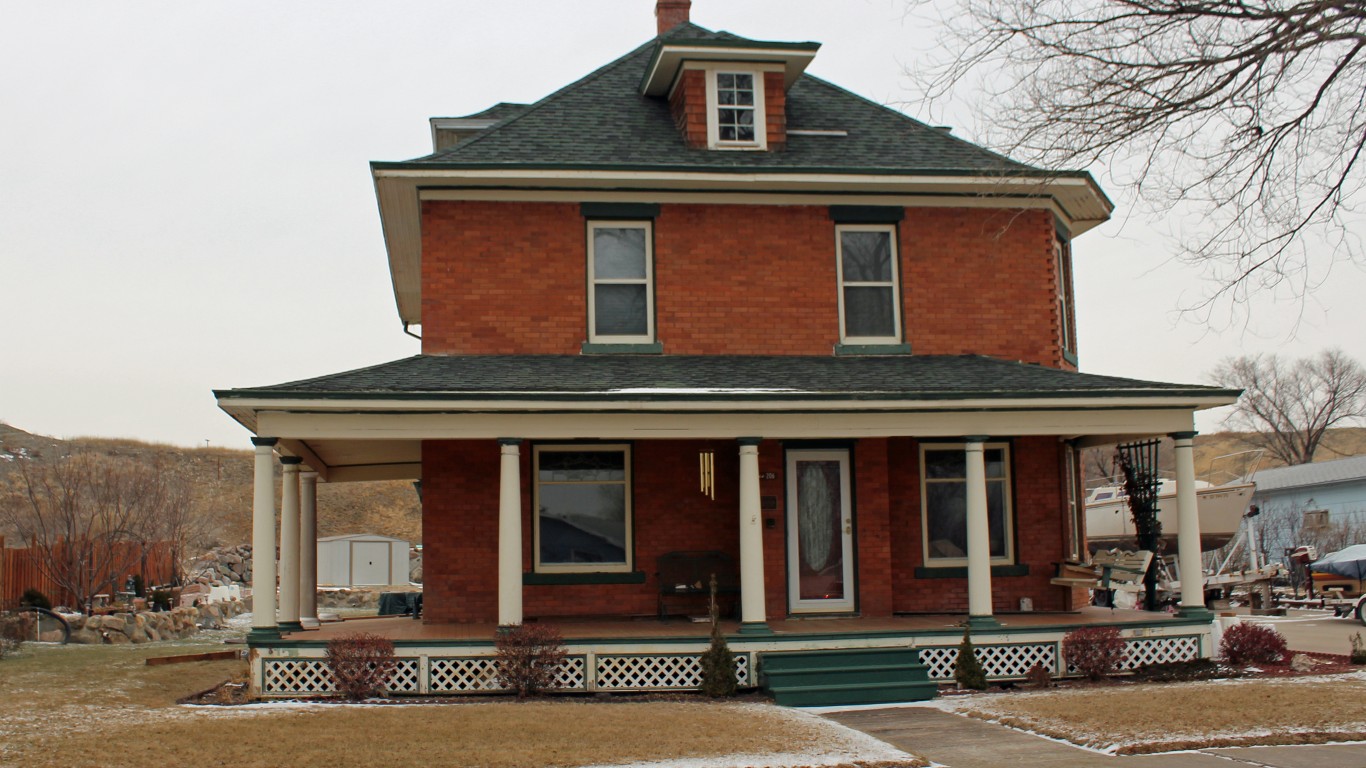
- Avg. life expectancy at birth: 91.9 years (state: 78.2 years)
- Poverty rate: 3.2% (state: 12.3%)
- Adults with a bachelor’s degree: 26.9% (state: 30.4%)
- Median household income: $82,298 (state: $69,457)
- County seat: Fort Pierre
- Counties considered in state: 61
Tennessee: Williamson County
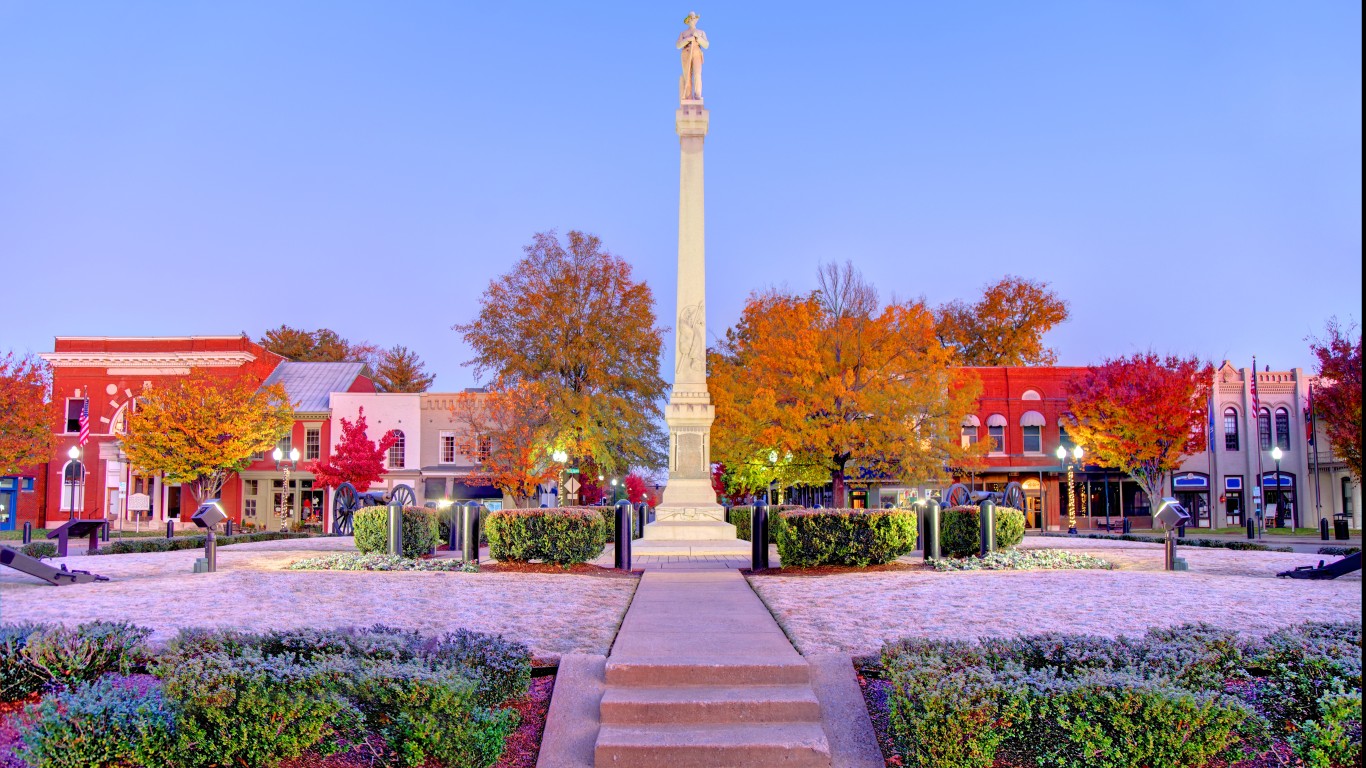
- Avg. life expectancy at birth: 81.5 years (state: 75.3 years)
- Poverty rate: 4.2% (state: 14.0%)
- Adults with a bachelor’s degree: 62.0% (state: 29.7%)
- Median household income: $125,943 (state: $64,035)
- County seat: Franklin
- Counties considered in state: 95
Texas: Collin County

- Avg. life expectancy at birth: 82.2 years (state: 78.4 years)
- Poverty rate: 6.3% (state: 13.9%)
- Adults with a bachelor’s degree: 54.3% (state: 32.3%)
- Median household income: $113,255 (state: $73,035)
- County seat: McKinney
- Counties considered in state: 237
Utah: Summit County

- Avg. life expectancy at birth: 85.6 years (state: 79.7 years)
- Poverty rate: 5.2% (state: 8.5%)
- Adults with a bachelor’s degree: 57.4% (state: 36.1%)
- Median household income: $126,392 (state: $86,833)
- County seat: Coalville
- Counties considered in state: 27
Vermont: Chittenden County

- Avg. life expectancy at birth: 81.7 years (state: 79.7 years)
- Poverty rate: 11.2% (state: 10.4%)
- Adults with a bachelor’s degree: 55.7% (state: 41.7%)
- Median household income: $89,494 (state: $74,014)
- County seat: Burlington
- Counties considered in state: 14
Virginia: Falls Church (independent city)
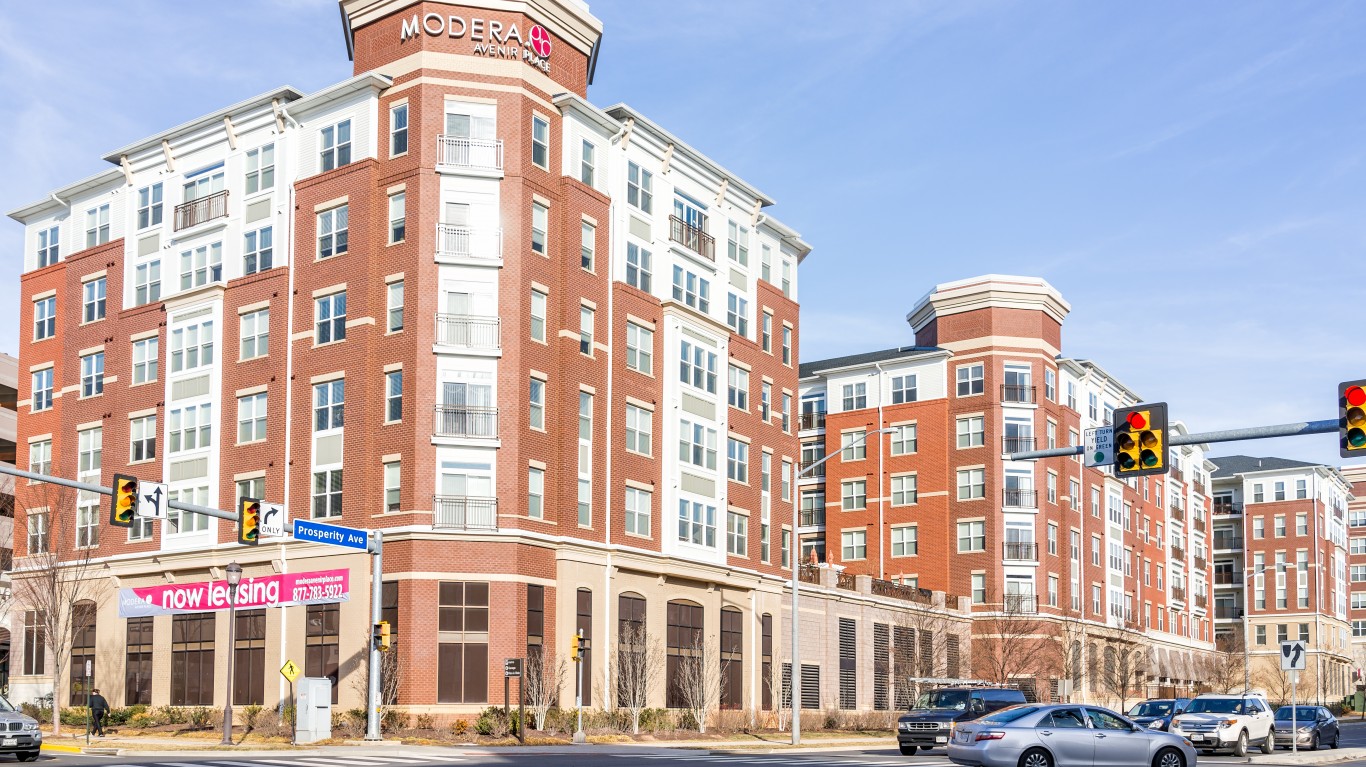
- Avg. life expectancy at birth: 80.6 years (state: 79.1 years)
- Poverty rate: 2.3% (state: 10.0%)
- Adults with a bachelor’s degree: 78.9% (state: 41.0%)
- Median household income: $164,536 (state: $87,249)
- County seat: None
- County equivalents considered in state: 133
Washington: San Juan County

- Avg. life expectancy at birth: 86.3 years (state: 80.2 years)
- Poverty rate: 11.0% (state: 9.9%)
- Adults with a bachelor’s degree: 52.6% (state: 38.0%)
- Median household income: $76,745 (state: $90,325)
- County seat: Friday Harbor
- Counties considered in state: 39
West Virginia: Monongalia County

- Avg. life expectancy at birth: 79.3 years (state: 74.3 years)
- Poverty rate: 20.6% (state: 16.8%)
- Adults with a bachelor’s degree: 48.3% (state: 22.7%)
- Median household income: $60,893 (state: $55,217)
- County seat: Morgantown
- Counties considered in state: 55
Wisconsin: Ozaukee County

- Avg. life expectancy at birth: 81.9 years (state: 78.9 years)
- Poverty rate: 4.5% (state: 10.7%)
- Adults with a bachelor’s degree: 49.8% (state: 32.0%)
- Median household income: $92,258 (state: $72,458)
- County seat: Port Washington
- Counties considered in state: 72
Wyoming: Teton County

- Avg. life expectancy at birth: 86.7 years (state: 78.1 years)
- Poverty rate: 6.9% (state: 10.7%)
- Adults with a bachelor’s degree: 60.3% (state: 29.0%)
- Median household income: $108,279 (state: $72,495)
- County seat: Jackson
- Counties considered in state: 23
Thank you for reading! Have some feedback for us?
Contact the 24/7 Wall St. editorial team.
Latest from 24/7

Our expert who first called NVIDIA in 2009 is predicting 2025 will see a historic AI breakthrough.
You can follow him investing $500,000 of his own money on our top AI stocks for free.