Gun ownership is a constitutional right in the United States — and while only about a third of American adults choose to exercise that right, the U.S. is the only country in the world with more guns than people. Nationwide, there are an estimated 473.2 million civilian owned firearms in circulation, according to the National Shooting Sports Foundation.
While the vast majority of guns in the U.S. are only ever used for legitimate, lawful purposes, some number of them invariably end up in the wrong hands — and the problem only appears to be getting worse. According to firearm tracing data from the Bureau of Alcohol, Tobacco, Firearms, and Explosives, the number of guns that are linked to criminal activity has been steadily rising year-over-year for more than a decade.
When firearms are recovered at a crime scene or taken from a suspect, they are often reported to the ATF for tracing. In these cases, the ATF assists in criminal investigations by using serial numbers and other markings to determine when and where a firearm was originally purchased. While not all guns traced by the ATF were used in a crime — and not all firearms used for illicit purposes are traced — federal tracing data offers valuable insight into trends and geographic patterns related to gun violence in the United States.
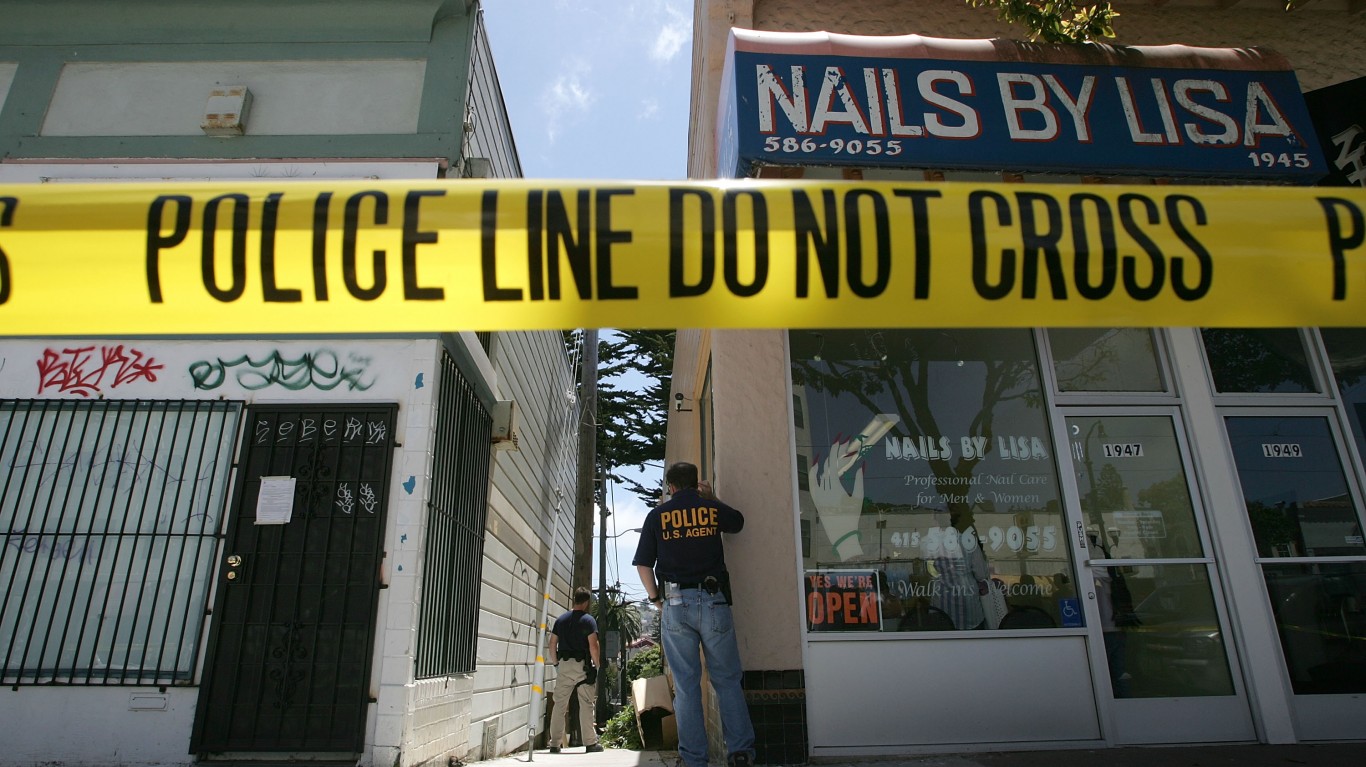
Of the nearly 496,600 firearms traced by the ATF in 2022, 56,262 were seized by law enforcement in California. Gun violence is often concentrated in certain areas, and in California, only 10 cities accounted for over a third of all gun tracings in 2022.
While Los Angeles led the state with over 7,900 firearm tracings in 2022, adjusting for population, several other cities appear to have far higher rates of gun violence. Among the 10 California cities where the ATF traced the most firearms in 2022, tracing rates range from 9.3 firearms for every 10,000 people, to as many as 60 per 10,000.
These are the cities in California with the most gun crime.
10. San Diego

- Firearm-tracing rate in 2022: 9.3 guns per 10,000 people
- Total firearm tracings in the city, 2022: 1,283 (2.3% of all firearms traced in California)
- Population: 1,383,987 (3.5% of California’s population)
9. San Francisco

- Firearm-tracing rate in 2022: 10.9 guns per 10,000 people
- Total firearm tracings in the city, 2022: 925 (1.6% of all firearms traced in California)
- Population: 851,036 (2.2% of California’s population)
8. Los Angeles

- Firearm-tracing rate in 2022: 20.5 guns per 10,000 people
- Total firearm tracings in the city, 2022: 7,939 (14.1% of all firearms traced in California)
- Population: 3,881,041 (9.9% of California’s population)
7. Riverside
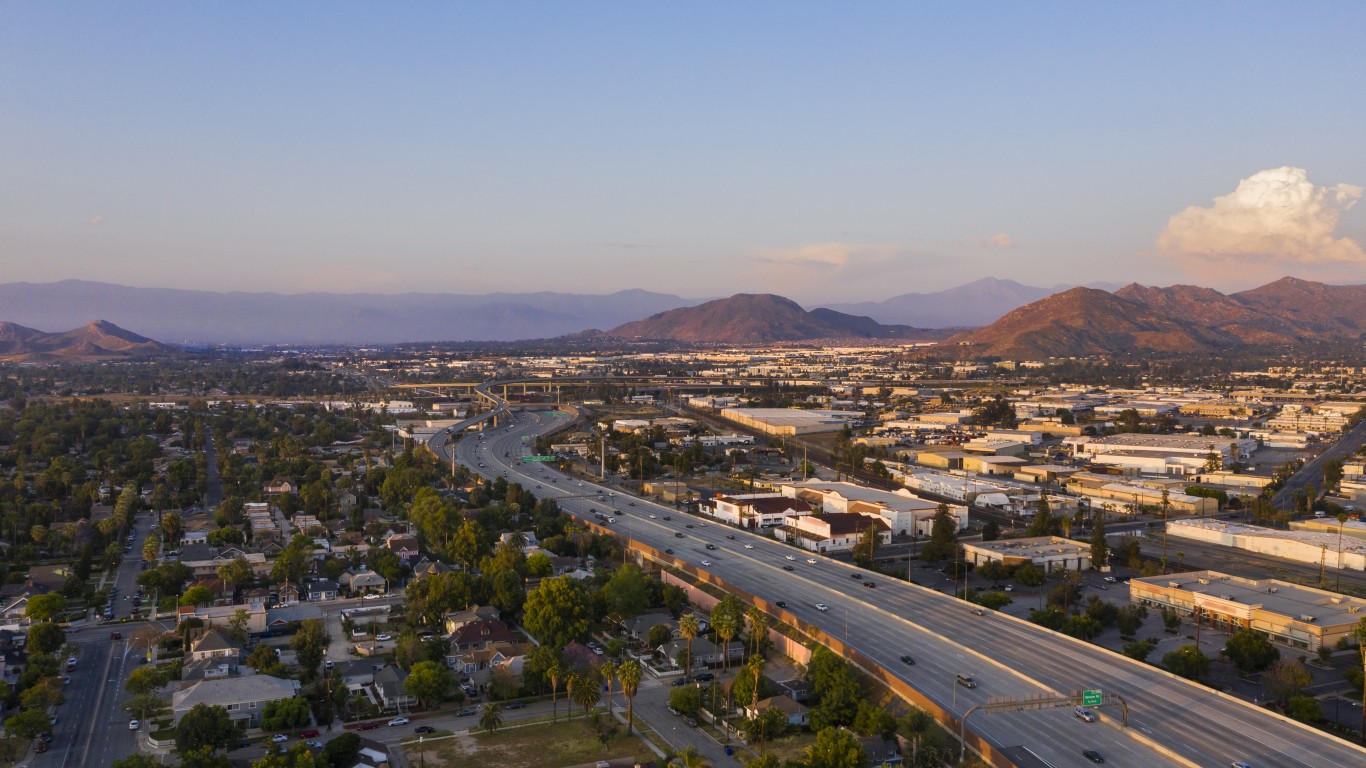
- Firearm-tracing rate in 2022: 23.9 guns per 10,000 people
- Total firearm tracings in the city, 2022: 757 (1.3% of all firearms traced in California)
- Population: 316,076 (0.8% of California’s population)
6. Stockton

- Firearm-tracing rate in 2022: 32.3 guns per 10,000 people
- Total firearm tracings in the city, 2022: 1,033 (1.8% of all firearms traced in California)
- Population: 320,030 (0.8% of California’s population)
5. Oakland

- Firearm-tracing rate in 2022: 32.6 guns per 10,000 people
- Total firearm tracings in the city, 2022: 1,429 (2.5% of all firearms traced in California)
- Population: 437,825 (1.1% of California’s population)
4. Fresno

- Firearm-tracing rate in 2022: 35.2 guns per 10,000 people
- Total firearm tracings in the city, 2022: 1,907 (3.4% of all firearms traced in California)
- Population: 541,528 (1.4% of California’s population)
3. Sacramento

- Firearm-tracing rate in 2022: 44.5 guns per 10,000 people
- Total firearm tracings in the city, 2022: 2,329 (4.1% of all firearms traced in California)
- Population: 523,600 (1.3% of California’s population)
2. Victorville
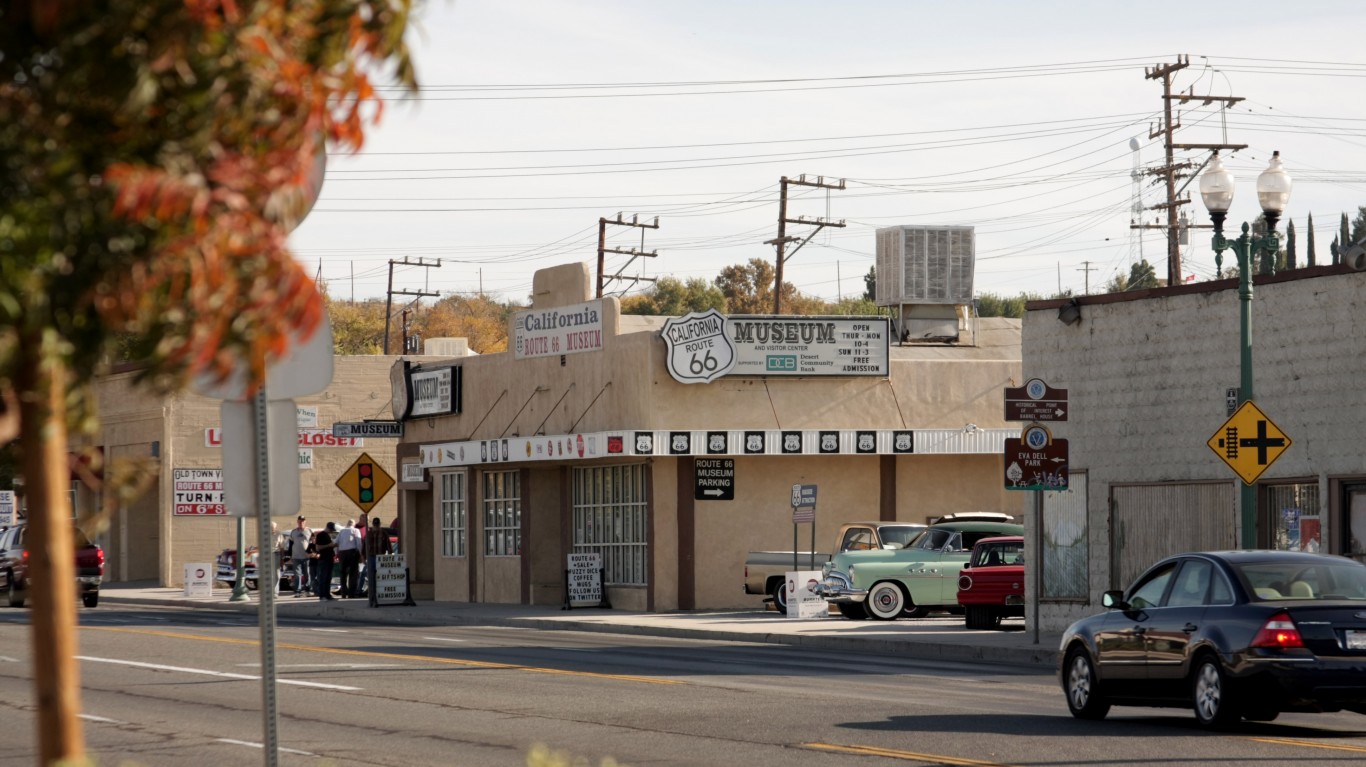
- Firearm-tracing rate in 2022: 59.7 guns per 10,000 people
- Total firearm tracings in the city, 2022: 802 (1.4% of all firearms traced in California)
- Population: 134,417 (0.3% of California’s population)
1. San Bernardino
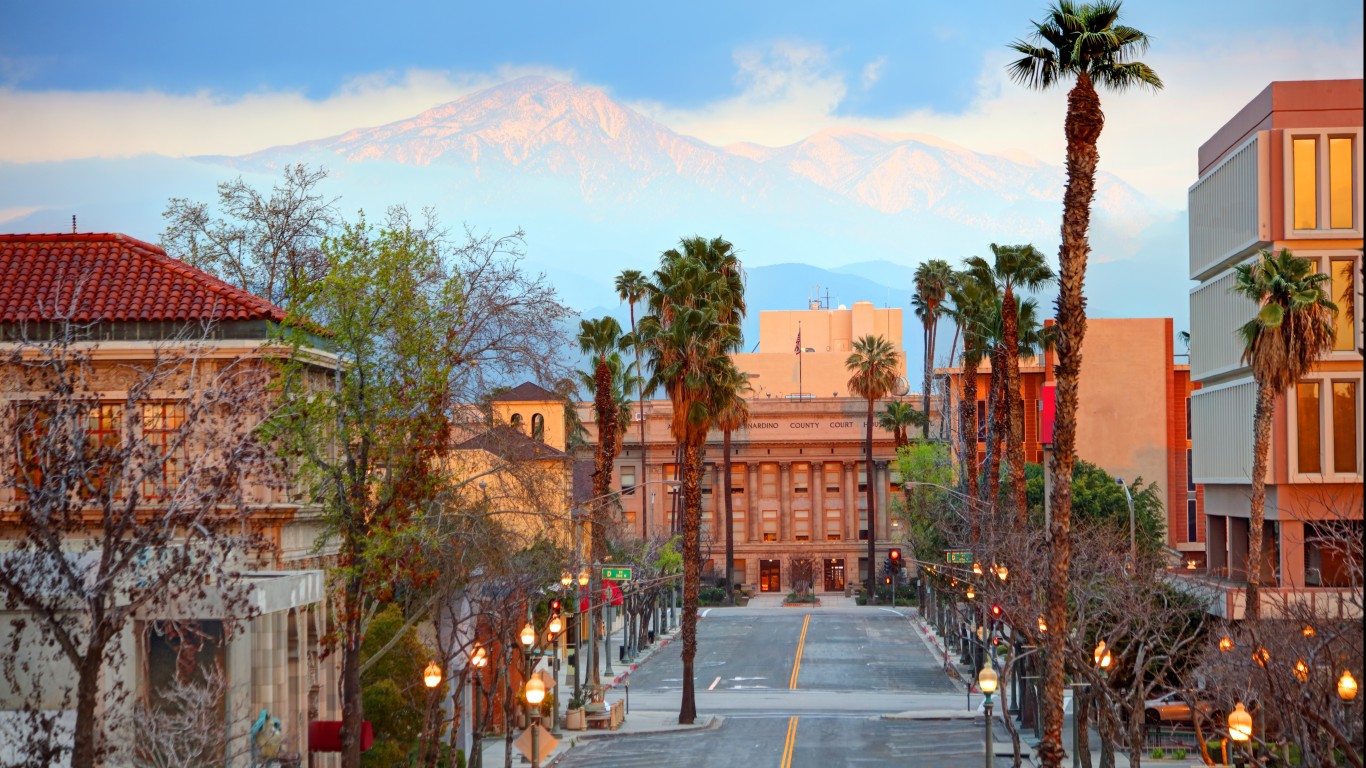
- Firearm-tracing rate in 2022: 60.0 guns per 10,000 people
- Total firearm tracings in the city, 2022: 1,326 (2.4% of all firearms traced in California)
- Population: 221,041 (0.6% of California’s population)

| Rank | City | Gun tracings per 10,000 people, 2022 | Total guns traced in 2022 | Share of all guns traced statewide, 2022 (%) |
|---|---|---|---|---|
| 1 | San Bernardino, CA | 60.0 | 1,326 | 2.4 |
| 2 | Victorville, CA | 59.7 | 802 | 1.4 |
| 3 | Sacramento, CA | 44.5 | 2,329 | 4.1 |
| 4 | Fresno, CA | 35.2 | 1,907 | 3.4 |
| 5 | Oakland, CA | 32.6 | 1,429 | 2.5 |
| 6 | Stockton, CA | 32.3 | 1,033 | 1.8 |
| 7 | Riverside, CA | 23.9 | 757 | 1.3 |
| 8 | Los Angeles, CA | 20.5 | 7,939 | 14.1 |
| 9 | San Francisco, CA | 10.9 | 925 | 1.6 |
| 10 | San Diego, CA | 9.3 | 1,283 | 2.3 |
Are You Still Paying With a Debit Card?
The average American spends $17,274 on debit cards a year, and it’s a HUGE mistake. First, debit cards don’t have the same fraud protections as credit cards. Once your money is gone, it’s gone. But more importantly you can actually get something back from this spending every time you swipe.
Issuers are handing out wild bonuses right now. With some you can earn up to 5% back on every purchase. That’s like getting a 5% discount on everything you buy!
Our top pick is kind of hard to imagine. Not only does it pay up to 5% back, it also includes a $200 cash back reward in the first six months, a 0% intro APR, and…. $0 annual fee. It’s quite literally free money for any one that uses a card regularly. Click here to learn more!
Flywheel Publishing has partnered with CardRatings to provide coverage of credit card products. Flywheel Publishing and CardRatings may receive a commission from card issuers.
Thank you for reading! Have some feedback for us?
Contact the 24/7 Wall St. editorial team.


