Special Report
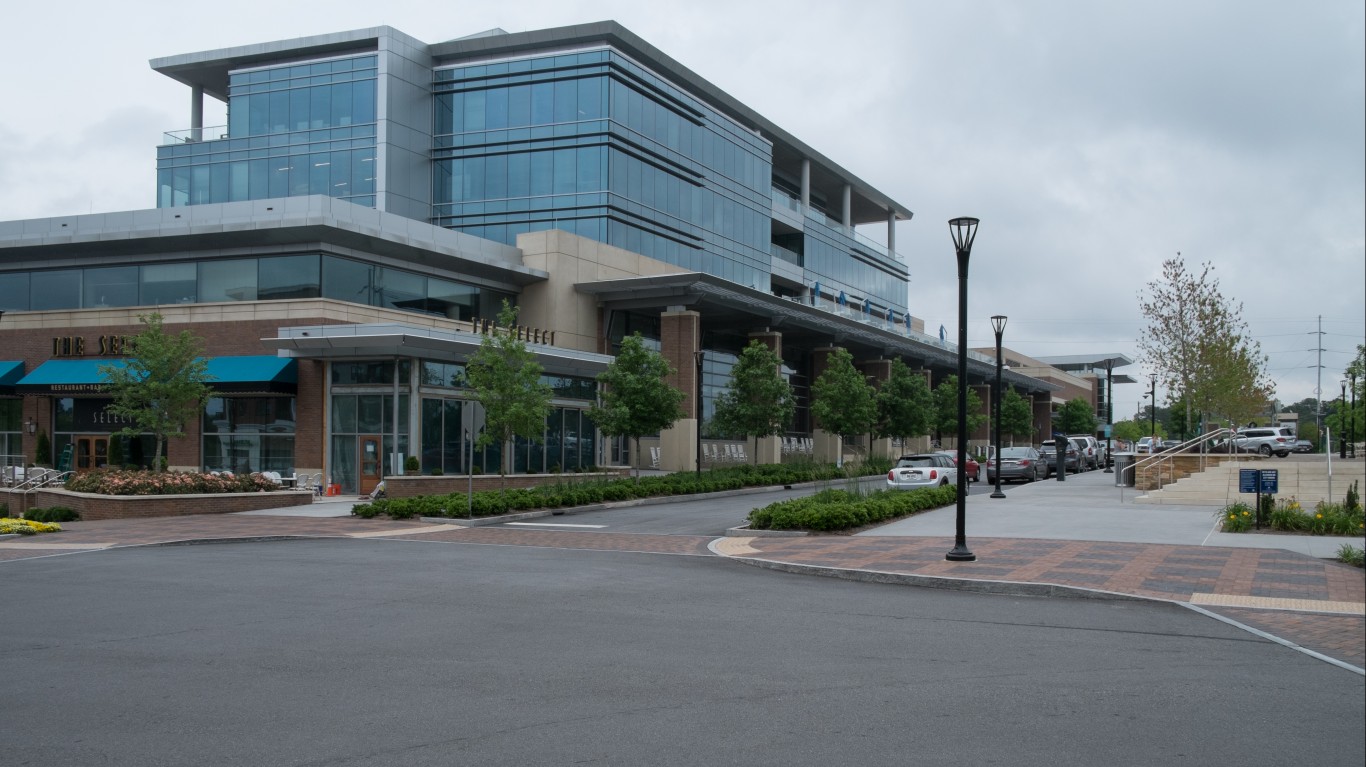
The Cheapest and Most Expensive Places to Buy a House in Georgia
Published:
Home prices have surged in the U.S. in recent years. Driven by rising demand and supply constraints during the pandemic, the median home sale price spiked by nearly 50% from the second quarter of 2020 to Q3 in 2022. While the sale price of a typical American home has fallen in recent months since, housing prices remain at historic highs.
Not only have home values soared, but borrowing costs for home buyers have also climbed. The average interest rate on a 30-year fixed mortgage has been above 6% since September 2022, a high not seen in nearly a decade and a half. In a market defined by high prices and high mortgage rates, homeownership has become prohibitively expensive for a large number of Americans.
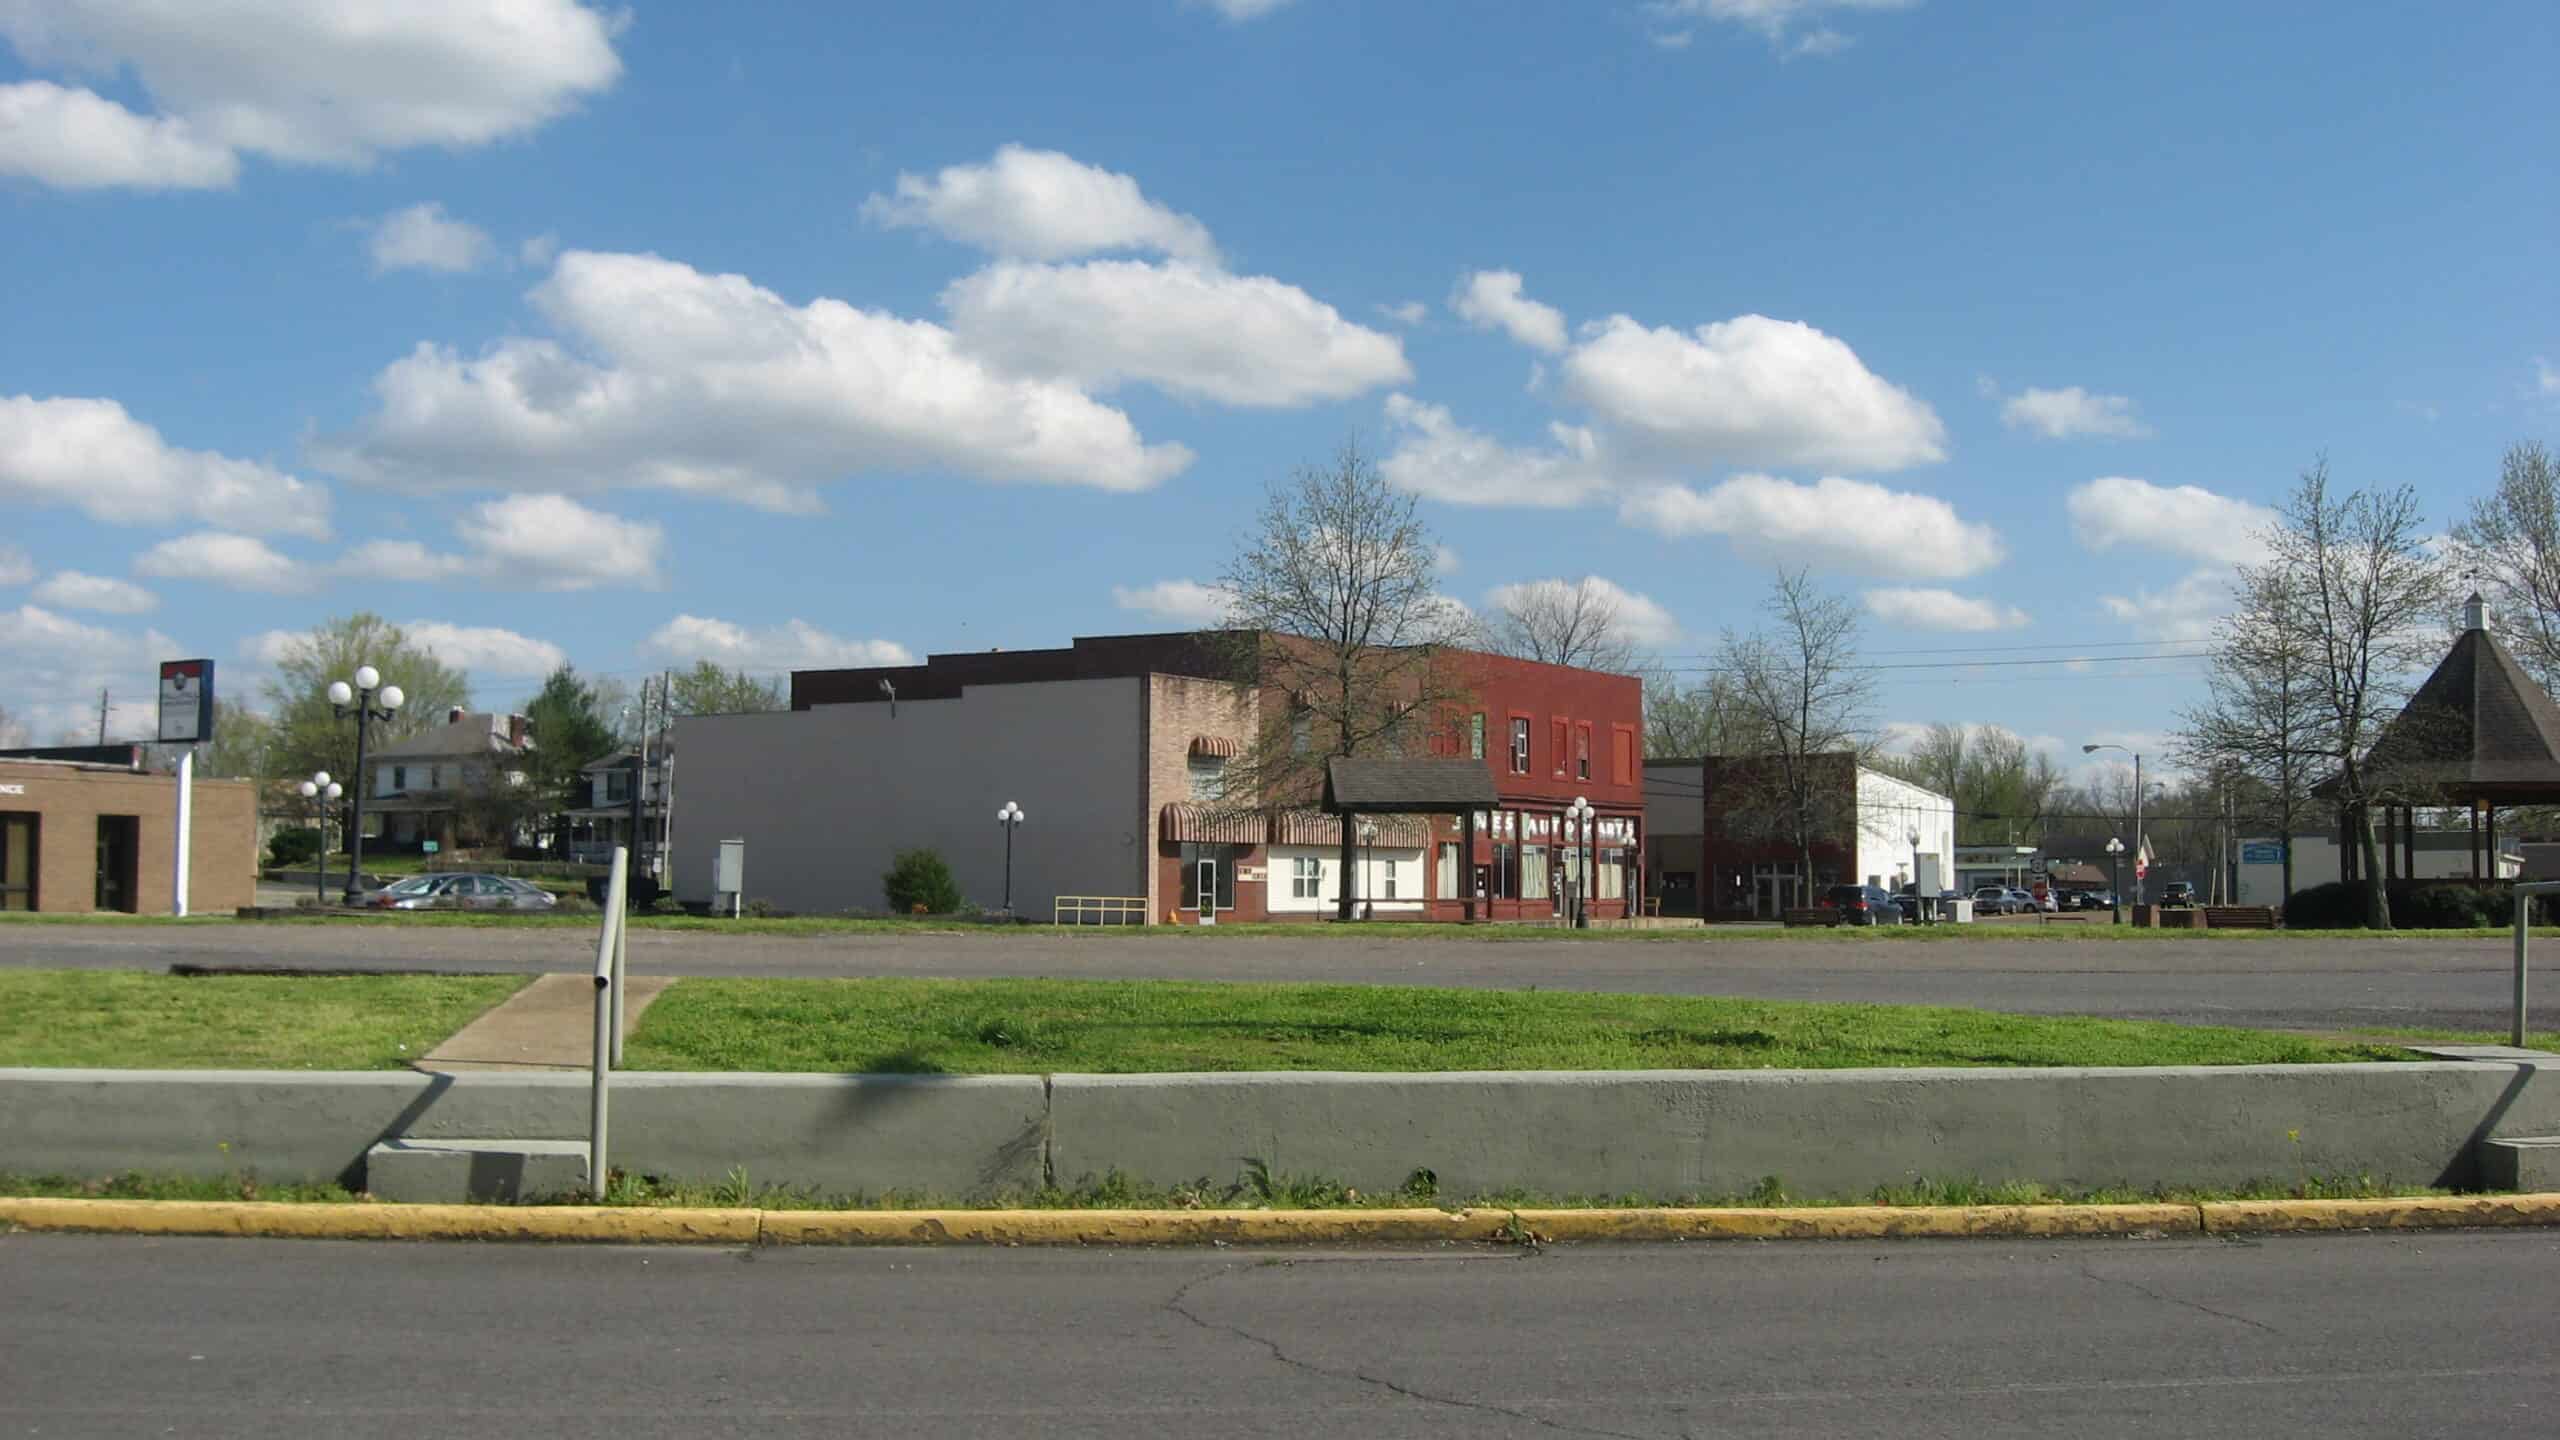
Still, housing prices are also subject to a number of factors that can be isolated from broader, nationwide market trends — and location is one of them. Two homes that are virtually identical can vary in price by hundreds of thousands of dollars, depending on where they are. And for prospective homeowners on a budget, some Georgia cities are far more affordable than others.
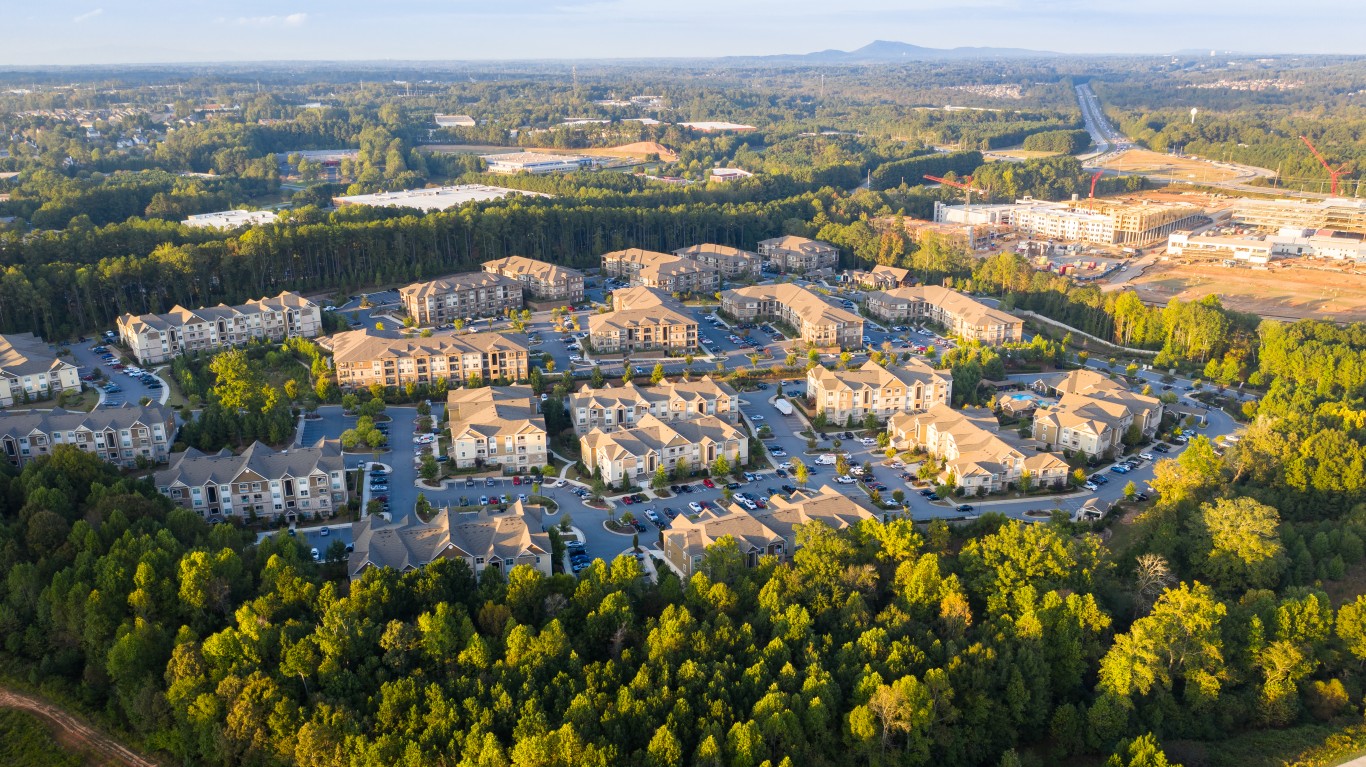
According to five-year estimates from the U.S. Census Bureau’s 2022 American Community Survey, the typical home in Georgia is worth $245,900. But across the 47 cities, towns, and unincorporated communities in the state with populations of at least 25,000, median home values range from about $111,000 to more than $640,000.
In any local market, home prices are often a reflection of what residents can afford. In Georgia, many of the least expensive cities for homebuyers are not high-income areas. Of the 47 Georgia cities with available data from the ACS, 20 have a median home value that is less than the statewide median. In all but three of these places, the typical household earns less than the statewide median household income of $71,355. Similarly, most of Georgia’s more expensive housing markets have higher earning populations.


| Rank | Places in Georgia with at least 25,000 residents | Median home value ($) | Homeownership rate (%) | Median household income ($) | Total Population |
|---|---|---|---|---|---|
| 1 | Milton | 642,500 | 74.0 | 142,845 | 41,029 |
| 2 | Brookhaven | 626,800 | 54.6 | 114,570 | 56,848 |
| 3 | Alpharetta | 562,000 | 67.2 | 141,402 | 65,884 |
| 4 | Sandy Springs | 556,300 | 50.5 | 93,303 | 107,221 |
| 5 | Dunwoody | 545,200 | 55.7 | 106,710 | 51,458 |
| 6 | Johns Creek | 525,100 | 78.8 | 153,882 | 82,230 |
| 7 | Roswell | 479,400 | 70.8 | 122,924 | 92,770 |
| 8 | Peachtree Corners | 444,000 | 50.7 | 74,716 | 42,147 |
| 9 | Peachtree City | 435,300 | 74.5 | 111,850 | 38,414 |
| 10 | Chamblee | 395,900 | 39.8 | 76,682 | 29,980 |
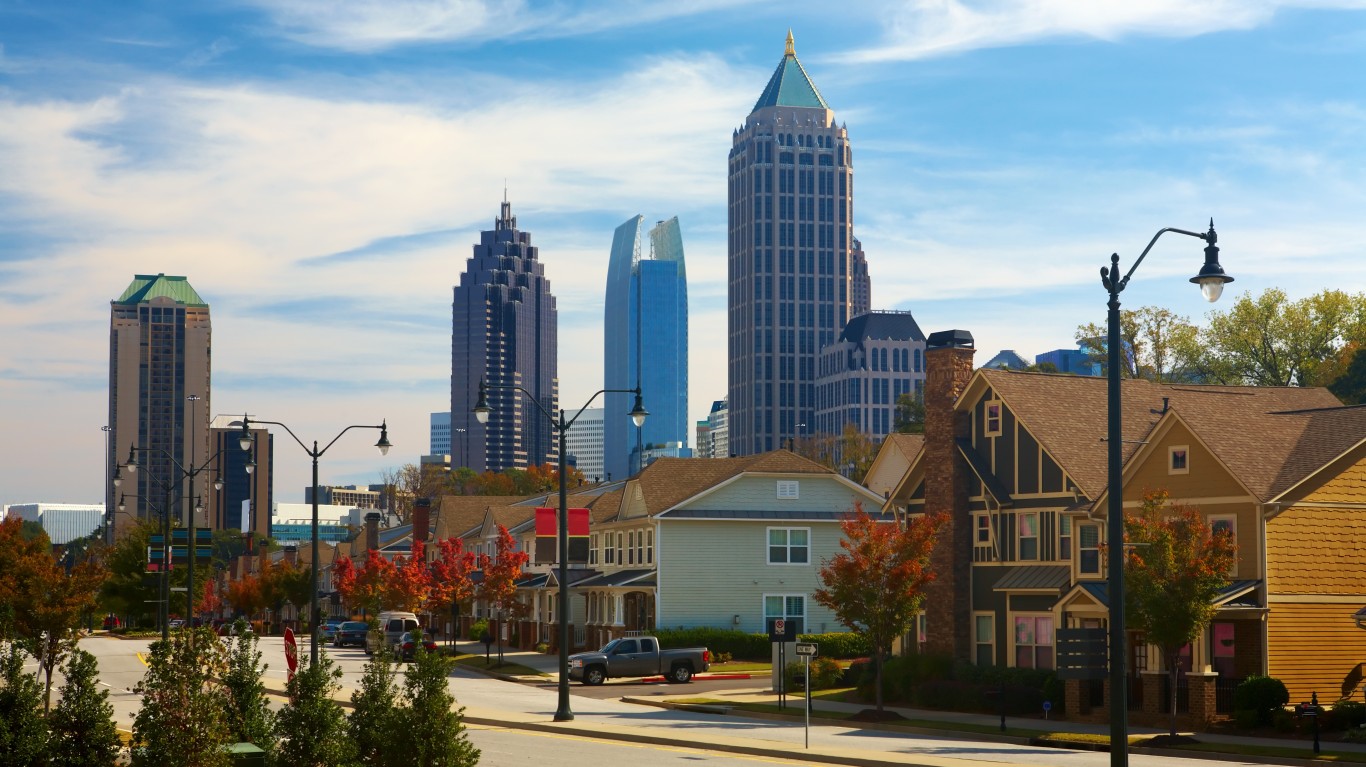
| 11 | Atlanta | 395,600 | 45.7 | 77,655 | 494,838 |
| 12 | Smyrna | 380,100 | 57.2 | 92,258 | 55,863 |
| 13 | Marietta | 376,400 | 46.2 | 67,589 | 61,387 |
| 14 | Woodstock | 359,800 | 65.2 | 100,913 | 35,171 |
| 15 | Duluth | 334,800 | 55.3 | 88,915 | 31,742 |
| 16 | Tucker | 331,100 | 64.5 | 80,311 | 36,994 |
| 17 | Canton | 324,000 | 55.9 | 75,414 | 33,499 |
| 18 | Evans | 314,100 | 89.0 | 125,325 | 37,456 |
| 19 | Gainesville | 296,400 | 43.4 | 64,163 | 42,780 |
| 20 | Lawrenceville | 286,400 | 47.8 | 55,608 | 30,465 |
| 21 | Newnan | 284,600 | 56.5 | 74,606 | 42,689 |
| 22 | Mableton | 278,300 | 74.5 | 79,069 | 41,647 |
| 23 | Douglasville | 274,500 | 49.2 | 72,753 | 35,252 |
| 24 | Pooler | 269,800 | 60.5 | 89,812 | 26,264 |
| 25 | Kennesaw | 262,000 | 65.5 | 81,467 | 33,360 |
| 26 | Carrollton | 259,700 | 38.3 | 46,722 | 26,622 |
| 27 | McDonough | 246,800 | 49.9 | 77,804 | 29,134 |
| 28 | Athens-Clarke County | 242,300 | 40.6 | 47,798 | 126,672 |
| 29 | South Fulton | 242,200 | 69.2 | 77,488 | 107,865 |
| 30 | Stockbridge | 241,400 | 49.3 | 72,175 | 28,858 |
| 31 | East Point | 217,300 | 42.0 | 59,602 | 38,113 |
| 32 | Martinez | 211,200 | 72.6 | 80,130 | 33,773 |
| 33 | Savannah | 203,300 | 45.9 | 54,748 | 147,583 |
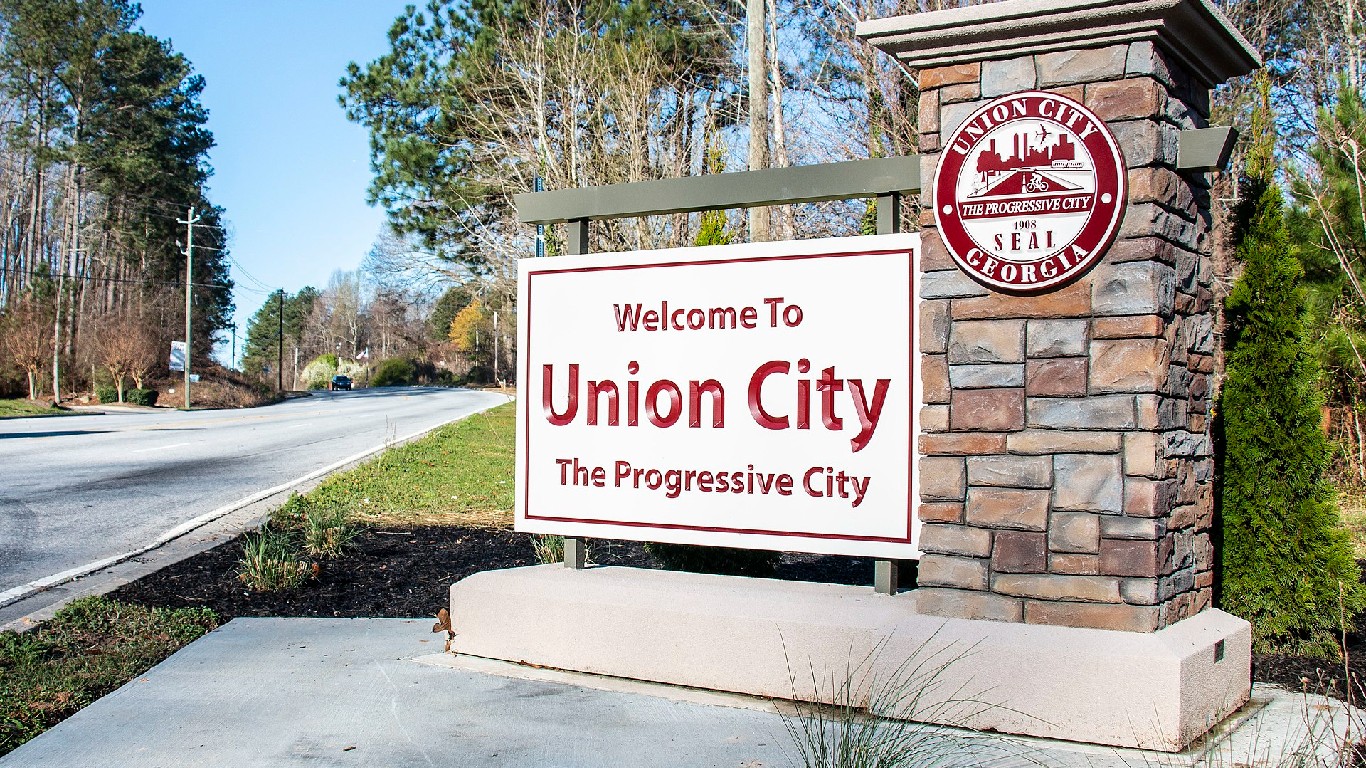
| 34 | Union City | 201,400 | 41.6 | 46,696 | 26,869 |
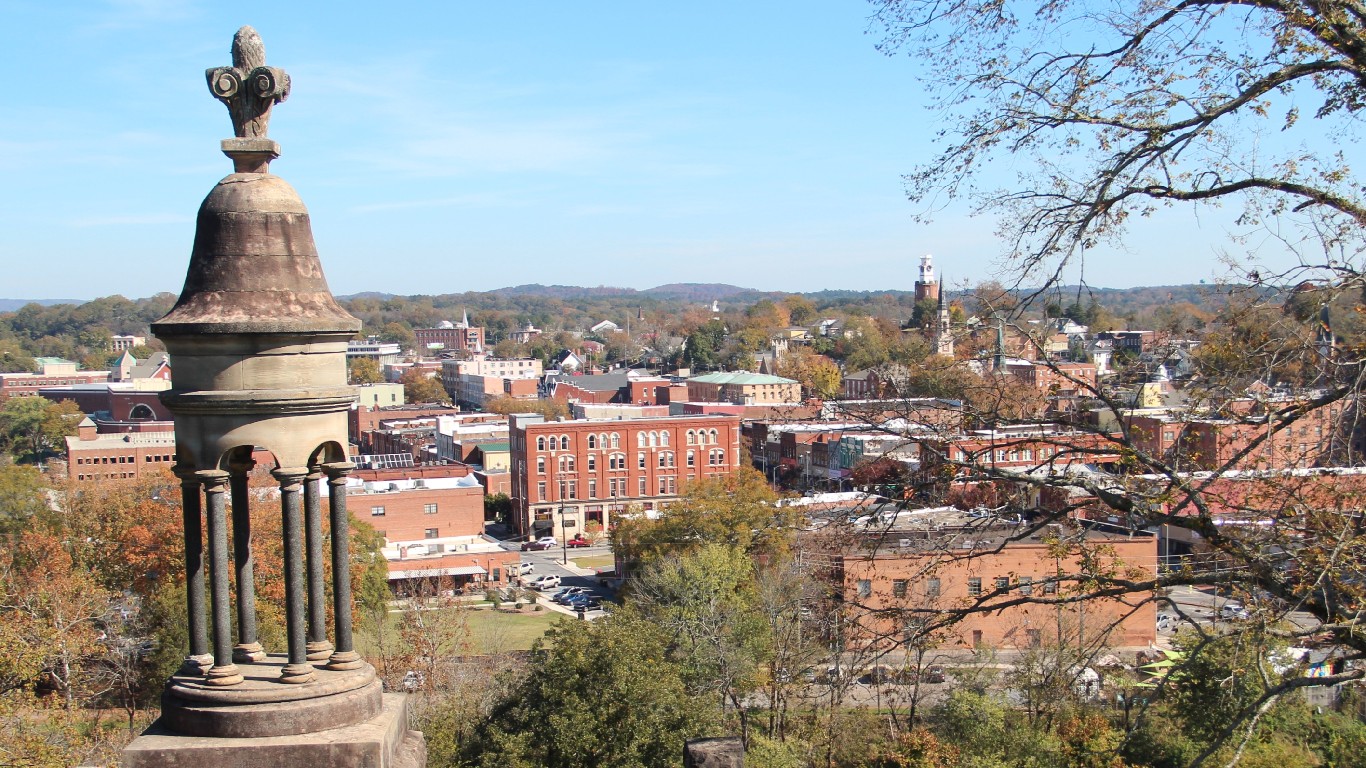
| 35 | Rome | 192,700 | 50.9 | 48,512 | 37,621 |
| 36 | Stonecrest | 183,700 | 50.2 | 63,438 | 59,445 |
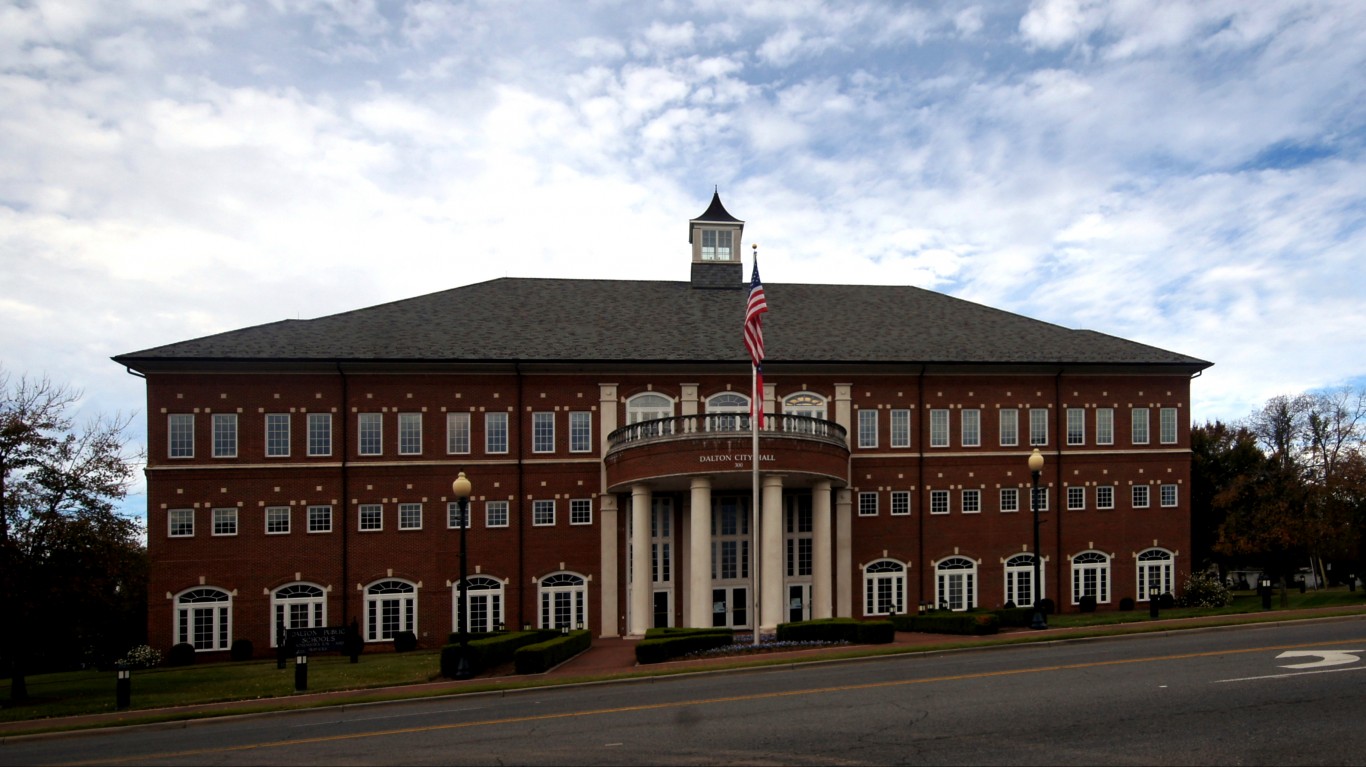
| 37 | Dalton | 182,500 | 53.4 | 57,163 | 34,358 |
| 38 | Redan | 170,900 | 58.2 | 60,306 | 31,326 |
| 39 | Columbus | 168,400 | 49.5 | 54,561 | 204,572 |
| 40 | Warner Robins | 159,000 | 52.8 | 63,678 | 80,374 |
| 41 | Hinesville | 156,000 | 44.7 | 54,447 | 34,732 |
| 42 | Macon-Bibb County | 155,200 | 52.6 | 48,897 | 156,554 |
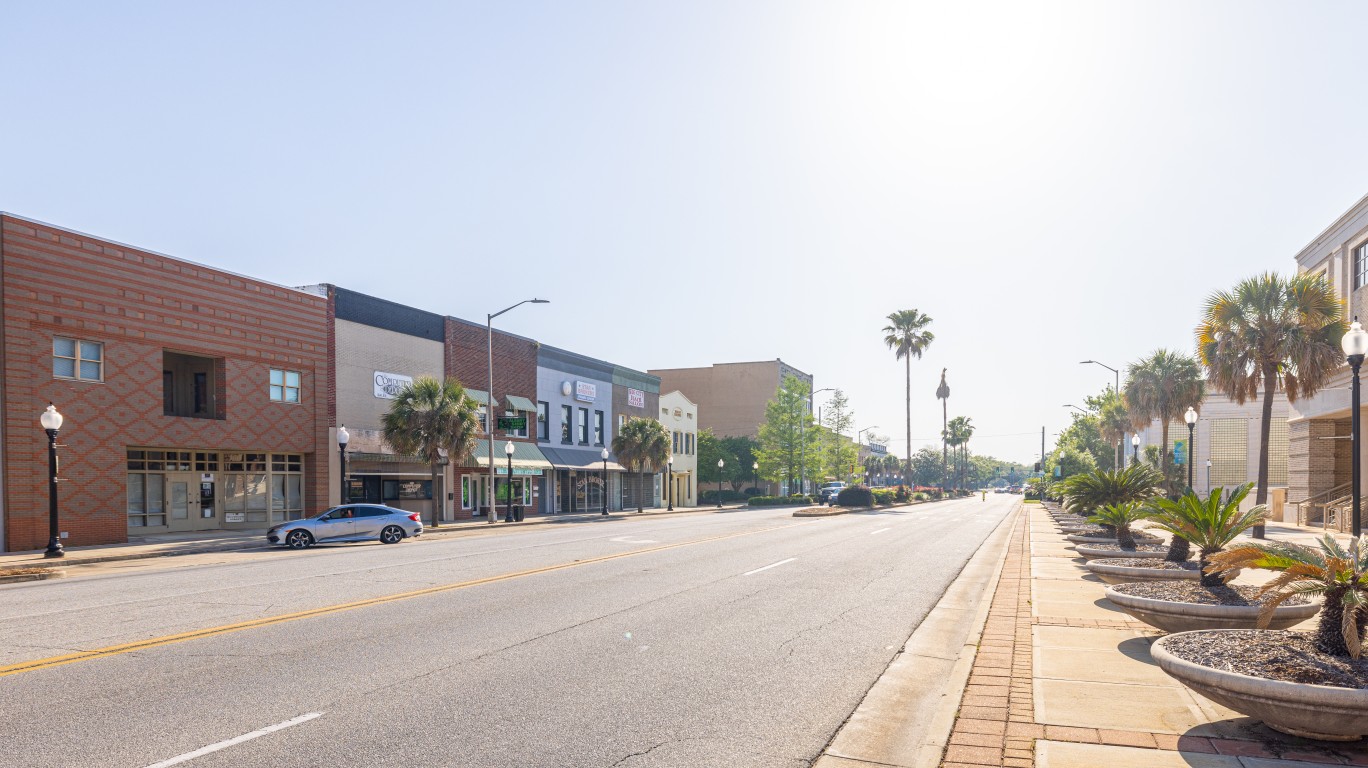
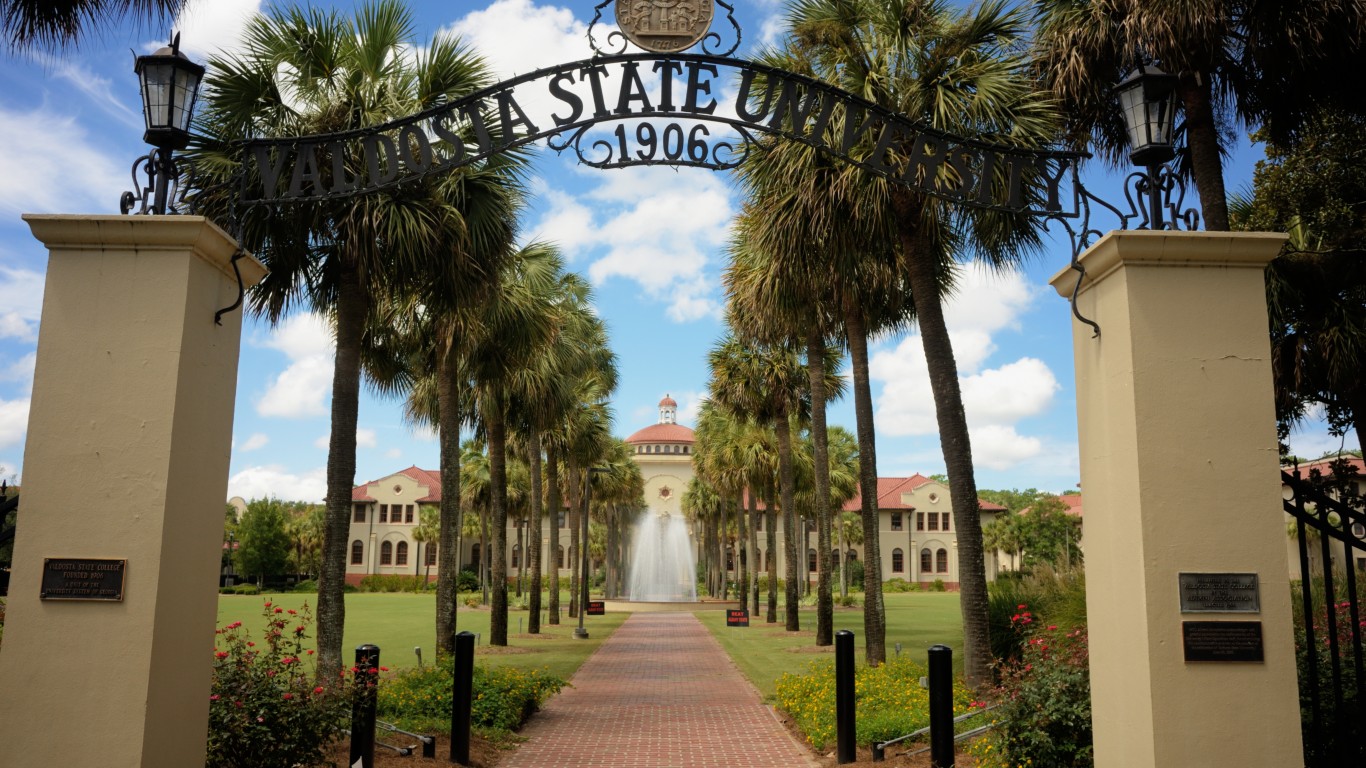
| 43 | Valdosta | 152,100 | 40.3 | 41,365 | 55,266 |
| 44 | LaGrange | 148,500 | 41.4 | 41,030 | 31,173 |
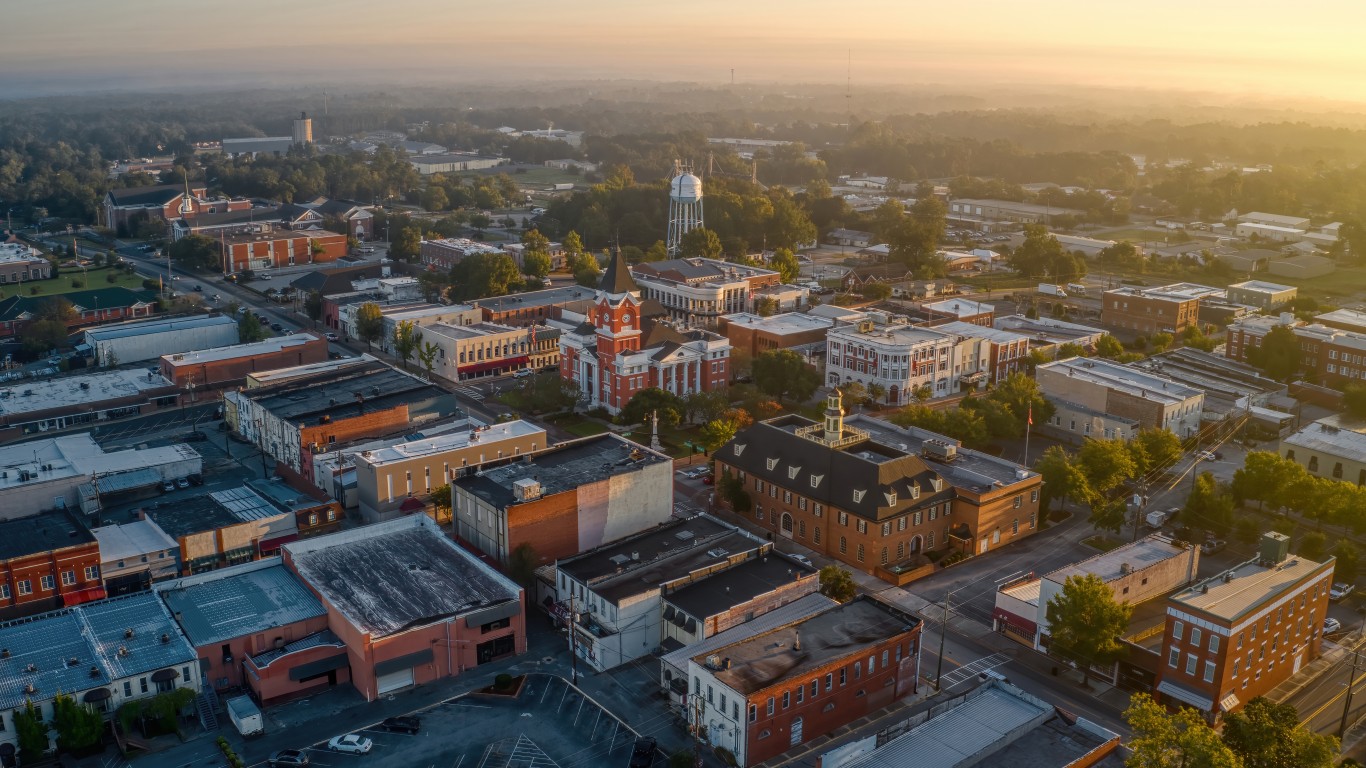
| 45 | Statesboro | 142,600 | 20.0 | 38,845 | 33,185 |
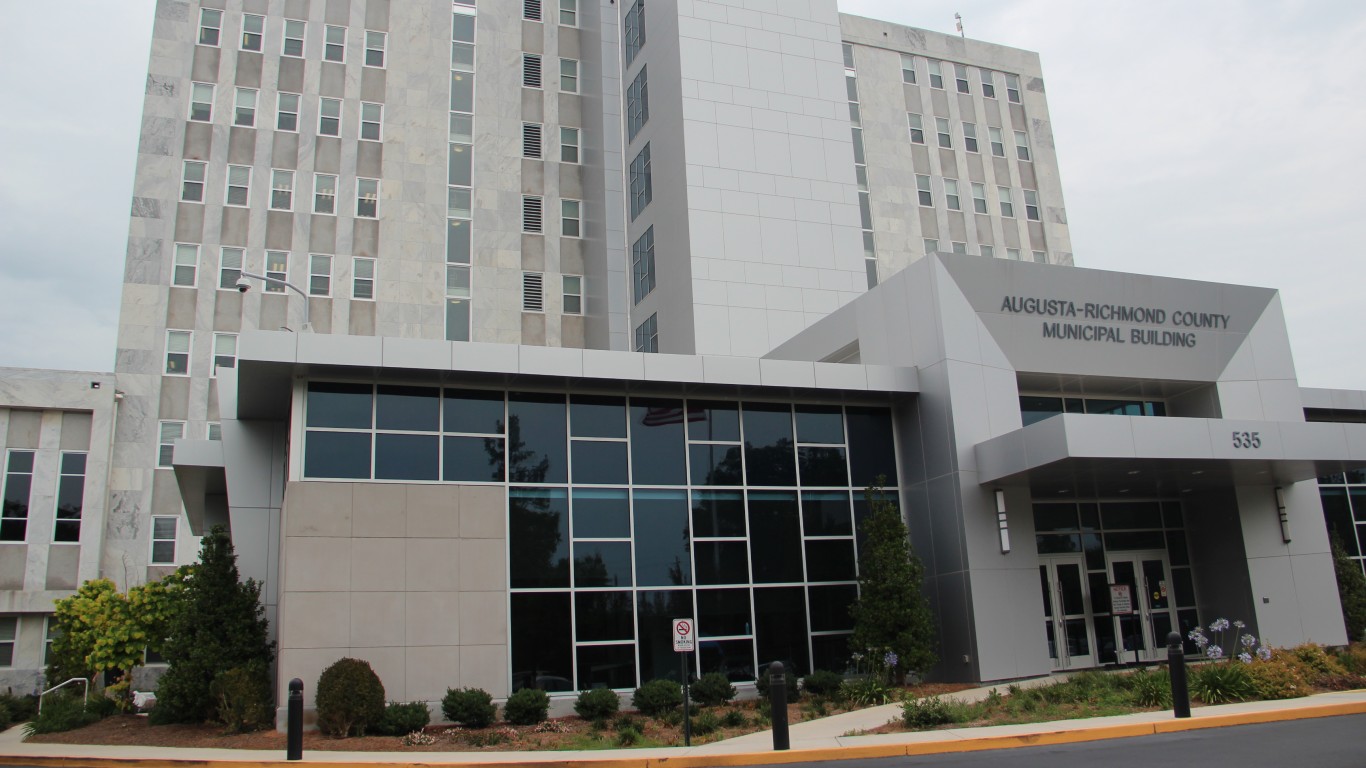
| 46 | Augusta-Richmond County | 141,900 | 51.0 | 50,492 | 201,615 |
| 47 | Albany | 111,200 | 40.2 | 43,724 | 68,926 |
The average American spends $17,274 on debit cards a year, and it’s a HUGE mistake. First, debit cards don’t have the same fraud protections as credit cards. Once your money is gone, it’s gone. But more importantly you can actually get something back from this spending every time you swipe.
Issuers are handing out wild bonuses right now. With some you can earn up to 5% back on every purchase. That’s like getting a 5% discount on everything you buy!
Our top pick is kind of hard to imagine. Not only does it pay up to 5% back, it also includes a $200 cash back reward in the first six months, a 0% intro APR, and…. $0 annual fee. It’s quite literally free money for any one that uses a card regularly. Click here to learn more!
Flywheel Publishing has partnered with CardRatings to provide coverage of credit card products. Flywheel Publishing and CardRatings may receive a commission from card issuers.
Thank you for reading! Have some feedback for us?
Contact the 24/7 Wall St. editorial team.


Our expert who first called NVIDIA in 2009 is predicting 2025 will see a historic AI breakthrough.
You can follow him investing $500,000 of his own money on our top AI stocks for free.

 by OnlineInfamous")


