Special Report
The Cheapest and Most Expensive Housing Markets in New Jersey
Published:
Home prices have surged in the U.S. in recent years. Driven by rising demand and supply constraints during the pandemic, the median home sale price spiked by nearly 50% from the second quarter of 2020 to Q3 in 2022. While the sale price of a typical American home has fallen in recent months since, housing prices remain at historic highs.
Not only have home values soared, but borrowing costs for home buyers have also climbed. The average interest rate on a 30-year fixed mortgage has been above 6% since September 2022, a high not seen in nearly a decade and a half. In a market defined by high prices and high mortgage rates, homeownership has become prohibitively expensive for a large number of Americans.
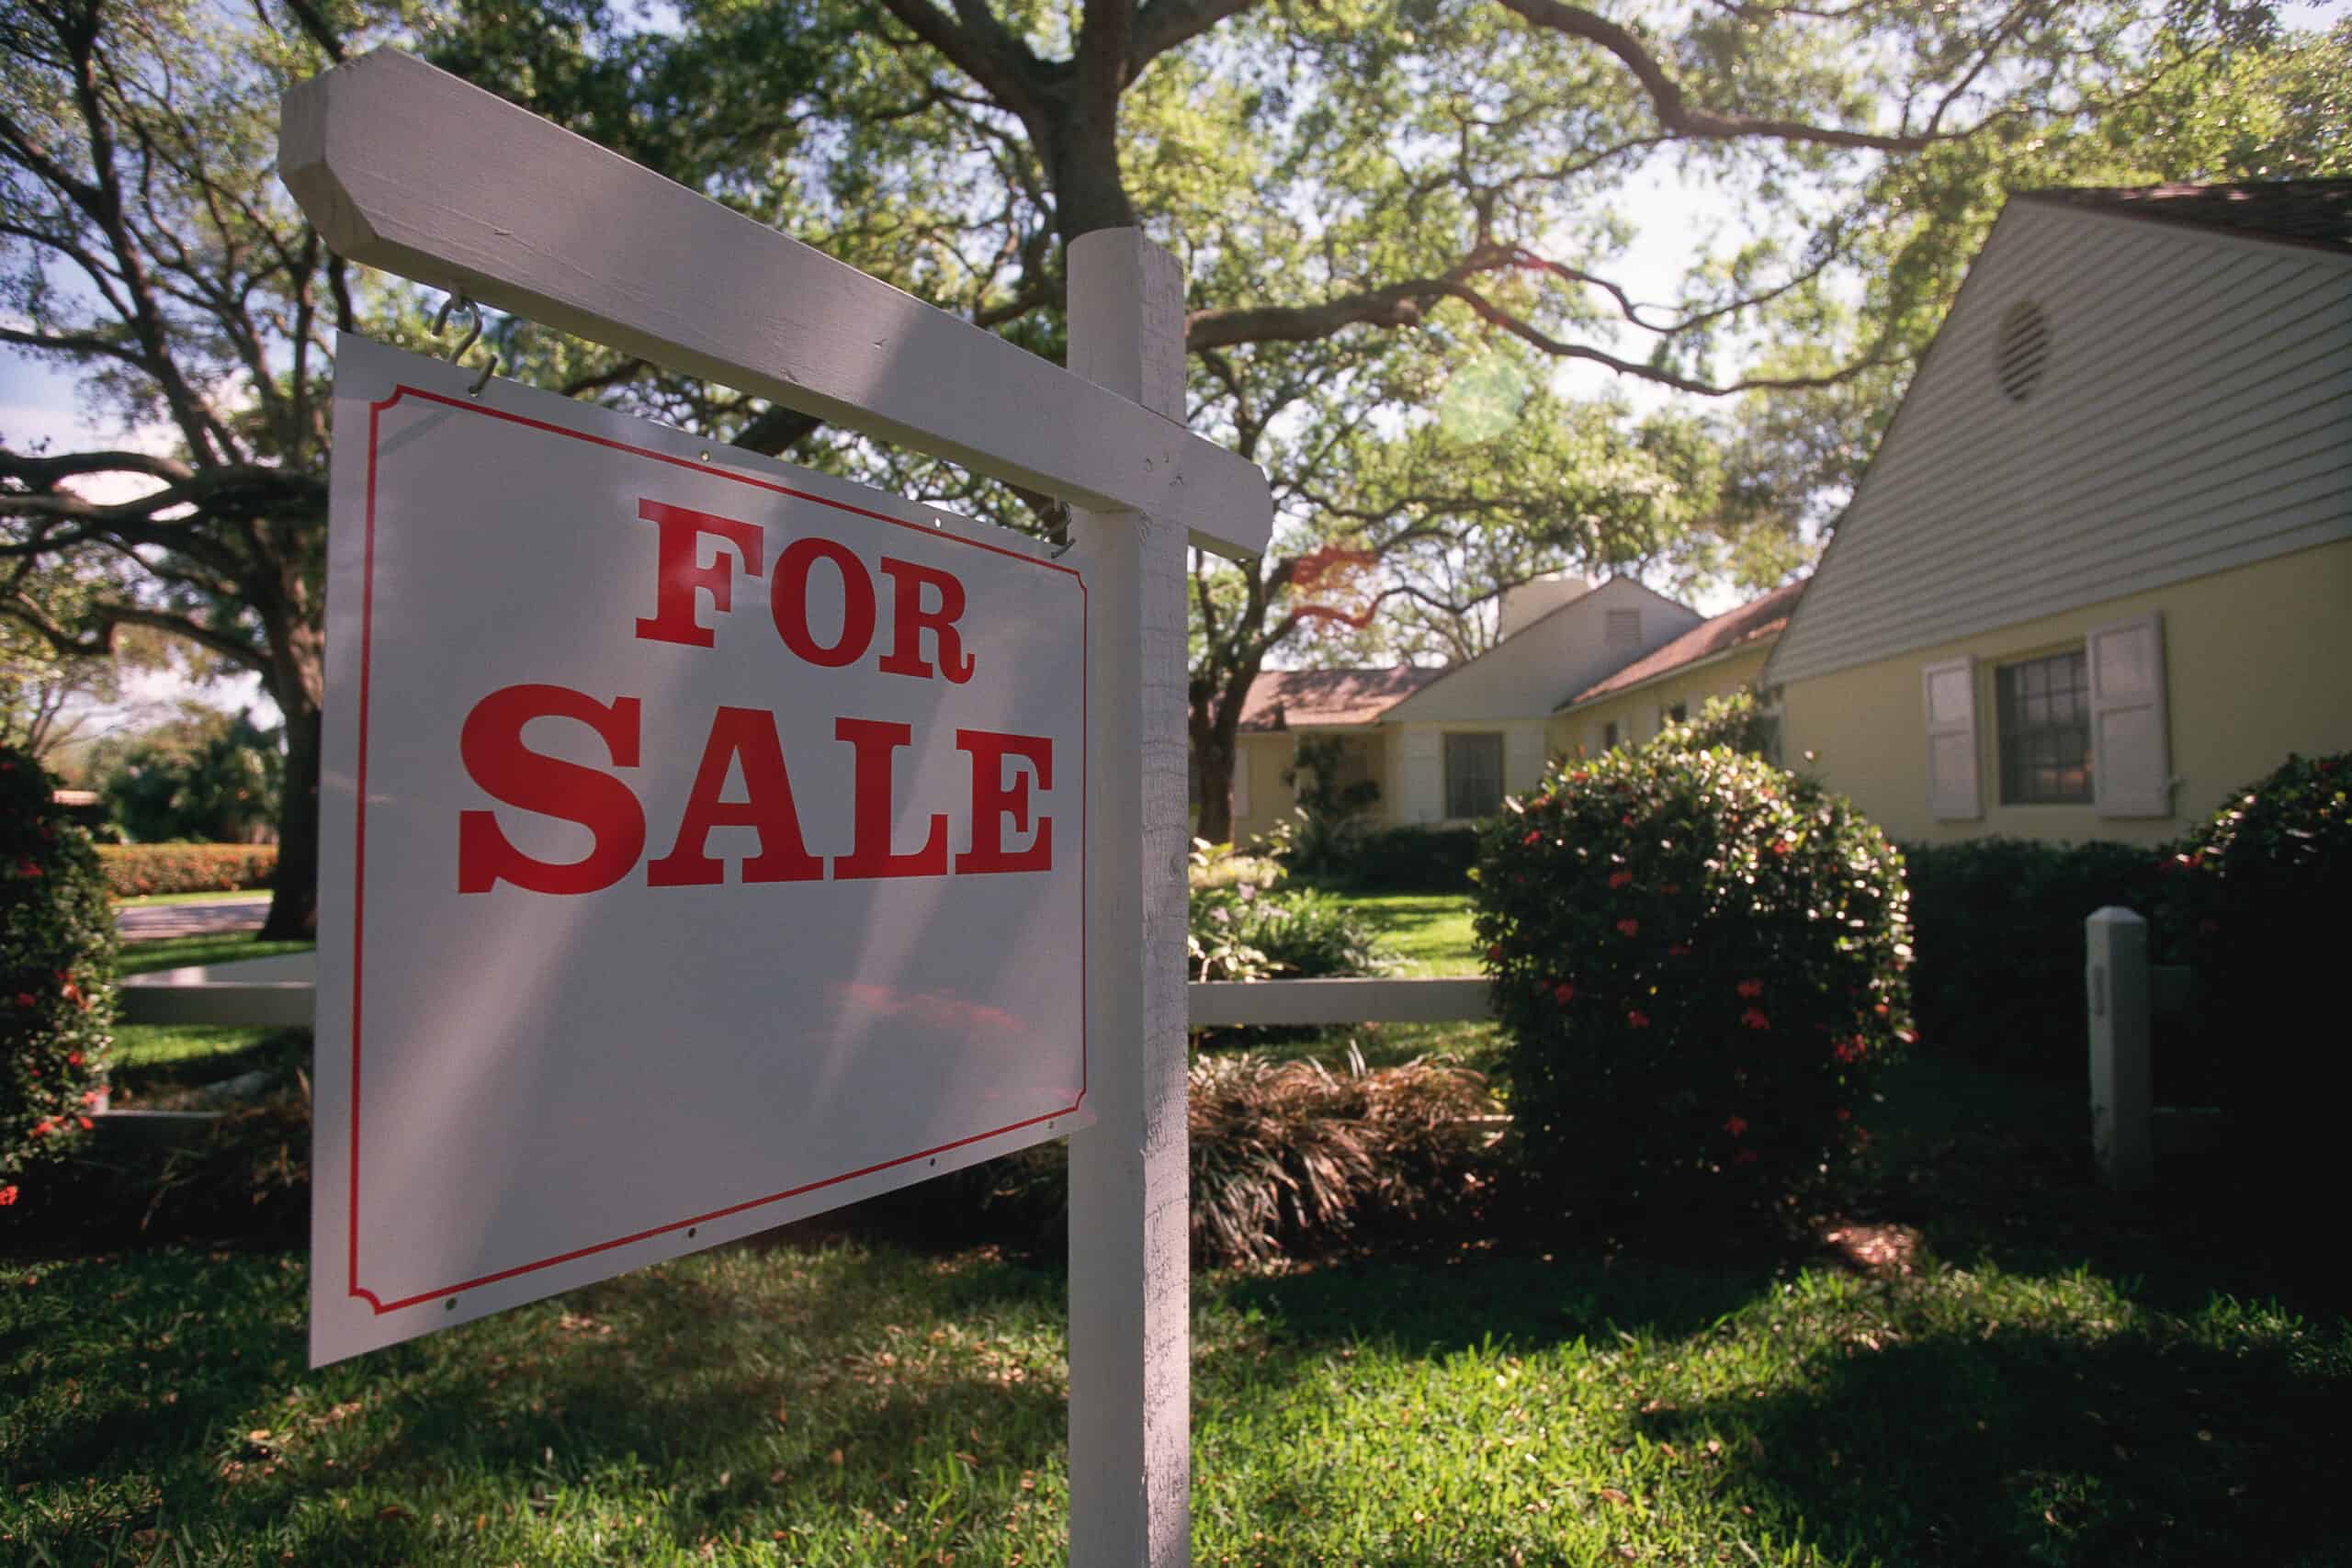
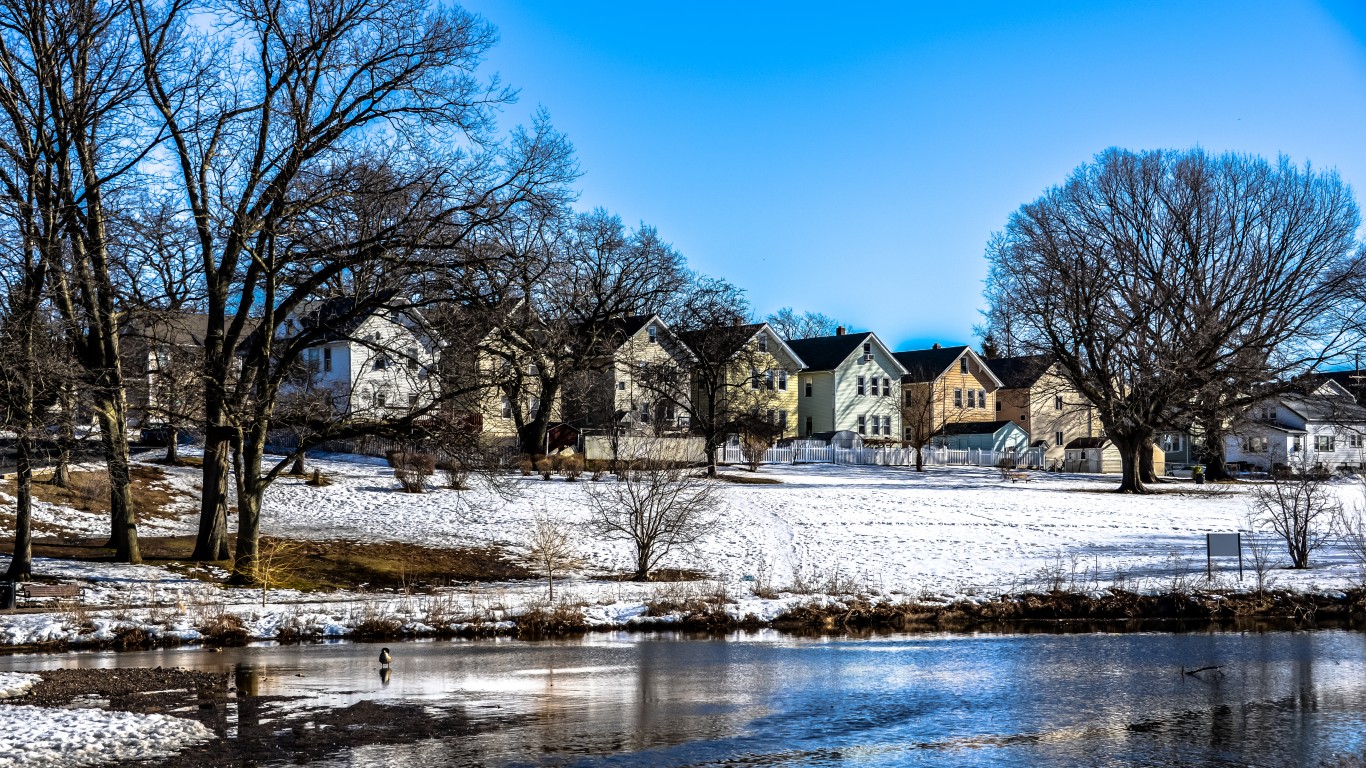
Still, housing prices are also subject to a number of factors that can be isolated from broader, nationwide market trends — and location is one of them. Two homes that are virtually identical can vary in price by hundreds of thousands of dollars, depending on where they are. And for prospective homeowners on a budget, some New Jersey cities are far more affordable than others.
According to five-year estimates from the U.S. Census Bureau’s 2022 American Community Survey, the typical home in New Jersey is worth $401,400. But across the 42 cities, towns, and unincorporated communities in the state with populations of at least 25,000, median home values range from less than $100,000 to over $970,000.
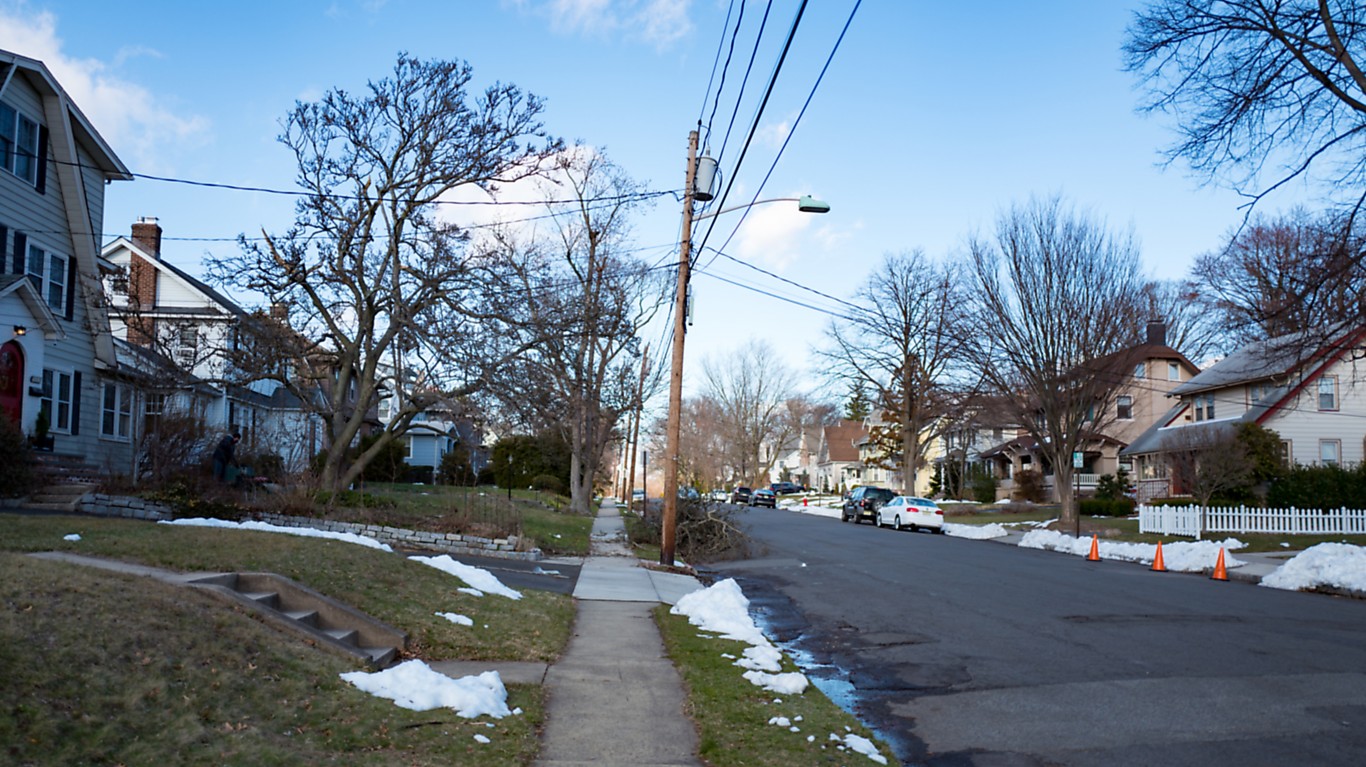
In any local market, home prices are often a reflection of what residents can afford. In New Jersey, many of the least expensive cities for homebuyers are not high-income areas. Of the 42 New Jersey cities with available data from the ACS, 22 have a median home value that is less than the statewide median. In all but two of these places, the typical household earns less than the statewide median household income of $97,126.


| Rank | Places in New Jersey with at least 25,000 residents | Median home value ($) | Homeownership rate (%) | Median household income ($) | Total Population |
|---|---|---|---|---|---|
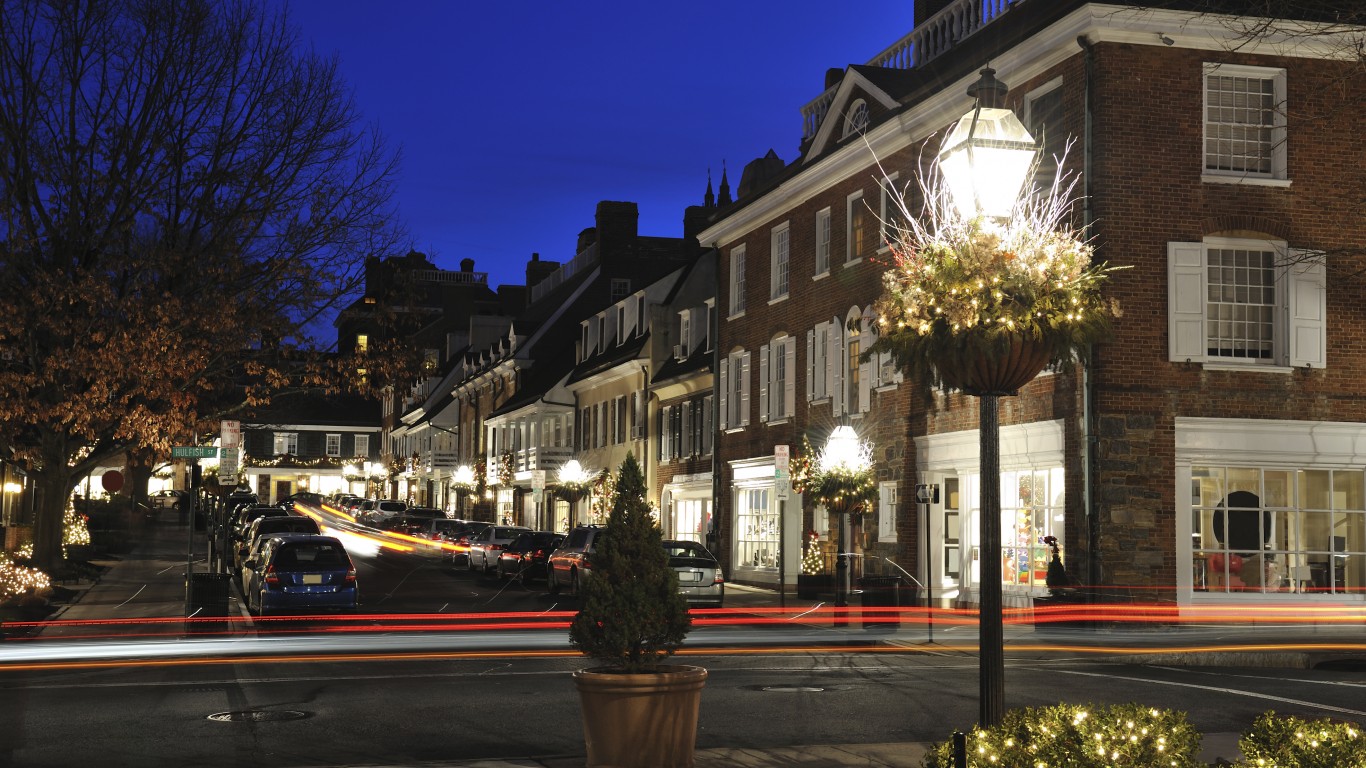
| 1 | Princeton | 971,200 | 58.6 | 176,695 | 30,450 |
| 2 | Westfield | 890,000 | 79.8 | 203,235 | 30,839 |
| 3 | Hoboken | 859,300 | 34.4 | 168,137 | 58,754 |
| 4 | Ridgewood | 858,900 | 83.0 | 211,224 | 26,043 |
| 5 | Paramus | 684,800 | 81.5 | 136,824 | 26,582 |
| 6 | Lakewood | 604,600 | 38.6 | 54,826 | 68,555 |
| 7 | Cliffside Park | 520,800 | 48.3 | 96,734 | 25,546 |
| 8 | Jersey City | 500,100 | 29.2 | 91,151 | 287,899 |
| 9 | Fair Lawn | 488,300 | 79.3 | 141,540 | 34,948 |
| 10 | Englewood | 453,200 | 54.6 | 93,134 | 29,109 |
| 11 | Union City | 448,000 | 19.7 | 59,967 | 67,258 |
| 12 | Long Branch | 446,800 | 42.6 | 72,234 | 31,932 |
| 13 | Old Bridge | 440,400 | 73.0 | 104,712 | 28,094 |
| 14 | Bergenfield | 437,700 | 69.6 | 121,738 | 28,223 |
| 15 | Garfield | 430,500 | 46.6 | 72,026 | 32,472 |
| 16 | Clifton | 428,000 | 57.5 | 94,179 | 89,451 |
| 17 | Lodi | 423,900 | 44.3 | 80,044 | 25,969 |
| 18 | Bayonne | 413,100 | 39.2 | 80,044 | 70,497 |
| 19 | West New York | 407,000 | 23.5 | 70,141 | 52,438 |
| 20 | Kearny | 404,000 | 47.2 | 81,307 | 41,157 |
| 21 | Fort Lee | 393,200 | 58.4 | 101,573 | 39,799 |
| 22 | Passaic | 379,800 | 22.0 | 57,832 | 70,048 |
| 23 | Sayreville | 377,600 | 63.6 | 95,250 | 45,136 |
| 24 | Elizabeth | 358,400 | 25.1 | 59,939 | 135,665 |
| 25 | Linden | 357,000 | 60.0 | 86,801 | 43,478 |
| 26 | Toms River | 356,100 | 80.6 | 92,012 | 92,827 |
| 27 | Hackensack | 353,000 | 36.5 | 79,133 | 45,758 |
| 28 | Plainfield | 351,500 | 44.1 | 70,712 | 54,358 |
| 29 | Rahway | 343,200 | 55.1 | 86,557 | 29,664 |
| 30 | Carteret | 337,500 | 54.4 | 79,049 | 25,161 |
| 31 | Perth Amboy | 327,700 | 35.3 | 56,239 | 55,226 |
| 32 | Paterson | 314,100 | 26.3 | 52,092 | 157,864 |
| 33 | Newark | 312,300 | 23.9 | 46,460 | 307,355 |
| 34 | New Brunswick | 289,800 | 20.2 | 57,138 | 55,718 |
| 35 | East Orange | 282,900 | 28.0 | 58,659 | 68,879 |
| 36 | Sicklerville | 232,000 | 81.3 | 97,576 | 45,853 |
| 37 | Vineland | 205,500 | 68.8 | 63,468 | 60,796 |
| 38 | Millville | 185,400 | 65.5 | 65,279 | 27,523 |
| 39 | Atlantic City | 174,200 | 30.8 | 35,188 | 38,487 |
| 40 | Bridgeton | 130,800 | 37.7 | 44,440 | 26,895 |
| 41 | Trenton | 111,200 | 38.3 | 44,444 | 90,055 |
| 42 | Camden | 95,700 | 37.2 | 36,258 | 71,799 |
After two decades of reviewing financial products I haven’t seen anything like this. Credit card companies are at war, handing out free rewards and benefits to win the best customers.
A good cash back card can be worth thousands of dollars a year in free money, not to mention other perks like travel, insurance, and access to fancy lounges.
Our top pick today pays up to 5% cash back, a $200 bonus on top, and $0 annual fee. Click here to apply before they stop offering rewards this generous.
Flywheel Publishing has partnered with CardRatings for our coverage of credit card products. Flywheel Publishing and CardRatings may receive a commission from card issuers.
Thank you for reading! Have some feedback for us?
Contact the 24/7 Wall St. editorial team.

Our expert who first called NVIDIA in 2009 is predicting 2025 will see a historic AI breakthrough.
You can follow him investing $500,000 of his own money on our top AI stocks for free.
