Incomes are rising rapidly in the United States. According to estimates from the U.S. Census Bureau, the national median household income was nearly $75,000 in 2022, up from about $69,700 in 2021. The 7.2% increase was the largest recorded year-over-year since at least the mid-1990s.
While the typical American household is earning more than ever before, incomes have not been rising fast enough to offset inflation. Throughout 2022, the average rate of inflation hit a 40-year high of 8%, four times the Federal Reserve’s 2% target rate. Accounting for the rising cost of living, real incomes in the U.S. fell by nearly 5% between 2019 and 2022.
While no one has been spared from surging prices, Americans on the low end of the income spectrum have bore the brunt. During inflationary periods, higher-income Americans can cut back on spending and reduce the impact of rising costs. Meanwhile, lower earning Americans, who spend a larger share of their income on necessities such as food, housing, and gas, cannot.
With a median household income of $91,905, California has one of the highest-earning populations of any state. Still, there are many parts of the state where the typical household earns far less than the statewide median.
Using five-year estimates from the U.S. Census Bureau’s 2022 American Community Survey, 24/7 Wall St. identified the 35 poorest counties in California. Counties in the state are ranked on median household income. Population, poverty, and unemployment data are also five-year estimates from the 2022 ACS.
Among the counties on this list, median household incomes are anywhere from about $8,500 to nearly $45,000 below the statewide median. In many of these counties, levels of financial hardship are underscored by widespread poverty. In all but seven counties on this list, the share of residents living below the poverty line exceeds the 12.1% statewide poverty rate.
In many of these places, lower than average incomes are attributable not only to low-paying jobs, but also to a lack of employment opportunities. According to the ACS, the average unemployment rate in California over the last five years stands at 6.4%. In 27 of the 35 counties on this list, the five-year average jobless rate exceeds the statewide average, and in some cases, is in the double-digits.
These are the poorest counties in California.
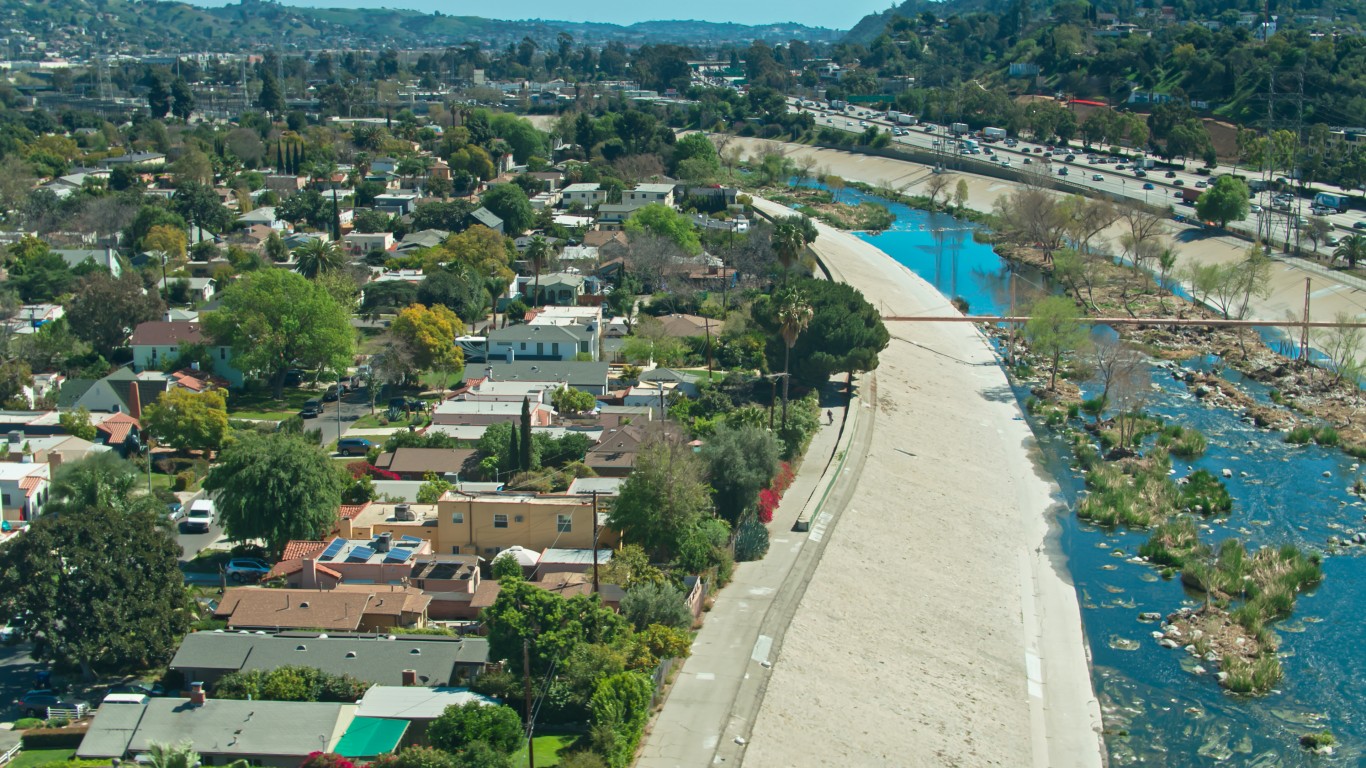
35. Los Angeles County

- Median household income: $83,411
- Poverty rate: 13.7%
- 5-yr. avg. unemployment rate: 7.0%
- Population: 9,936,690
34. San Joaquin County

- Median household income: $82,837
- Poverty rate: 12.9%
- 5-yr. avg. unemployment rate: 7.2%
- Population: 779,445
33. Mono County

- Median household income: $82,038
- Poverty rate: 11.3%
- 5-yr. avg. unemployment rate: 1.9%
- Population: 13,219
32. Nevada County

- Median household income: $79,395
- Poverty rate: 10.4%
- 5-yr. avg. unemployment rate: 4.4%
- Population: 102,322
31. Calaveras County

- Median household income: $77,526
- Poverty rate: 13.1%
- 5-yr. avg. unemployment rate: 6.2%
- Population: 45,674
30. San Bernardino County

- Median household income: $77,423
- Poverty rate: 13.8%
- 5-yr. avg. unemployment rate: 7.1%
- Population: 2,180,563
29. Stanislaus County

- Median household income: $74,872
- Poverty rate: 13.7%
- 5-yr. avg. unemployment rate: 8.2%
- Population: 552,063
28. Amador County
- Median household income: $74,853
- Poverty rate: 7.8%
- 5-yr. avg. unemployment rate: 6.0%
- Population: 40,577
27. Madera County

- Median household income: $73,543
- Poverty rate: 20.1%
- 5-yr. avg. unemployment rate: 11.1%
- Population: 157,243
26. Sutter County

- Median household income: $72,654
- Poverty rate: 13.3%
- 5-yr. avg. unemployment rate: 7.5%
- Population: 99,101
25. Tuolumne County

- Median household income: $70,432
- Poverty rate: 11.4%
- 5-yr. avg. unemployment rate: 8.3%
- Population: 54,993
24. Colusa County

- Median household income: $69,619
- Poverty rate: 10.9%
- 5-yr. avg. unemployment rate: 7.4%
- Population: 21,811
23. Kings County
- Median household income: $68,540
- Poverty rate: 16.2%
- 5-yr. avg. unemployment rate: 8.4%
- Population: 152,515
22. Shasta County

- Median household income: $68,347
- Poverty rate: 13.3%
- 5-yr. avg. unemployment rate: 6.5%
- Population: 181,852
21. Plumas County

- Median household income: $67,885
- Poverty rate: 10.9%
- 5-yr. avg. unemployment rate: 8.0%
- Population: 19,650
20. Fresno County

- Median household income: $67,756
- Poverty rate: 19.5%
- 5-yr. avg. unemployment rate: 8.6%
- Population: 1,008,280
19. Yuba County

- Median household income: $66,693
- Poverty rate: 15.4%
- 5-yr. avg. unemployment rate: 6.9%
- Population: 81,705
18. Butte County

- Median household income: $66,085
- Poverty rate: 18.2%
- 5-yr. avg. unemployment rate: 7.1%
- Population: 213,605
17. Merced County

- Median household income: $64,772
- Poverty rate: 18.5%
- 5-yr. avg. unemployment rate: 10.7%
- Population: 282,290
16. Tulare County

- Median household income: $64,474
- Poverty rate: 18.5%
- 5-yr. avg. unemployment rate: 9.0%
- Population: 473,446
15. Glenn County

- Median household income: $64,033
- Poverty rate: 15.3%
- 5-yr. avg. unemployment rate: 7.7%
- Population: 28,657
14. Kern County

- Median household income: $63,883
- Poverty rate: 19.3%
- 5-yr. avg. unemployment rate: 8.3%
- Population: 906,883
13. Inyo County

- Median household income: $63,417
- Poverty rate: 11.9%
- 5-yr. avg. unemployment rate: 4.9%
- Population: 18,829
12. Mendocino County

- Median household income: $61,335
- Poverty rate: 16.2%
- 5-yr. avg. unemployment rate: 9.1%
- Population: 91,145
11. Del Norte County

- Median household income: $61,149
- Poverty rate: 14.3%
- 5-yr. avg. unemployment rate: 6.3%
- Population: 27,462
10. Sierra County

- Median household income: $61,108
- Poverty rate: 12.6%
- 5-yr. avg. unemployment rate: 5.6%
- Population: 2,916
9. Mariposa County

- Median household income: $60,021
- Poverty rate: 16.0%
- 5-yr. avg. unemployment rate: 6.2%
- Population: 17,130
8. Lassen County

- Median household income: $59,515
- Poverty rate: 15.2%
- 5-yr. avg. unemployment rate: 7.9%
- Population: 31,873
7. Tehama County

- Median household income: $59,029
- Poverty rate: 16.2%
- 5-yr. avg. unemployment rate: 7.4%
- Population: 65,484
6. Humboldt County

- Median household income: $57,881
- Poverty rate: 19.8%
- 5-yr. avg. unemployment rate: 9.2%
- Population: 136,132
5. Lake County

- Median household income: $56,259
- Poverty rate: 16.6%
- 5-yr. avg. unemployment rate: 10.4%
- Population: 68,024
4. Modoc County

- Median household income: $54,962
- Poverty rate: 16.9%
- 5-yr. avg. unemployment rate: 7.6%
- Population: 8,651
3. Siskiyou County

- Median household income: $53,898
- Poverty rate: 16.7%
- 5-yr. avg. unemployment rate: 7.4%
- Population: 44,049
2. Imperial County

- Median household income: $53,847
- Poverty rate: 21.1%
- 5-yr. avg. unemployment rate: 13.1%
- Population: 179,578
1. Trinity County

- Median household income: $47,317
- Poverty rate: 22.0%
- 5-yr. avg. unemployment rate: 7.3%
- Population: 15,889
| Rank | County | Median household income ($) | Poverty rate (%) | 5-yr. avg. unemployment rate (%) |
|---|---|---|---|---|
| 1 | Trinity, California | 47,317 | 22.0 | 7.3 |
| 2 | Imperial, California | 53,847 | 21.1 | 13.1 |
| 3 | Siskiyou, California | 53,898 | 16.7 | 7.4 |
| 4 | Modoc, California | 54,962 | 16.9 | 7.6 |
| 5 | Lake, California | 56,259 | 16.6 | 10.4 |
| 6 | Humboldt, California | 57,881 | 19.8 | 9.2 |
| 7 | Tehama, California | 59,029 | 16.2 | 7.4 |
| 8 | Lassen, California | 59,515 | 15.2 | 7.9 |
| 9 | Mariposa, California | 60,021 | 16.0 | 6.2 |
| 10 | Sierra, California | 61,108 | 12.6 | 5.6 |
| 11 | Del Norte, California | 61,149 | 14.3 | 6.3 |
| 12 | Mendocino, California | 61,335 | 16.2 | 9.1 |
| 13 | Inyo, California | 63,417 | 11.9 | 4.9 |
| 14 | Kern, California | 63,883 | 19.3 | 8.3 |
| 15 | Glenn, California | 64,033 | 15.3 | 7.7 |
| 16 | Tulare, California | 64,474 | 18.5 | 9.0 |
| 17 | Merced, California | 64,772 | 18.5 | 10.7 |
| 18 | Butte, California | 66,085 | 18.2 | 7.1 |
| 19 | Yuba, California | 66,693 | 15.4 | 6.9 |
| 20 | Fresno, California | 67,756 | 19.5 | 8.6 |
| 21 | Plumas, California | 67,885 | 10.9 | 8.0 |
| 22 | Shasta, California | 68,347 | 13.3 | 6.5 |
| 23 | Kings, California | 68,540 | 16.2 | 8.4 |
| 24 | Colusa, California | 69,619 | 10.9 | 7.4 |
| 25 | Tuolumne, California | 70,432 | 11.4 | 8.3 |
| 26 | Sutter, California | 72,654 | 13.3 | 7.5 |
| 27 | Madera, California | 73,543 | 20.1 | 11.1 |
| 28 | Amador, California | 74,853 | 7.8 | 6.0 |
| 29 | Stanislaus, California | 74,872 | 13.7 | 8.2 |
| 30 | San Bernardino, California | 77,423 | 13.8 | 7.1 |
| 31 | Calaveras, California | 77,526 | 13.1 | 6.2 |
| 32 | Nevada, California | 79,395 | 10.4 | 4.4 |
| 33 | Mono, California | 82,038 | 11.3 | 1.9 |
| 34 | San Joaquin, California | 82,837 | 12.9 | 7.2 |
| 35 | Los Angeles, California | 83,411 | 13.7 | 7.0 |
Travel Cards Are Getting Too Good To Ignore (sponsored)
Credit card companies are pulling out all the stops, with the issuers are offering insane travel rewards and perks.
We’re talking huge sign-up bonuses, points on every purchase, and benefits like lounge access, travel credits, and free hotel nights. For travelers, these rewards can add up to thousands of dollars in flights, upgrades, and luxury experiences every year.
It’s like getting paid to travel — and it’s available to qualified borrowers who know where to look.
We’ve rounded up some of the best travel credit cards on the market. Click here to see the list. Don’t miss these offers — they won’t be this good forever.
Thank you for reading! Have some feedback for us?
Contact the 24/7 Wall St. editorial team.


